

HTLV-1 bZIP Factor-Induced Reprogramming of Lactate Metabolism and Epigenetic Status Promote Leukemic Cell Expansion
- PMID: 37162520
- PMCID: PMC10473166
- DOI: 10.1158/2643-3230.BCD-22-0139
HTLV-1 bZIP Factor-Induced Reprogramming of Lactate Metabolism and Epigenetic Status Promote Leukemic Cell Expansion
Abstract
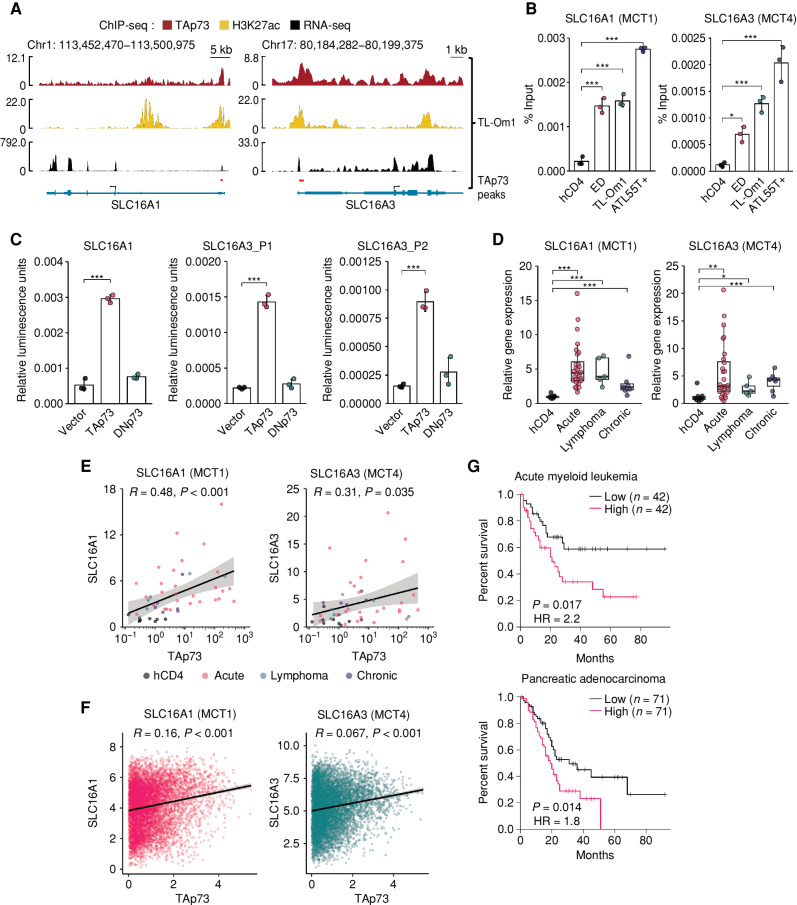
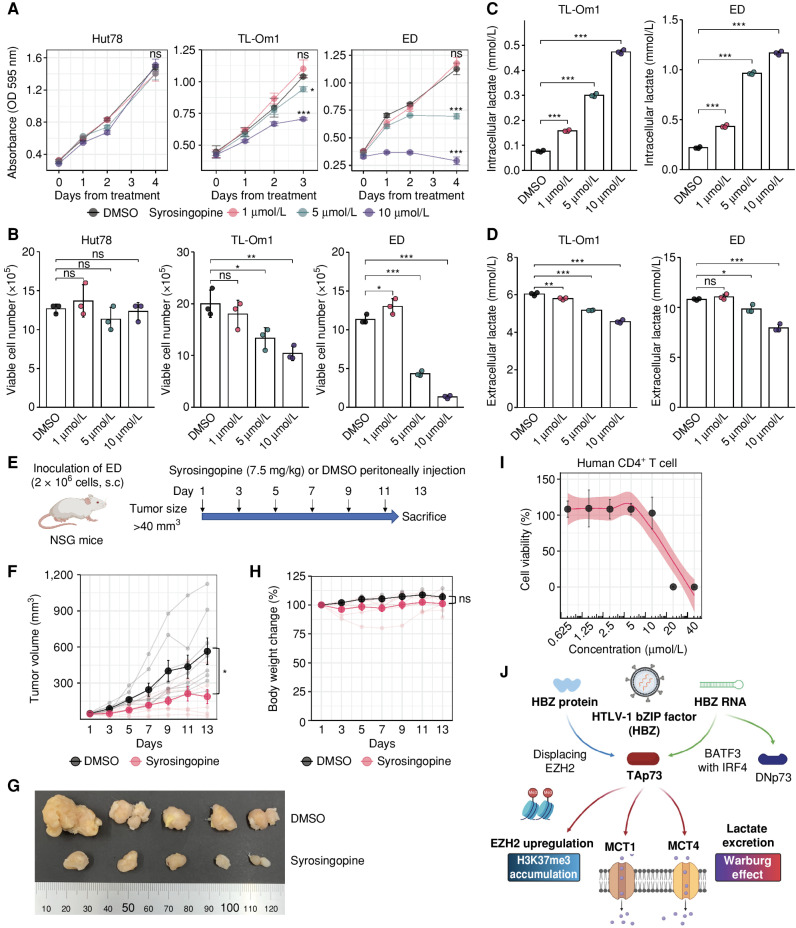
Acceleration of glycolysis is a common trait of cancer. A key metabolite, lactate, is typically secreted from cancer cells because its accumulation is toxic. Here, we report that a viral oncogene, HTLV-1 bZIP factor (HBZ), bimodally upregulates TAp73 to promote lactate excretion from adult T-cell leukemia-lymphoma (ATL) cells. HBZ protein binds to EZH2 and reduces its occupancy of the TAp73 promoter. Meanwhile, HBZ RNA activates TAp73 transcription via the BATF3-IRF4 machinery. TAp73 upregulates the lactate transporters MCT1 and MCT4. Inactivation of TAp73 leads to intracellular accumulation of lactate, inducing cell death in ATL cells. Furthermore, TAp73 knockout diminishes the development of inflammation in HBZ-transgenic mice. An MCT1/4 inhibitor, syrosingopine, decreases the growth of ATL cells in vitro and in vivo. MCT1/4 expression is positively correlated with TAp73 in many cancers, and MCT1/4 upregulation is associated with dismal prognosis. Activation of the TAp73-MCT1/4 pathway could be a common mechanism contributing to cancer metabolism.
Significance: An antisense gene encoded in HTLV-1, HBZ, reprograms lactate metabolism and epigenetic modification by inducing TAp73 in virus-positive leukemic cells. A positive correlation between TAp73 and its target genes is also observed in many other cancer cells, suggesting that this is a common mechanism for cellular oncogenesis. This article is featured in Selected Articles from This Issue, p. 337.
©2023 The Authors; Published by the American Association for Cancer Research.
Figures
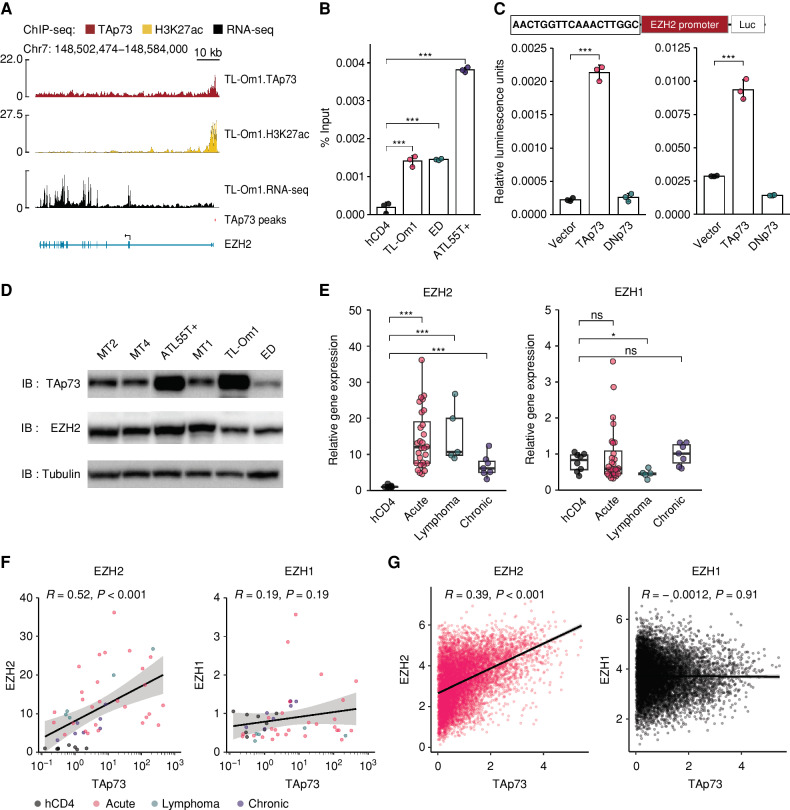
![Figure 2. HBZ protein alters EZH2 genome-wide distribution and decreases its binding to the TAp73 promoter. A, GSEA plots for mouse CD4+ T cells transduced with WT or mutant HBZ compared with the vector. The normalized enrichment score (NES) and q-value are listed. B, Immunoprecipitation (IP) with anti-Flag antibody (Flag-HBZ) showing interaction between HBZ protein and EZH2 in HEK293T cells. IP was analyzed by SDS-PAGE and immunoblotting (IB). C–E, ChIP-qPCR for EZH2 and H3K27me3 in the TAp73 promoter region. The %Input is shown for WT or HBZ-Tg mouse CD4+ T cells (C), human CD4+ T cells from healthy donors (hCD4) or ATL cell lines (D), and Jurkat cells with stable transduction of WT or mutant HBZ (E; n = 3). F, Histone methyltransferase (HMT) activity on H3K27 among transduced Jurkat cells (n = 3). G and H, Heat maps for genomic regions with enriched ChIP-seq scores for H3K27me3. The score for each region was scaled and clustered based on healthy human donor CD4+ T cells (hCD4; G) or WT mouse CD4+ T cells (H) with transcription start site (TSS) and transcription end site (TES) labeling. In addition to Treg, ATL cells (TL-Om1 and ED; G) and cells from HBZ-Tg mice (H) were analyzed. I, Representative genes found in cluster 2 that were shared between the results from human and mouse cells in G and H, respectively. J, Results of KEGG pathway analysis using the genes in cluster 2 for humans (G). Shared pathways between human and mouse cells are highlighted in red. Statistical values and gene counts calculated by the clusterProfiler are shown. K and L, Scatter plots of mouse cluster 2 genes resulting from combinational analysis of RNA-seq (HBZ-Tg mouse CD4+ T cells relative to WT) and ChIP-seq [relative enrichments in TSS of WT as area under the curve (AUC)] for EZH2 (K) and H3K27me3 (L). Results are plotted as mean ± SD, using Student t test (C) or one-way ANOVA with the post hoc Dunnet test (D–F). *, P < 0.05; **, P < 0.01; ***, P < 0.001; ns, not significant.](https://cdn.ncbi.nlm.nih.gov/pmc/blobs/c3de/10473166/b2b2d7ad393d/374fig2.jpg)
References
-
- Hanahan D, Weinberg RA. Hallmarks of cancer: the next generation. Cell 2011;144:646–74. - PubMed
-
- Hanahan D. Hallmarks of cancer: new dimensions. Cancer Discov 2022;12:31–46. - PubMed
-
- Warburg O. On the origin of cancer cells. Science 1956;123:309–14. - PubMed
-
- Koppenol WH, Bounds PL, Dang CV. Otto Warburg's contributions to current concepts of cancer metabolism. Nat Rev Cancer 2011;11:325–37. - PubMed
Publication types
MeSH terms
Substances
LinkOut - more resources
Full Text Sources
Miscellaneous
