[Preprint]. 2023 Apr 27:2023.04.26.538491.
doi: 10.1101/2023.04.26.538491.

TorsinA is essential for the timing and localization of neuronal nuclear pore complex biogenesis

Affiliations

TorsinA is essential for the timing and localization of neuronal nuclear pore complex biogenesis

Sumin Kim et al. bioRxiv. .

Update in

Abstract

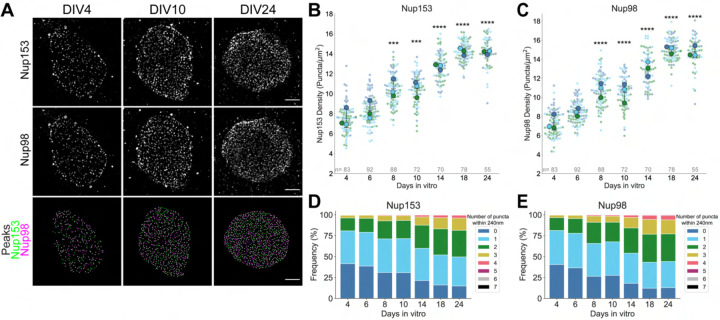
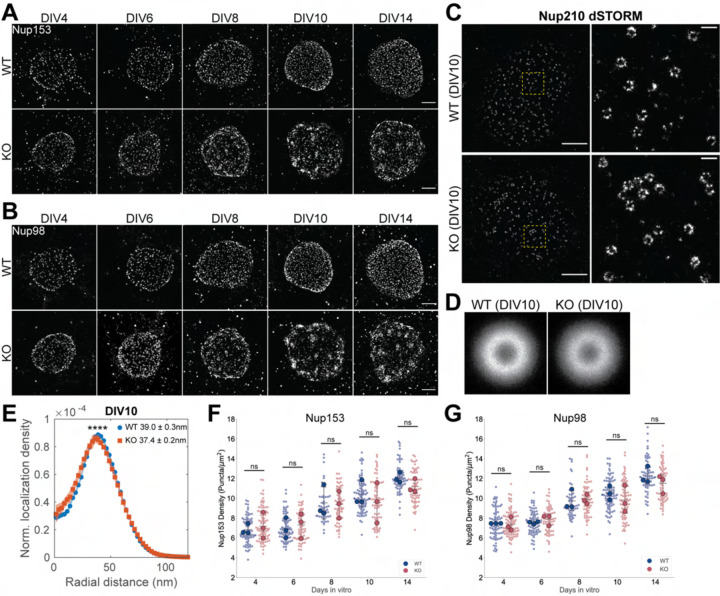
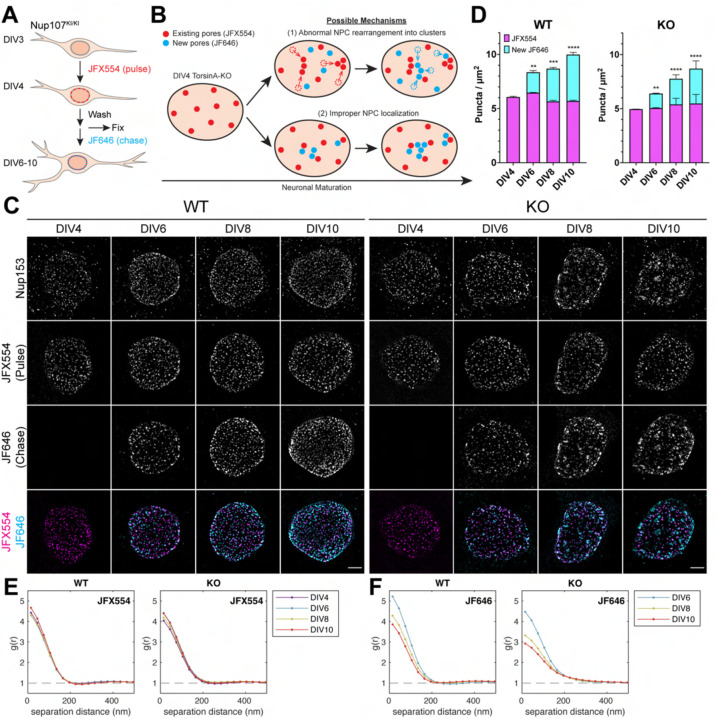
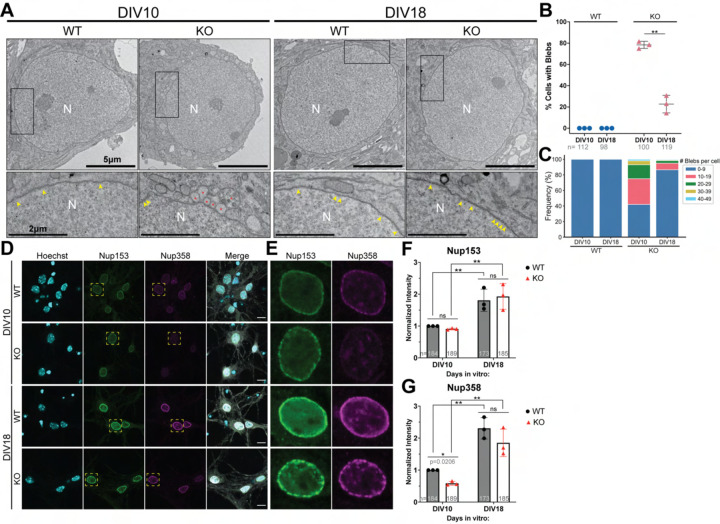
Nuclear pore complexes (NPCs) regulate information transfer between the nucleus and cytoplasm. NPC defects are linked to several neurological diseases, but the processes governing NPC biogenesis and spatial organization are poorly understood. Here, we identify a temporal window of strongly upregulated NPC biogenesis during neuronal maturation. We demonstrate that the AAA+ protein torsinA, whose loss of function causes the neurodevelopmental movement disorder DYT-TOR1A (DYT1) dystonia, coordinates NPC spatial organization during this period without impacting total NPC density. Using a new mouse line in which endogenous Nup107 is Halo-Tagged, we find that torsinA is essential for correct localization of NPC formation. In the absence of torsinA, the inner nuclear membrane buds excessively at sites of mislocalized, nascent NPCs, and NPC assembly completion is delayed. Our work implies that NPC spatial organization and number are independently regulated and suggests that torsinA is critical for the normal localization and assembly kinetics of NPCs.


Conflict of interest statement

Competing interests: The authors declare no competing interests.

Figures

Figure 1:
Figure 1:. Nuclear pore complex biogenesis is upregulated during neuronal maturation
A. Structured illumination microscopy (SIM) images of primary neurons aged DIV4, 10, and 24 labeled with anti-Nup153 and anti-Nup98 antibodies. Bottom row shows identified Nup153 and 98 peaks. Scale bar = 2μm. B. Superplots of Nup153 density (puncta/μm2) over time in primary neurons. Plots show mean + SD, with color coding indicative of biological replicates. Repeated measures one-way ANOVA with Dunnett’s multiple comparisons test was performed, with DIV4 as the reference condition. ***P=0.0006, ****P<0.0001. Total number of analyzed nuclei are represented as “n”. C. Superplots of Nup98 density (puncta/μm2) over time in primary neurons. Repeated measures one-way ANOVA with Dunnett’s multiple comparisons test was performed, with DIV4 as the reference condition. ****P<0.0001. D, E. Frequency distribution of Nup153 (D) and Nup98 (E) puncta found within two-pore diameter (240nm) distance. For each identified Nup153 and Nup98 peak, the number of neighboring puncta within a radius of 240nm was calculated. Results from three biological replicates were combined at each timepoint.
Figure 2:
Figure 2:. TorsinA is essential for uniform NPC distribution but not upregulation of NPC biogenesis
A, B. SIM images of WT and torsinA-KO primary neurons aged DIV4, 6, 8, 10, and 14 labeled with anti-Nup153 (A) and anti-Nup98 (B) antibodies. Scale bar = 2μm. C. dSTORM images of Nup210-labeled NPCs in DIV10 WT and torsinA-KO neurons. Scale bar = 2nm. Right panels show zoomed in view of boxed regions. Scale bar of right panels = 200nm. D. Averaged aligned DIV10 WT and torsinA-KO pores. E. Normalized localization density along radial distance in averaged WT and KO pores. Plots show mean + SEM from eight bootstrapping rounds with 250 randomly selected pores each. ****P<0.0001. F, G. Nup153 (F) and Nup98 (G) density (puncta/μm2) in maturing primary neurons. Plots show mean + SD. Timepoints from each replicate were matched and repeated measures two-way ANOVA with Sidak’s multiple comparisons test was performed to compare means between genotypes. ns, not significant.
Figure 3:
Figure 3:. Neurons bearing a novel HaloTag-Nup107 knock-in allele demonstrate endogenous NPC upregulation
A. Schematic of HaloTag-Nup107 fusion, including 5’ untranslated region (UTR, light grey), HaloTag open reading frame (magenta), flexible linker (dark grey) and Nup107 coding sequence (cyan). B. Confocal images of DIV10 neurons derived from Nup107+/+, Nup107KI/+, and Nup107KI/KI mice labeled with JF646 HaloTag ligand. Scale bar = 20μm. C. SIM images of Nup107KI/KI primary neurons at DIV4, 10, and 18 labeled with JFX554 HaloTag ligand and anti-Nup153 antibody. D, E. Superplots of Nup153 (D) and JFX554 (E) puncta density in primary neurons aged DIV4, 10, 18. Plots show mean + SD, with color coding indicative of biological replicates. Repeated measures one-way ANOVA with Dunnett’s multiple comparisons test was performed, with DIV4 as the reference condition; ****P<0.0001. Number of analyzed nuclei are represented as “n”. F. Frequency distribution of nearest neighbor distances of JFX554 puncta. For each JFX554 peak, the distance to its nearest neighbor was calculated. Results from three biological replicates were combined. G. Frequency distribution of JFX554 puncta within two-pore diameter (240nm) distance. For each JFX554 peak, the number of neighboring puncta within a radius of 240nm was calculated. Results from three biological replicates were combined.
Figure 4:
Figure 4:. Sites of NPC biogenesis are abnormal in torsinA-KO neurons
A. Schematic of HaloTag pulse-chase experiment. B. Diagram of potential mechanisms for NPC clustering in torsinA-KO neurons. In (1), NPCs redistribute after formation, leading to clusters of existing and newly formed NPCs. In (2), sites of NPC biogenesis are mislocalized and clusters exclusively contain new NPCs. Red circles represent existing NPCs (pulse; JFX554). Blue circles represent new NPCs (chase; JF646). C. HaloTag pulse-chase SIM images of WT and torsinA-KO neurons. Neurons were stained with anti-Nup153 antibody post-fixation to label the total NPC population. Scale bar = 2μm. D. Density of JFX554 puncta and new JF646 puncta in DIV 4, 6, 8, and 10 WT and torsinA-KO HaloTag-Nup107 neurons. Plots show mean + SD. Using DIV4 values as a reference, repeated measures two-way ANOVA with Dunnett’s test was performed. **P<0.01, ***P<0.001, ****P<0.0001. E. Autocorrelation of JFX554 images over 0–500nm separation distance. Similar starting amplitudes reflect constant JFX554 density. F. Autocorrelation of JF646 images over 0–500nm separation distance. Decreasing starting amplitudes over neuronal maturation reflect increasing JF646 density. Broadening of the curve in torsinA-KO neurons indicates spatial correlation of NPCs over larger distances.
Figure 5:
Figure 5:. NE blebs spatially and temporally coincide with NPC biogenesis
A. Transmission electron microscopy (TEM) images of WT and torsinA-KO neurons at DIV4 and DIV10. N=nucleus. Fully-formed NPCs are marked with yellow arrowheads. NE blebs identified by blinded analysis are marked with red asterisks. Scale bar = 5μm for the top row, 2μm for inset. B. Quantitation of TEM images. Each point represents the % of cells with at least one NE bleb from each biological replicate. n shows the total number of cells analyzed across all replicates. **P=0.0043, paired t-test. C. Frequency of NE blebs per cell from all replicates. D. Slices from a DIV10 torsinA-KO tomogram overlayed with segmented contours of the outer nuclear membrane (cyan), inner nuclear membrane (magenta), membranes inside blebs (green), and central plug of pores (yellow). E. Rotated view of tomogram in (D) to show an XY view intersecting the center of two blebs at the yellow dashed line. Red and white arrows label pores with central plugs. The rotated view (right) demonstrates that these pores form the base of each bleb.
Figure 6:
Figure 6:. NPC assembly completes following NE bleb resolution
A. TEM images of WT and torsinA-KO neurons at DIV10 and DIV18. N=nucleus. Fully formed NPCs are marked with yellow arrowheads. NE blebs identified in blinded analysis are marked with red asterisks. Scale bar= 5μm for the top row, 2μm for inset. B. Quantitation of TEM images. Each point represents the % of cells with at least one NE bleb from each of 3 biological replicates. n shows the total number of cells that were analyzed across all replicates. **P=0.006; paired t-test. C. Frequency of NE blebs per cell from all replicates. D. Confocal images of DIV10 and DIV18 WT and torsinA-KO neurons labeled with Hoechst, Nup153, Nup358, and Map2 (shown in merge). Scale bar = 10μm. E. Zoomed in view of Nup153 and Nup358 channels of nuclei marked with yellow boxes in (D). F, G. Normalized Nup153 (F) and Nup358 (G) nuclear rim intensity of DIV10 and DIV18 WT and torsinA-KO primary neurons. ns, not significant; **P <0.01, repeated measures two-way ANOVA with Sidak’s multiple comparisons test.
Figure 7:
Figure 7:. Summary of the effects of torsinA loss on NPC spatial organization and dynamics
A. Model of interphase NPC assembly in WT and torsinA-KO neurons. Onset of NPC assembly is not affected by torsinA deletion. Nuclear basket, inner ring, and transmembrane nucleoporins are recruited to the de novo NPC as the INM starts to bud. Instead of the normal INM-ONM fusion found in WT neurons, excessive INM extrusion causes NE blebs to emerge and enlarge in torsinA-KO neurons. These blebs stall torsinA-KO NPCs at an intermediate stage while WT NPC assembly completes. As torsinA-KO neurons continue to mature, NE blebs resolve and INM-ONM fusion occurs. Completion of NPC biogenesis is delayed in torsinA-KO neurons. B. Model of NPC localization in maturing WT (top) and torsinA-KO (bottom) neurons. In WT neurons, newly forming NPCs (blue) localize to empty spaces between existing NPCs (red), thereby maintaining uniform spatial organization. In maturing torsinA-KO neurons, newly forming NPCs (blue) localize abnormally close to each other or to existing NPCs (red), causing aberrant clusters. NPC biogenesis is upregulated in both genotypes and total NPC number is not affected by the absence of torsinA.

References

    1. Knockenhauer K.E., and Schwartz T.U. (2016). The Nuclear Pore Complex as a Flexible and Dynamic Gate. Cell 164, 1162–1171. 10.1016/j.cell.2016.01.034. - DOI - PMC - PubMed
    1. Beck M., and Hurt E. (2016). The nuclear pore complex: understanding its function through structural insight. Nat. Rev. Mol. Cell Biol. 18, 73–89. 10.1038/nrm.2016.147. - DOI - PubMed
    1. Kandel E.R. (2001). The Molecular Biology of Memory Storage: A Dialogue Between Genes and Synapses. Science 294, 1030–1038. 10.1126/science.1067020. - DOI - PubMed
    1. Cohen S., and Greenberg M.E. (2008). Communication Between the Synapse and the Nucleus in Neuronal Development, Plasticity, and Disease. Annu. Rev. Cell Dev. Biol. 24, 183–209. 10.1146/annurev.cellbio.24.110707.175235. - DOI - PMC - PubMed
    1. Karpova A., Mikhaylova M., Bera S., Bär J., Reddy P.P., Behnisch T., Rankovic V., Spilker C., Bethge P., Sahin J., et al. (2013). Encoding and Transducing the Synaptic or Extrasynaptic Origin of NMDA Receptor Signals to the Nucleus. Cell 152, 1119–1133. 10.1016/j.cell.2013.02.002. - DOI - PubMed

Publication types