[Preprint]. 2023 Apr 26:2023.04.25.538222.
doi: 10.1101/2023.04.25.538222.

Competition between transcription and loop extrusion modulates promoter and enhancer dynamics

Affiliations

Competition between transcription and loop extrusion modulates promoter and enhancer dynamics

Angeliki Platania et al. bioRxiv. .

Update in

Abstract

The spatiotemporal configuration of genes with distal regulatory elements, and the impact of chromatin mobility on transcription, remain unclear. Loop extrusion is an attractive model for bringing genetic elements together, but how this functionally interacts with transcription is also largely unknown. We combine live tracking of genomic loci and nascent transcripts with molecular dynamics simulations to assess the 4D arrangement of the Sox2 gene and its enhancer, in response to a battery of perturbations. We find that alterations in chromatin mobility, not promoter-enhancer distance, is more informative about transcriptional status. Active elements display more constrained mobility, consistent with confinement within specialized nuclear sites, and alterations in enhancer mobility distinguish poised from transcribing alleles. Strikingly, we find that whereas loop extrusion and transcription factor-mediated clustering contribute to promoter-enhancer proximity, they have antagonistic effects on chromatin dynamics. This provides an experimental framework for the underappreciated role of chromatin dynamics in genome regulation.

Keywords: Chromatin dynamics; anomalous diffusion; enhancer; live imaging; molecular dynamics; transcription.


Conflict of interest statement

DECLARATION OF INTERESTS The authors declare no competing interests.

Figures
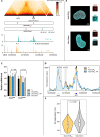
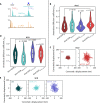
Figure 1.
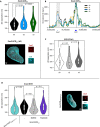
Figure 1.. parS/ParB labeling of specific sites at the Sox2 locus.
a) Overview of the Sox2 locus used in this study, showing (top to bottom): Hi-C map in ESCs (data from ref 60), showing the TAD delimited by the Sox2 gene and SCR (positions shown in blue, and the locations of specific SCR regulatory elements SRR107 and SRR111 shown in black, below the map); scaled positions of ANCH1 and ANCH3 labels inserted in the Sox2-SCRWT and Inter-Down ESC lines; ESC ChIP-seq profiles for the active histone mark, acetylation of histone H3 lysine-27 (H3K27ac; cyan) and CTCF (orange) at the same locus (data from ref 88). Orientations of the motifs of the major CTCF sites are denoted by arrows above the CTCF ChIP-seq profile; the red arrows denote the positions of CTCF sites that are perturbed in this study. b) Representative images of Sox2-SCRWT (top) and Inter-Down (bottom) nuclei (after segmentation and removal of cytoplasmic signal), with the OR3-IRFP signal shown in red and the OR1-EGFP signal shown in cyan; scale bar 2 μm. Insets show zoomed regions around spots corresponding to bound parS sequences. c) Allele-specific qRT-PCR quantification, normalized to SDHA, of Sox2 expression in F1, Sox2-SCRWT before and after transfection with ParB vectors (OR), and Inter-Down ESCs (n>=3). Error bars indicate standard deviations from the mean. For both alleles, expression is not significantly different to that measured in F1 cells (minimum p-values from two-tailed t-tests are given). d) Musculus-specific 4C-seq profiles (mean of two replicates) using the SCR as bait are shown for F1 and Sox2-SCRWT ESCs, before and after transfection with ParB vectors (OR). The two regions consistently called as interactions are denoted in gray, and the minimum p-values for compared interaction scores with F1 (two-tailed t-test) are denoted. e) Violin plot showing the distributions of median inter-probe distances for Sox2-SCRWT and Inter-Down ESCs. Sox2 and SCR are significantly closer on average than control sequences (p=0.036; Wilcoxon rank sum test).
Figure 2.
Figure 2.. Sox2-SCR distance is frequently uncoupled from transcriptional status.
a) Violin plot showing the distributions of median Sox2-SCR distances in Sox2-SCRWT ESCs after 0, 2 and 3 days of differentiation. Comparisons are made by Wilcoxon rank sum tests, with p-values given. Below is shown a representative image of a Sox2-SCRWT nucleus after 3 days of differentiation, with the OR3-IRFP signal shown in red and the OR1-EGFP signal shown in cyan; scale bar 2 μm. Insets show zoomed regions around spots corresponding to bound parS sequences. b) Musculus-specific 4C-seq profile, using the SCR as bait, for Sox2-SCRWT ESCs at 0, 1, 2 and 3 days after differentiation. A dramatic loss of Sox2-SCR interaction (denoted by gray region) is observed on the third day. c) Violin plot showing the distributions of median inter-probe distances for Inter-Down ESCs after 0, 2 and 3 days of differentiation. Comparisons are made by Wilcoxon rank sum tests, with p-values given. d) Violin plot showing the distributions of median inter-probe distances for Sox2-SCRΔSRR107+111 ESCs, and Sox2-SCRWT cells after no treatment (−), or treatment with DMSO or triptolide. Comparisons are made by Wilcoxon rank sum tests, with p-values given. To the right is shown a representative image of a Sox2-SCRΔSRR107+111 nucleus, with the OR3-IRFP signal shown in red and the OR1-EGFP signal shown in cyan; scale bar 2 μm. Insets show zoomed regions around spots corresponding to bound parS sequences.
Figure 3.
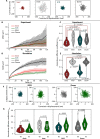
Figure 3.. The Sox2 promoter and SCR are more constrained than control sequences.
a) Sample tracks of the 2D trajectories for labeled Sox2 (red), SCR (green), Inter (light gray) and Down (dark gray) sequences, plotted on the same scale. Displacements have been corrected for substrate displacement, and the plots have been centered on the median positions. b) Uncorrected ensemble MSD curves for the same four regions as in a, with lines showing median values and shading indicating the median absolute deviation. Inter and Down elements clearly move greater distances within the same timeframe as the Sox2 promoter and SCR. c) Violin plot showing the distributions of apparent anomalous exponents measured from the individual movies for each of the four regions as in a. Comparisons are made by Wilcoxon rank sum tests with Benjamini-Hochberg multiple testing correction, with q-values given. Apparent anomalous exponents are significantly lower for Sox2 and SCR than for the control regions, demonstrating their overall greater constraint. d) Ensemble MSD curves for the same four regions in a, derived from molecular dynamics simulations of the Sox2 locus, with lines showing median values and shading indicating the median absolute deviation. Sox2 and SCR show apparent reduced mobility compared to control regions. e) Violin plot showing the distributions of apparent anomalous exponents derived from the same simulated trajectories as d. Comparisons are made by Wilcoxon rank sum tests with Benjamini-Hochberg multiple testing correction, with q-values given. f) Sample tracks of the 2D trajectories for labeled SCR and Down regions, at either 0 or 3 days of differentiation, plotted on the same scale. Displacements have been corrected for substrate displacement, and the plots have been centered on the median positions, showing an apparent increased freedom of movement for both regions on differentiation. g) Violin plots showing the distributions of apparent anomalous exponents measured from the individual movies for each of the four regions as in a, comparing 0 and 3 days of differentiation. Comparisons are made by Wilcoxon rank sum tests, with p-values given; the apparent constraint of Sox2 and Inter is unchanged on differentiation.
Figure 4.
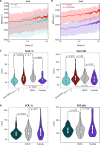
Figure 4.. Severe transcriptional inhibition specifically reduces Sox2 promoter mobility.
a,b) MSD ensemble curves, corrected for substrate movement and plotted on a double-log scale, comparing Sox2 promoter dynamics between a) Sox2-SCRWT and Sox2-SCRΔSRR107+111 ESCs, and b) Sox2-SCRWT cells treated with either DMSO or triptolide. Lines indicate median values and shading the median absolute deviations. MSD reduction as shown by downwards vertical shift of profile on transcriptional inhibition demonstrates a reduced mobility of the labeled promoter. c,d) Violin plots showing distributions of apparent explored radii after 1 s (left) or 60 s (right), computed from individual movies for c) Sox2 and d) SCR, comparing Sox2-SCRΔSRR107+111 ESCs, and Sox2-SCRWT cells after no treatment (−), or treatment with DMSO or triptolide. Comparisons are made by Wilcoxon rank sum tests with Benjamini-Hochberg multiple testing correction, with q-values given. Sox2, but not SCR, explored radii are consistently reduced on transcriptional inhibition.
Figure 5.
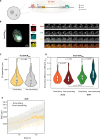
Figure 5.. The SCR specifically becomes more constrained on transcriptional firing in wild-type loci.
a) Schematic of triple-label system of Sox2-SCRMS2 ESCs. The Sox2 promoter DNA is tagged with ANCH3 for visualization with the ParB protein OR3-EGFP, and the SCR is tagged with ANCH1 for visualization with the ParB protein OR1-IRFP. The 3’UTR of Sox2 contains 24 copies of the MS2 repeat for visualization of nascent RNA with MCP-ScarletI. b) Left: representative image of transcriptionally active Sox2-SCRMS2 nucleus, with the OR3-IRFP signal shown in red, the OR1-EGFP signal shown in cyan, and the mScarletI signal shown in yellow; scale bar 2 μm. Insets show zoomed regions around spots corresponding to bound parS sequences and transcription site. Right: Images of the same Sox2-SCRMS2 nucleus at 30 s intervals, showing each of the three channels individually in monochrome, and the overlaid image with the same color scheme as on the left. Arrows show the position of a transcription site (MCP+), which is inactivated by ~ 3 min. Scale bar 2 μm. c) Violin plot showing the distributions of median inter-probe distances for transcriptionally active (MCP+) and inactive (MCP-) Sox2-SCRMS2 ESCs, with no significant difference (p=0.6; Wilcoxon rank sum test). d) Violin plot showing the distributions of apparent anomalous exponents measured from the individual movies for Sox2 and SCR in Sox2-SCRMS2 cells, comparing transcriptionally active and inactive alleles. Comparisons are made by Wilcoxon rank sum tests, with p-values given. e) MSD ensemble curves, corrected for substrate movement and plotted on a double-log scale, comparing SCR dynamics between transcriptionally active and inactive alleles. Lines indicate median values and shading the median absolute deviation. Transcribing alleles show a more distinctive plateau on the MSD curve, suggesting that there is a stricter limit on the area that is explored.
Figure 6.
Figure 6.. Loop extrusion and enhancer activity have opposing effects on chromatin dynamics.
a) Overview of the Sox2 locus, showing positions of the gene and SCR, and showing the regions deleted in the Sox2-SCRΔSRR107+111, Sox2-SCRΔCTCF_Sox2 and Sox2-SCRΔCTCF_SCR (shown in cyan, red and blue, respectively). Below are shown ESC ChIP-seq profiles for H3K27ac (cyan) and CTCF (orange). b) Violin plot showing distributions of apparent anomalous exponents measured from the individual movies for the Sox2 promoter, comparing Sox2-SCRWT, Sox2-SCRΔSRR107+111, Sox2-SCRΔCTCF_Sox2 and Sox2-SCRΔCTCF_SCR ESCs. Comparisons are made by Wilcoxon rank sum tests, with p-values given. c) Sample tracks of the 2D trajectories for Sox2 in Sox2-SCRWT and Sox2-SCRΔCTCF_Sox2 cells, plotted on the same scale. Displacements have been corrected for substrate displacement, and the plots have been centered on the median positions. d) Violin plot showing distributions of apparent anomalous exponents measured from the individual movies for the SCR, comparing Sox2-SCRWT, Sox2-SCRΔSRR107+111, Sox2-SCRΔCTCF_Sox2 and Sox2-SCRΔCTCF_SCR ESCs. Comparisons are made by Wilcoxon rank sum tests, with p-values given. e) Sample tracks of the 2D trajectories for the SCR in Sox2-SCRWT, Sox2-SCRΔSRR107+111 and SCRΔCTCF_SCR cells, plotted on the same scale. Displacements have been corrected for substrate displacement, and the plots have been centered on the median positions.
Figure 7.
Figure 7.. Competition between loop extrusion and transcriptional compartmentation can explain locus dynamics.
a) Ensemble MSD curves for the SCR, derived from molecular dynamics simulations of the Sox2 locus in wild-type or SCR mutant conditions, after factoring in reinforced competition between cohesin-mediated loop extrusion and RNA polymerase II clustering. Lines show median values and shading indicating the median absolute deviation. b) Violin plots showing distributions of apparent explored radii of the SCR after 10 s, derived from the same simulations as a. Reduction in mobility of Sox2-SCRΔSRR107+111 cells, and increased mobility in SCRΔCTCF_SCR cells, compared to wild-type, is assessed by Wilcoxon rank sum tests, with p-values given. c) ChIP-qPCR quantification, expressed as fold enrichment over a negative control region, of amount of Rad21 binding at the musculus/129 (colored) or castaneus (white) alleles of the SCR CTCF site in Sox2-SCRWT and Sox2-SCRΔSRR107+111 cells. Comparisons between allelic binding are made by two-tailed t-tests, with p-values given. More Rad21 is bound to the SCR CTCF site, specifically on the allele where SRR107 and SRR111 are deleted. d) Schematic of competing processes dictating dynamics at the SCR. At the top, extruding cohesin complexes (yellow) place temporary local constraints on mobility of the bound sequences. Such constraints are stabilized when the cohesin encounters bound CTCF (orange) in the appropriate orientation. At the bottom, bound RNA polymerase and transcription factors can also coordinate the Sox2 and SCR position, but are refractory to cohesin recruitment and/or extrusion, hence maintaining a relatively more mobile chromatin locus. The equilibrium of these two processes, shifted by deletion of the flanking transcription factor binding sites in Sox2-SCRΔSRR107+111 cells, results in more constrained chromatin on average. e) Two-step model of Sox2 transcription, and its consequences for locus mobility. In the poised state (left), the Sox2 gene resides within a nuclear hub of concentrated transcription factors, whereas the SCR is outside and exchanging with less concentrated factors within the nucleoplasm. Due to its dense environment, the hub places greater constraints on local chromatin mobility. In the transcribing state (right), the enhancer is more constrained on entering the nuclear hub, and this more efficient exchange with the gene allows transcriptional firing. The gene, while remaining constrained within the hub, has more local kinetic energy as a potential consequence of transcription itself. Note that the physical distance between SCR and Sox2 is less important in this model than whether or not the elements are residing in the nuclear hub.

References

    1. Sexton T and Cavalli G. (2015) The role of chromosome domains in shaping the functional genome. Cell 160, 1049–59. 10.1016/j.cell.2015.02.040. - DOI - PubMed
    1. Schoenfelder S and Fraser P. (2019) Long-range enhancer-promoter contacts in gene expression control. Nat Rev Genet 20, 437–55. 10.1038/s41576-019-0128-0. - DOI - PubMed
    1. Palstra RJ, Tolhuis B, Splinter E, Nijmeijer R, Grosveld F, de Laat W. (2003) The beta-globin nuclear compartment in development and erythroid differentiation. Nat Genet 35, 190–4. 10.1038/ng1244. - DOI - PubMed
    1. Sanyal A, Lajoie BR, Jain G, Dekker J. (2012) The long-range interaction landscape of gene promoters. Nature 489, 109–13. 10.1038/nature11279. - DOI - PMC - PubMed
    1. Javierre BM, Burren OS, Wilder SP, Kreuzhuber R, Hill SM, Sewitz S, Cairns J, Wingett SW, Várnai C, Thiecke MJ, et al. (2016) Lineage-specific genome architecture links enhancers and non-coding disease variants to target gene promoters. Cell 167, 1369–84. 10.1016/j.cell.2016.09.037. - DOI - PMC - PubMed

Publication types