[Preprint]. 2023 Apr 24:2023.04.24.538170.
doi: 10.1101/2023.04.24.538170.

Identification of FacZ as a division site placement factor in Staphylococcus aureus

Affiliations

Identification of FacZ as a division site placement factor in Staphylococcus aureus

Thomas M Bartlett et al. bioRxiv. .

Update in

Abstract

Staphylococcus aureus is a gram-positive pathogen responsible for life-threatening infections that are difficult to treat due to antibiotic resistance. The identification of new vulnerabilities in essential processes like cell envelope biogenesis represents a promising avenue towards the development of anti-staphylococcal therapies that overcome resistance. To this end, we performed cell sorting-based enrichments for S. aureus mutants with defects in envelope integrity and cell division. We identified many known envelope biogenesis factors as well as a large collection of new factors with roles in this process. Mutants inactivated for one of the hits, the uncharacterized SAOUHSC_01855 protein, displayed aberrant membrane invaginations and multiple FtsZ cytokinetic ring structures. This factor is broadly distributed among Firmicutes, and its inactivation in B. subtilis similarly caused division and membrane defects. We therefore renamed the protein FacZ (Firmicute-associated coordinator of Z-rings). In S. aureus, inactivation of the conserved cell division protein GpsB suppressed the division and morphological defects of facZ mutants. Additionally, FacZ and GpsB were found to interact directly in a purified system. Thus, FacZ is a novel antagonist of GpsB function with a conserved role in controlling division site placement in S. aureus and other Firmicutes.


Figures

Figure 1.
Figure 1.. High-throughput FACS-based screens for mutants defective in envelope assembly.
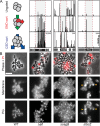
A-B) Schematics showing the logic of the END and CSD enrichments. See text for details. C) FACS profiles monitoring light scattering (SSC Height) and propidium iodide (PI) fluorescence for WT and Δatl strains. Inset micrographs show phase contrast images with overlay of PI staining (bar = 4μm). D) Schematic detailing the END enrichment workflow. An analogous CSD enrichment was performed in parallel (not shown). See text for details. Enrichment for PIHI mutants was examined by FACS profiling at each stage (top). E) Representative images of the final cell populations from the END and CSD sorts, as well as an unsorted control, were imaged on 2% agar pads (bar = 4 μm). PI staining (red) was overlaid on the phase contrast image.
Figure 2.
Figure 2.. Validation and initial characterization of screening hits.
A) Tn-Seq profiles from three genomic loci displaying enrichment of transposon insertions at the completion of the END and CSD sorting protocols relative to the control sort. Each vertical line represents a mapped insertion site, and the height of the line is the number of reads mapping to that site, which reflects the representation of the insertion mutant in the population. Profiles for each locus are scaled separately with the maximum number of reads indicated in the top right corner of the bottom profile. B) Representative images of WT and mutant cells pulse-labeled with sBADA to visualize peptidoglycan (PG) synthesis (bottom row), stained with TMA-DPH to label cell membrane (membrane, middle row), and treated with PI to assess envelope permeability (Phase + PI, top row). Yellow carets highlight membrane and PG synthesis defects. Fluorescence intensity for each channel was scaled identically for all strains to facilitate direct comparison between images (bar = 4 μm).
Figure 3.
Figure 3.. Analysis of morphological defects displayed by ΔfacZ cells
A) Cells from WT and ΔfacZ strains were pulse-labeled with sBADA to visualize peptidoglycan synthesis (green), washed three times with PBS to arrest growth and remove unincorporated sBADA, and then labeled for five minutes with the membrane stain Nile Red (red). Cells were imaged on 2% agar pads containing DAPI to visualize the nucleoid (blue). Insets show cells from the same strains imaged by TEM. Yellow carets highlight cells with aberrant membranes and PG synthesis. B) Violin plots showing the cell area of the indicated strains harboring a cytoplasmic fluorescent protein. The results from four biological replicates were pooled, each shaded differently; small circles are individual measurements, and large circles are medians from each replicate (n > 700 cells; see Fig. S3). C) Quantification of aberrant membrane foci in TMA-DPH-labeled cells (n > 200 cells; see Fig. S3A). D) 3D-SIM microscopy of ΔfacZ cells stained identically to those in panel (A). Carets highlight the position of aberrant cell wall and membrane accumulations that exclude the nucleoid. Bars = 2 μm.
Figure 4.
Figure 4.. Periseptal localization of FacZ in dividing S. aureus.
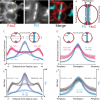
A) Representative fluorescence images of WT cells expressing FacZ-mCherry stained with HADA to label the peptidoglycan (PG). The protein fusion (left) and peptidoglycan (PG) label (center) and a pseudo-colored merged image are shown (FacZ-mCherry in red, HADA in blue). See also Fig. S6D–E. B) Schematic depicting the membrane localization of FacZ in a dividing S. aureus cell. C) Graphs of mean fluorescence intensity of HADA (light and dark blue) or FacZ-mCherry (light and dark red) collected along lines perpendicular to the septum of cells labeled as in panel (A). Central peaks show intensity at the septum, and peripheral peaks show intensity at the cell periphery. Cells were grouped into early-division (cells with two HADA foci representing an unresolved septum) or late-stage division (cells with a single central HADA focus representing a resolved septum). HADA-labeling is increased in the center of late-stage dividing cells (Welch’s t-test, p < 0.05). Localization of FacZ-mCherry does not change significantly as the septum resolves (Kolmogorov-Smirnov test, p > 0.05). D) Graphs of intensity profile scans measuring fluorescence intensity along peripheral arcs centered on the periseptum for early- and late-stage dividing cells. E-F) Graphs of intensity profile scans of WT cells stained with HADA (light and dark blue) and Nile Red (light and dark grey) imaged and analyzed as in (D) and (E), respectively. Perpendicular intensity profiles (C and E) were normalized from 0–1 for each cell. Peripheral intensity profiles (D and F) were interpolated using MATLAB, and intensity profiles were normalized from 0–1 for each fluorescence channel within each experiment, to facilitate comparison of cells of different size; n ≥ 50 cell segments measured for each condition in each graph.
Figure 5.
Figure 5.. Inactivation of facZ impairs cell division and is rescued by deletion of ΔgpsB
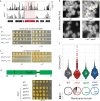
A) Transposon insertion profiles of the ΔfacZ locus in strains aTB015 [WT] and aTB259 [ΔfacZ]. B) Spot titers of cultures of aTB003 [WT], aTB372 [ΔfacZ Ptet-facZ], aTP481 [ΔezrA Ptet-ezrA], and aTB378 [ΔfacZ ΔezrA Ptet-facZ]. Cells were normalized to OD600 = 1.0, serially diluted, and spotted on TSA agar with or without aTC inducer (50 ng/mL). C) Spot titers of aTB003 [WT], aTB372 [ΔΔfacZ Ptet-facZ] and aTP481 [ΔezrA Ptet-ezrA] as in panel (B) except that the plates contained PC190723 (100 ng/mL). D) Top: Diagram showing the location of mutations in gpsB that suppress the PC190723 sensitivity of a ΔfacZ mutant. Suppressor mutations are mapped onto a diagram of the two folded domains of GpsB (lines indicate position of mutations, with red lines indicating mutations generating premature stop codons). Bottom: Cultures of strains aTB003 [WT], aTB251 [ΔfacZ], aTB453 [ΔfacZ gpsB-s1], aTB476 [ΔfacZ gpsB-s2], aTB478 [ΔfacZ gpsB-s3], and aTB497 [ΔfacZ gpsB::Tn] were OD-normalized and spotted on TSA supplemented with PC190723 (100 ng/ml) as in panel (B). E) Representative fluorescence images of aTB003 [WT], aTB372 [ΔfacZ Ptet-facZ], aTB525 [ΔgpsB], and aTB540 [ΔgpsB ΔfacZ Ptet-facZ]. Strains were grown to mid-log phase without induction of facZ, and membranes were stained with Nile Red (see also Fig. S7). Yellow carets highlight membrane defects. E-F) Cultures of aTB521 [WT], aTB527 [ΔfacZ], aTB529 [ΔgpsB], and aTB542 [ΔfacZ ΔgpsB] constitutively expressing cytoplasmic RFP from pKK30 were labeled with TMA-DPH in mid-log phase and imaged on 2% agarose pads. (F) Violin plots showing cell area of indicated strains based on cytoplasmic fluorescence (n > 700 cells). (G) Aberrant membrane foci were quantified (n > 200 cells).
Figure 6.
Figure 6.. FacZ interacts with GpsB and influences its localization.
A) Representative images of aTB517 [ΔfacZ ΔgpsB Ptet-gpsB-mNeon Pspac-facZ-mCherry] grown in the presence of aTC (50 ng/mL) and IPTG (25 ng/mL) and imaged by fluorescence microscopy. B) Graphs showing the fluorescence intensity of FacZ-mCherry (light and dark red) and GpsB-mNeon (light and dark green) along lines perpendicular to the septum. Cells were separated into two groups based on the GpsB-mNeon signal: cells with discontinuous GpsB foci were considered early-division cells (top left) whereas cells with a continuous GpsB-mNeon band at the septum were considered late-division cells (top right). (n ≥ 50 cells for each group). C) Representative deconvolved fluorescence images of GpsB-mNeon localization in ΔfacZ cells (aTB519) labeled with Nile Red. D) Gel filtration profiles of GpsB (1–75) alone (green), SUMO-3x-FacZ (127–146) alone (red), or a mixture of the two proteins (binding, blue). Elution profiles represent the average and standard deviation of 6 runs. E) Schematic model of FacZ function within the divisome. Cell division is properly localized when FacZ is functional (left). In the absence of FacZ, GpsB is unregulated such that cell constriction is initiated at many sites (right). See text for details.

References

    1. Silhavy T. J., Kahne D. & Walker S. The bacterial cell envelope. Cold Spring Harb Perspect Biol 2, a000414, doi: 10.1101/cshperspect.a000414 (2010). - DOI - PMC - PubMed
    1. Koch A. L. Growth and Form of the Bacterial Cell Wall. American Scientist 78, 327–341 (1990).
    1. Loomba P. S., Taneja J. & Mishra B. Methicillin and Vancomycin Resistant S. aureus in Hospitalized Patients. J Glob Infect Dis 2, 275–283, doi: 10.4103/0974-777x.68535 (2010). - DOI - PMC - PubMed
    1. Rohs P. D. A. & Bernhardt T. G. Growth and Division of the Peptidoglycan Matrix. Annual Review of Microbiology 75, 315–336, doi: 10.1146/annurev-micro-020518-120056 (2021). - DOI - PubMed
    1. Oshida T. et al. A Staphylococcus aureus autolysin that has an N-acetylmuramoyl-L-alanine amidase domain and an endo-B-N-acetylglucosaminidase domain: Cloning, sequence analysis, and characterization. Proceedings of the National Academy of Sciences 92, 285–289 (1994). - PMC - PubMed

Publication types