[Preprint]. 2023 Oct 3:2023.04.25.538330.
doi: 10.1101/2023.04.25.538330.

Assessment of three-dimensional RNA structure prediction in CASP15

Affiliations

Assessment of three-dimensional RNA structure prediction in CASP15

Rhiju Das et al. bioRxiv. .

Update in

Abstract

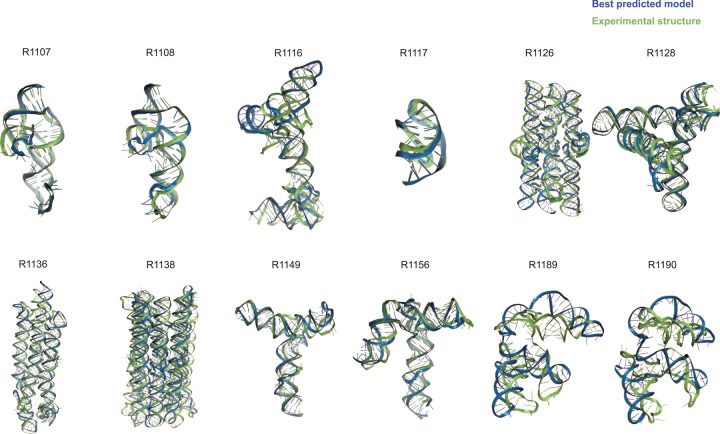
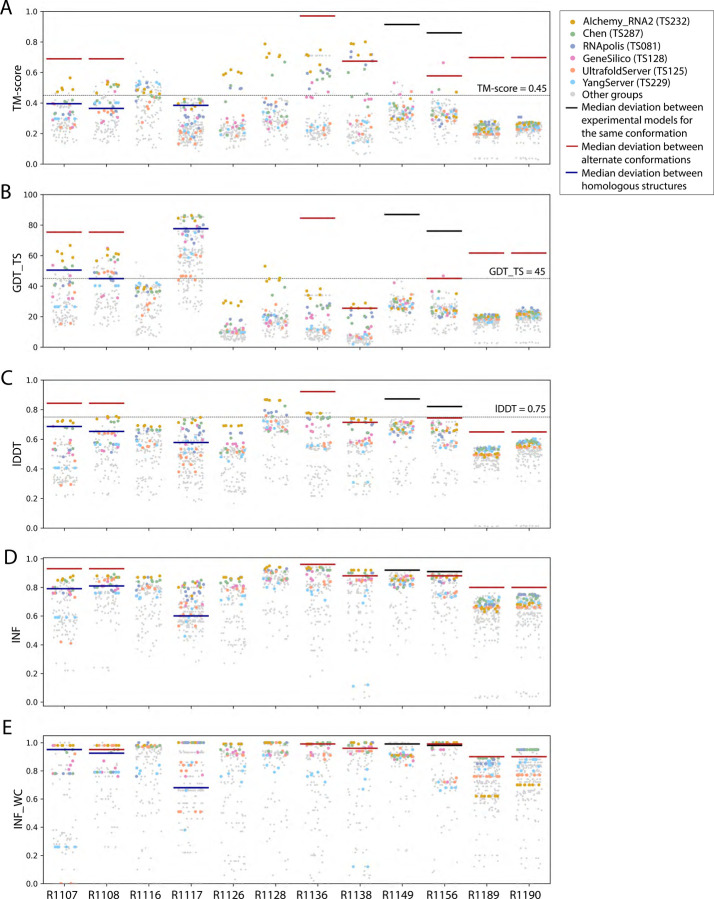
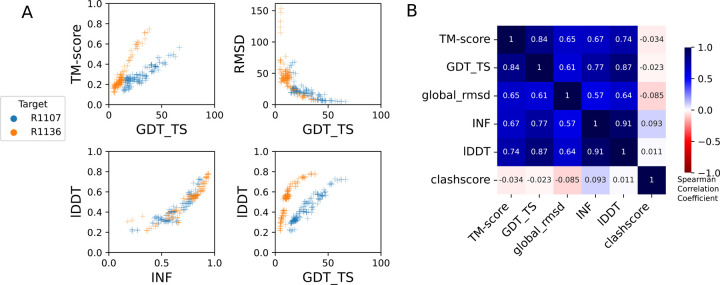
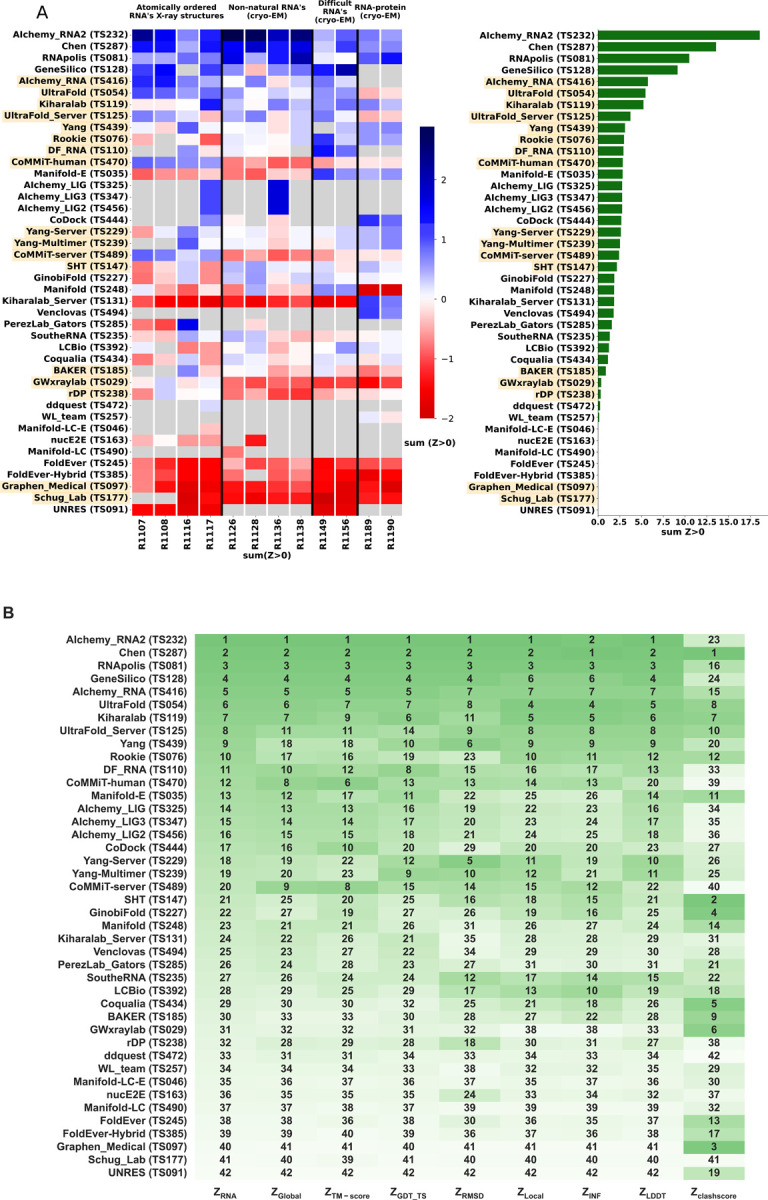
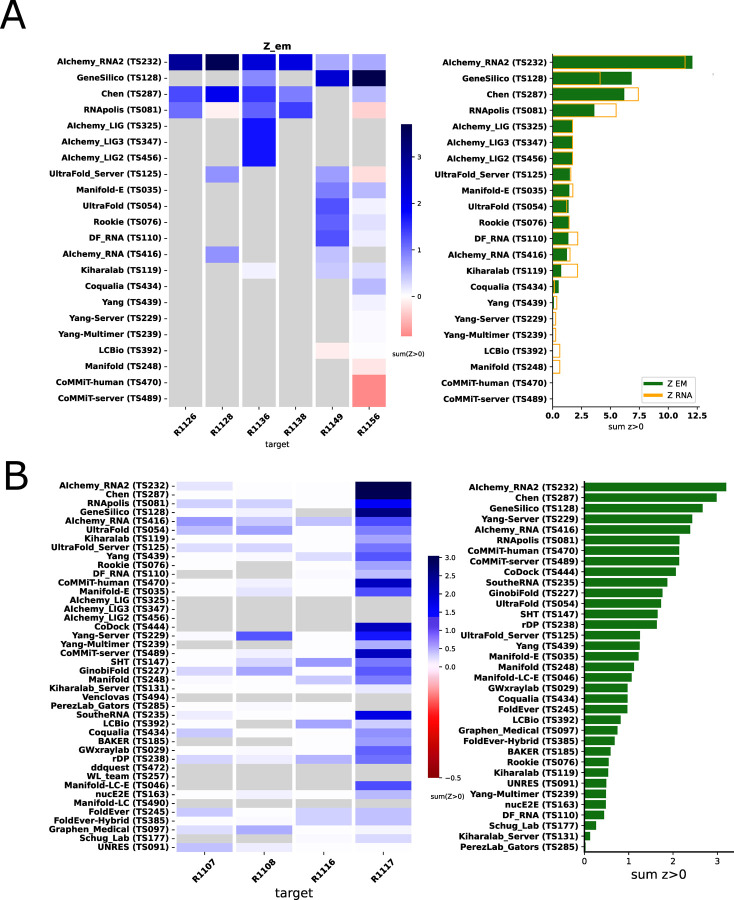
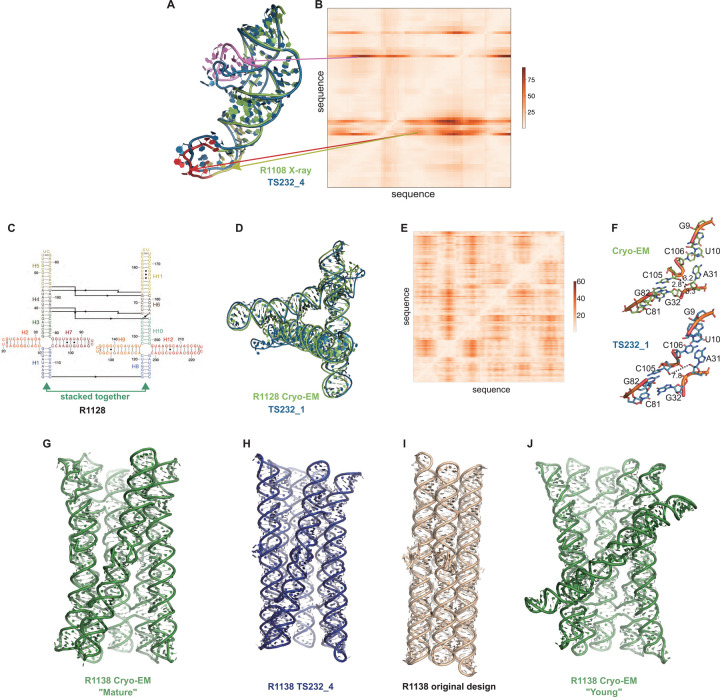
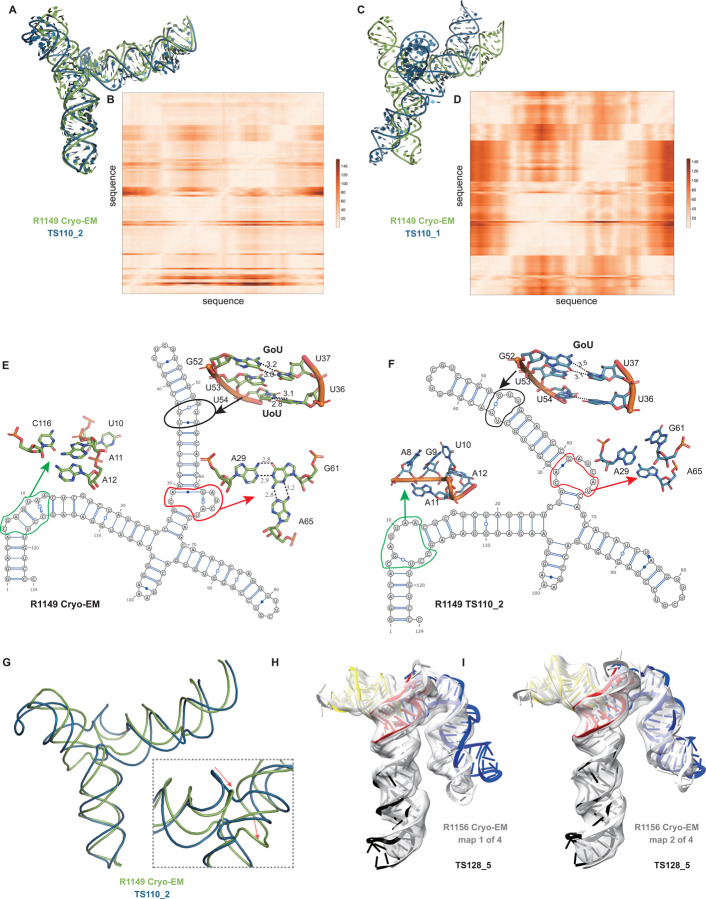
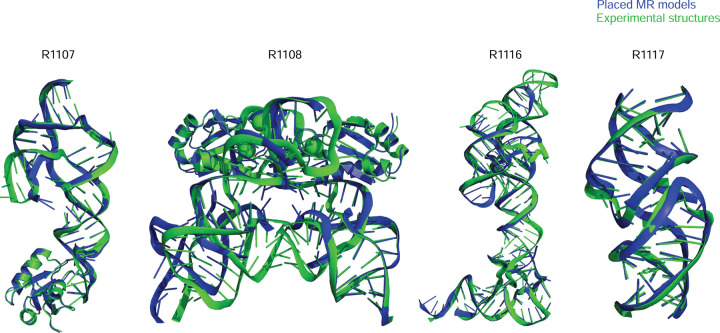
The prediction of RNA three-dimensional structures remains an unsolved problem. Here, we report assessments of RNA structure predictions in CASP15, the first CASP exercise that involved RNA structure modeling. Forty two predictor groups submitted models for at least one of twelve RNA-containing targets. These models were evaluated by the RNA-Puzzles organizers and, separately, by a CASP-recruited team using metrics (GDT, lDDT) and approaches (Z-score rankings) initially developed for assessment of proteins and generalized here for RNA assessment. The two assessments independently ranked the same predictor groups as first (AIchemy_RNA2), second (Chen), and third (RNAPolis and GeneSilico, tied); predictions from deep learning approaches were significantly worse than these top ranked groups, which did not use deep learning. Further analyses based on direct comparison of predicted models to cryogenic electron microscopy (cryo-EM) maps and X-ray diffraction data support these rankings. With the exception of two RNA-protein complexes, models submitted by CASP15 groups correctly predicted the global fold of the RNA targets. Comparisons of CASP15 submissions to designed RNA nanostructures as well as molecular replacement trials highlight the potential utility of current RNA modeling approaches for RNA nanotechnology and structural biology, respectively. Nevertheless, challenges remain in modeling fine details such as non-canonical pairs, in ranking among submitted models, and in prediction of multiple structures resolved by cryo-EM or crystallography.


Conflict of interest statement

Conflict of Interest All authors declare that they have no competing interests.

Figures

FIGURE 1.
FIGURE 1.. Overview of CASP15 RNA targets.
Display of all CASP15 RNA targets (green) with the best-ranked model (blue) superimposed for each, chosen based on RMSD comparison of all five predicted models from all predictor groups compared to all available experimental structures. For ease of visualization of RNA global folds, protein binding and small molecule ligands (see Table 1) are not shown.
FIGURE 2.
FIGURE 2.. TM-score, GDT_TS, lDDT, INF, and INF_WC values for all targets.
Scores for all models submitted for all targets are depicted (points are randomly jittered horizontally to aid visualization). Models from the four top performing groups and top two server groups are highlighted as colored points, and all other groups’ models are shown as gray points. Red lines indicate the median deviation between experimentally determined models for alternate conformations, black lines indicate the deviation between alternate models derived from experimental data for the same conformation, and blue lines indicate the deviation between homologous structures (see main text).
FIGURE 3:
FIGURE 3:. Comparison of assessment metrics for RNA targets.
(A) Scores for all models for representative short target R1107 (blue) and long target R1136 (orange): top-left TM-score vs. GDT_TS, top-right RMSD vs. GDT_TS, to compare across global fold metrics; bottom-left lDDT vs. INF compares the two local metrics; and bottom-right lDDT vs. GDT_TS compares global fold to local metrics. (B) Average Spearman rank correlation coefficient (calculated separately per target, then averaged over all targets) between each pair of scores labeled on each row and column, colored by high correlation (dark blue), no correlation (white). RMSD and clashscore were multiplied by −1 before calculating the correlation so that higher scores correspond to better accuracy for all metrics.
FIGURE 4.
FIGURE 4.. CASP-style Z-score based rankings.
(A) Heatmap of groups ranked by ZRNA. Groups that used deep learning, as reported in the participant’s abstract to CASP15, are indicated in orange. The summation of positive two-pass Z-scores for each of the 12 targets is summarized in the barplot (right). Groups are ordered by their ZRNA rankings. (B) Robustness of ranking to different choices in assessment. Columns show group rankings based on subsets of the ZRNA score or individual metrics; coloring reflects rankings under each metric.
FIGURE 5.
FIGURE 5.. Folding pattern analysis of RNA-protein complexes.
(A) Histograms of Matthews Correlation Coefficients (MCC) for RNA-protein contact accuracy in the two RNA-protein targets RT1189 and RT1190 (RsmZ-RsmA RNA-protein complexes). (B) Scheme for classifying the folding pattern of RNA based on order of protein contacts to RNA. Each dimer is assigned a color based on the order it was visited in. Experimental cryo-EM structures are shown at top with positions of binding on RNA diagrammed below.
FIGURE 6.
FIGURE 6.. Ranking of CASP RNA predictions based on direct comparison to experimental data.
(A) Ranking of six RNA-only cryo-EM targets based on Z-scores for map-to-model metrics (ZEM). Only a subset of models with clear alignments to maps were included in the comparison; see Supplemental Figure 5 for analysis over all models. (B) Group ranking for X-ray crystal structure targets based on Z-scores for metrics that directly compare the models to the crystallographic data (ZMX).
FIGURE 7.
FIGURE 7.. Detailed inspection of “medium” and “non-natural” targets.
(A) For R1108 (chimpanzee CPEB3 ribozyme), superimposition of the experimental structure (green) with the best model (TS232_4 from AIChemy_RNA2, as blue, RMSD 4.5 Å) is shown. Notice the large deviations at the apical loops (as red, yellow and pink) and their positions on (B), the Deformation Profile. (C) Diagram of the secondary structure (2D) of target R1128, a designed paranemic crossover triangle. The helices are numbered from H1 to H11. The secondary structure contains four 4-way junctions. In the two 4-way junctions drawn as “open”, helix H1 stacks with H2 and H3 with H7 for one 4-way junction and, for the second one, helix H8 stacks with H9 and H10 with H12. Helices H1 and H8 are stacked together. The pairs between G and U are marked by a dark dot (G•U pair). The Leontis-Westhof symbols are used to annotate the Watson-Crick/Sugar edge pair between G and U in the capping apical 5’UUCG3’ tetraloops. (D) Experimental structure (green) superimposed on the model TS232_1 (blue) with the lowest RMSD (4.3 Å). (E) The deformation profile (see Methods) between the same set of structures (at the right, the color scale where white represents excellent superimposition). The reddish regions indicate where the discrepancies are largest; they concentrate at the 4-way junctions where the experimental structure is more compact and with H-bonding contacts between the strands than the model structure as shown in (F). (G-J) Models for R1128 (Paranemic Crossover Triangle, PXT). Cryo-EM of mature conformation (G) agrees better with blind CASP model TS232_4 (H) than with original models prepared by this nanostructure’s designers (I). Cryo-EM also captured an early folding intermediate (J) that was not predicted well by any CASP15 groups.
FIGURE 8.
FIGURE 8.. Detailed inspection of “difficult” targets, two coronavirus SL5 domains solved by cryo-EM.
(A) Superposition between R1149 cryo-EM structure (first of 10 models representing experimental uncertainty) and the closest CASP15 prediction according to RMSD (TS110_2 with 6.9 Å). (B) Deformation profile between the same two structures. (C) Superposition between the experimental (R1149) and the model ranked #1 by the modeling group (TS110_1 with 21.7 Å). (D) Deformation profile between the same two structures. (E) Diagram of the secondary structure (2D) of target R1149 (first of 10 models representing experimental uncertainty). (F) Diagram of the secondary structure (2D) of the closest model TS110_2. The outlines indicate regions with large discrepancies due to wrong 2D pairs and absence of 3D pairs. For example, in the model structure, the U54/U36 pair is not present, and the region circled in green shows a region with high clashscore. (G) Backbone traces of the experimental (green) and model (blue) structures showing the overall fit of the helices; however, as shown in inset, the wrong choices in internal loops lead to large deviations in the path of the backbone at the central 4-way junction. (H-I) Experimental maps and models (gray) for R1156, whose cryo-EM data were subclassified into four separate conformations; conformation 1 (H) and 2 (I) compared to top scoring CASP prediction TS128_5 (color).
FIGURE 9.
FIGURE 9.
Molecular replacement (MR) of X-ray crystallographic data using CASP15 models (and AlphaFold 2 models of U1ABD in the cases of R1107 and R1108). Group TS232 models formed the basis of all successful search models shown except R1117 (group TS287).

Similar articles

References

    1. Holley R. W., Apgar J., Everett G. A., Madison J. T., Marquisee M., Merrill S. H., Penswick J. R. & Zamir A. STRUCTURE OF A RIBONUCLEIC ACID. Science 147, 1462–1465 (1965). - PubMed
    1. Madison J. T., Everett G. A. & Kung H. Nucleotide sequence of a yeast tyrosine transfer RNA. Science 153, 531–534 (1966). - PubMed
    1. Fuller W. & Hodgson A. Conformation of the anticodon loop intRNA. Nature 215, 817–821 (1967). - PubMed
    1. Levitt M. Detailed molecular model for transfer ribonucleic acid. Nature 224, 759–763 (1969). - PubMed
    1. Hingerty B., Brown R. S. & Jack A. Further refinement of the structure of yeast tRNAPhe. J. Mol. Biol. 124, 523–534 (1978). - PubMed

Publication types