[Preprint]. 2023 Sep 6:2023.04.29.538828.
doi: 10.1101/2023.04.29.538828.

A single-cell atlas of the aging murine ovary

Affiliations

A single-cell atlas of the aging murine ovary

José V V Isola et al. bioRxiv. .

Update in

  • A single-cell atlas of the aging mouse ovary.
    Isola JVV, Ocañas SR, Hubbart CR, Ko S, Mondal SA, Hense JD, Carter HNC, Schneider A, Kovats S, Alberola-Ila J, Freeman WM, Stout MB. Isola JVV, et al. Nat Aging. 2024 Jan;4(1):145-162. doi: 10.1038/s43587-023-00552-5. Epub 2024 Jan 10. Nat Aging. 2024. PMID: 38200272 Free PMC article.

Abstract

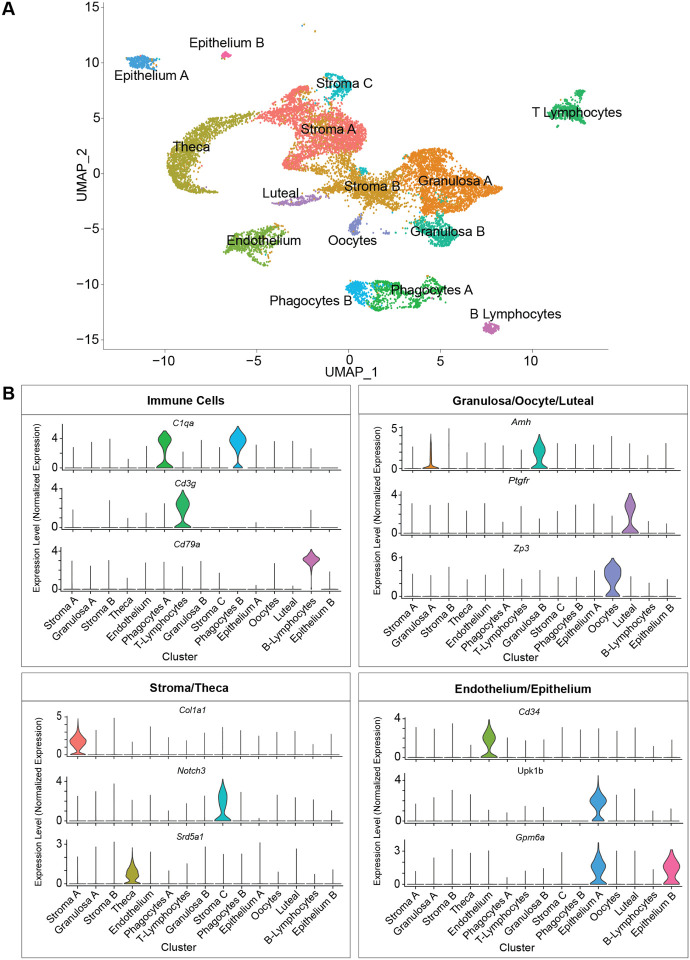
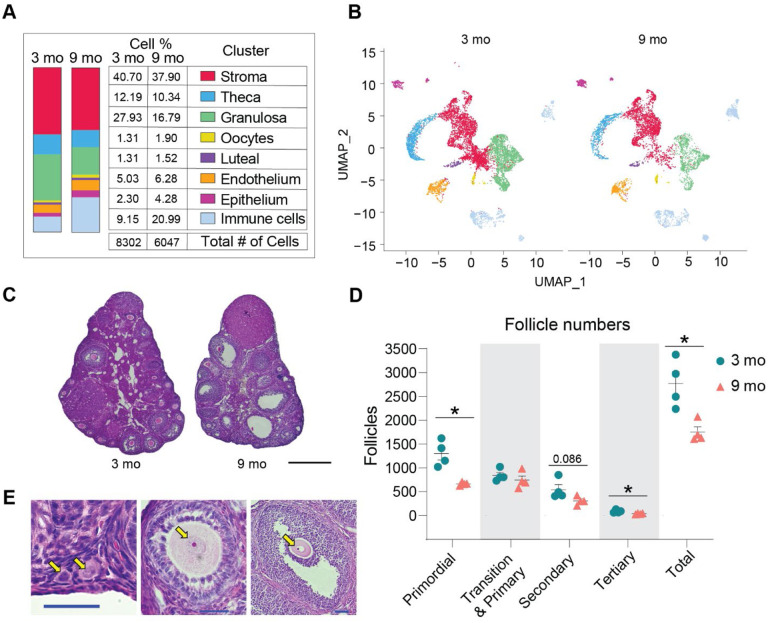
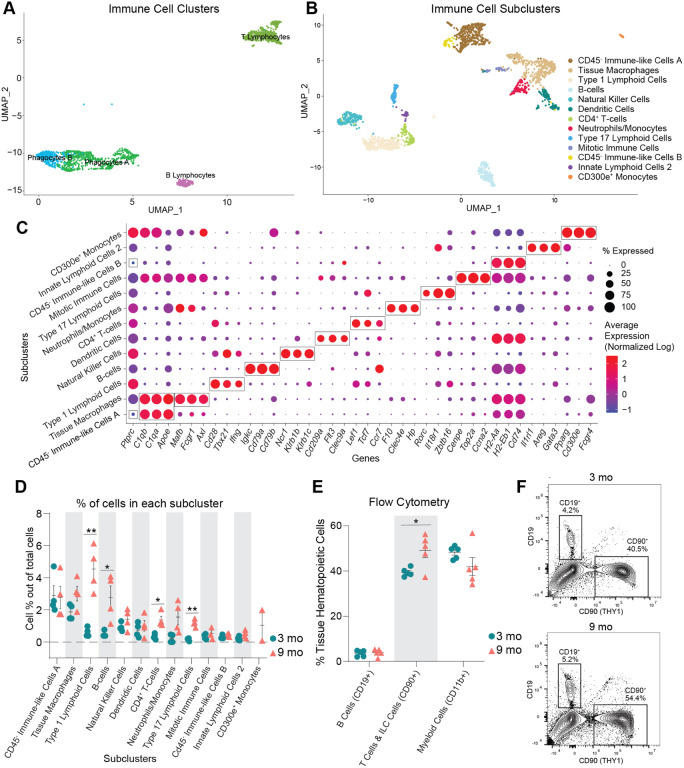
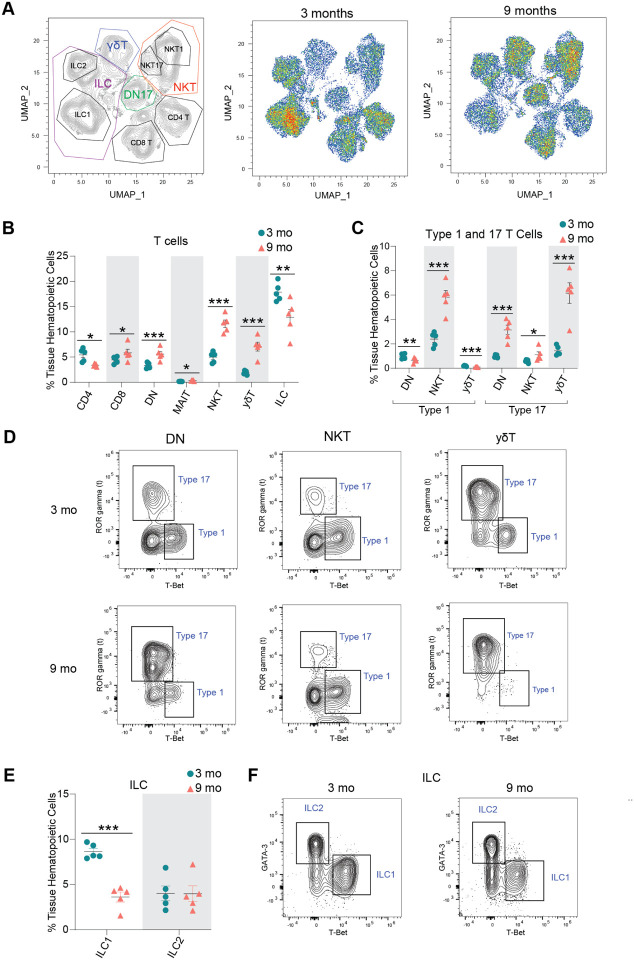
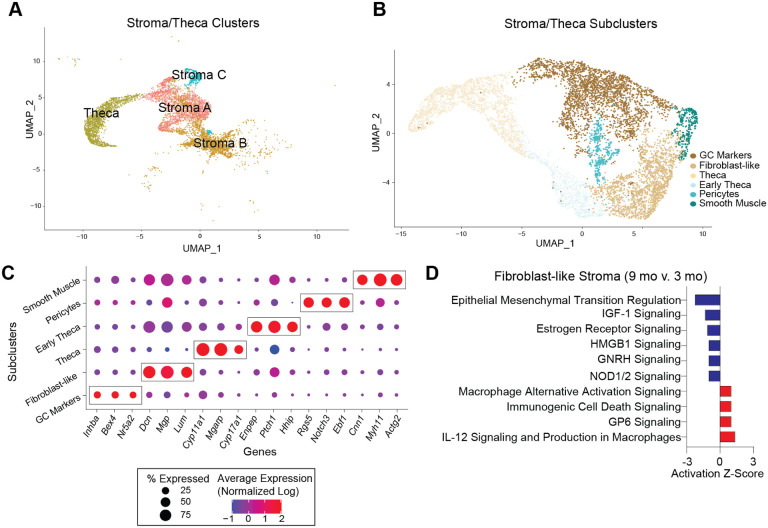
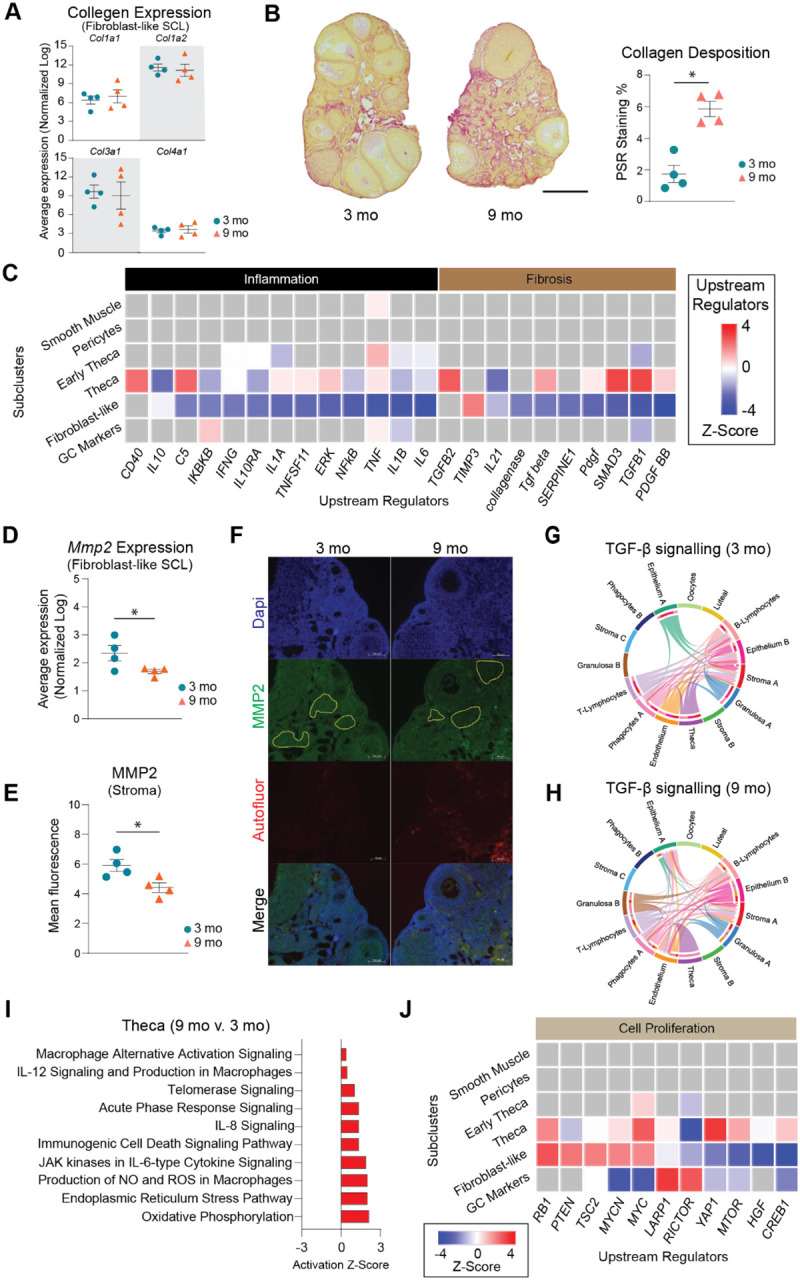
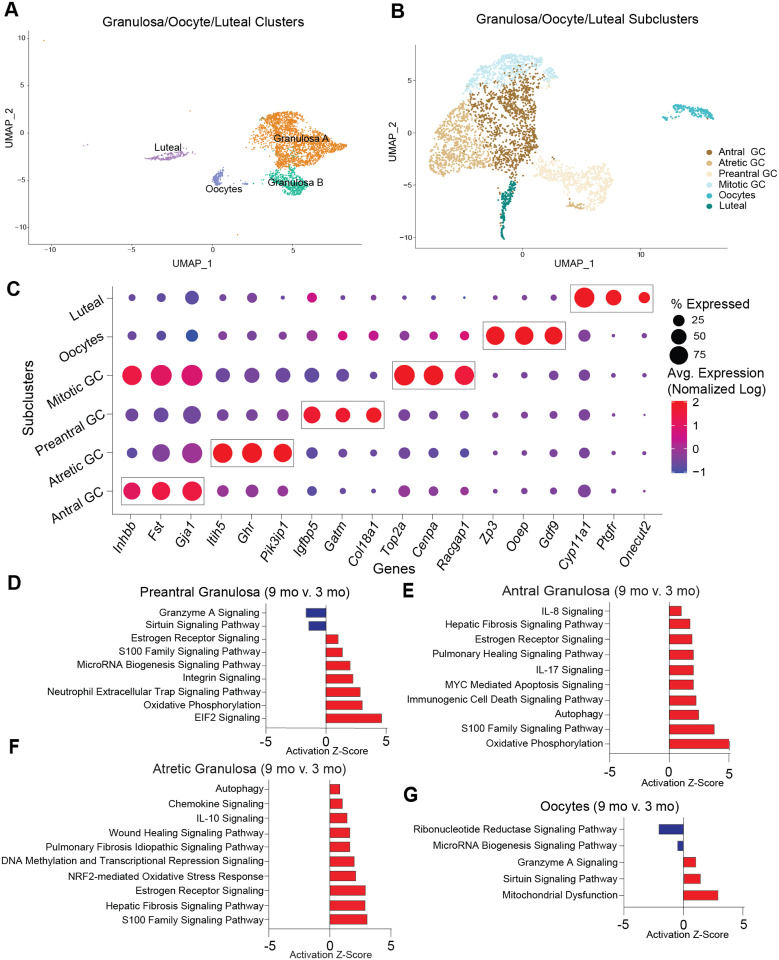
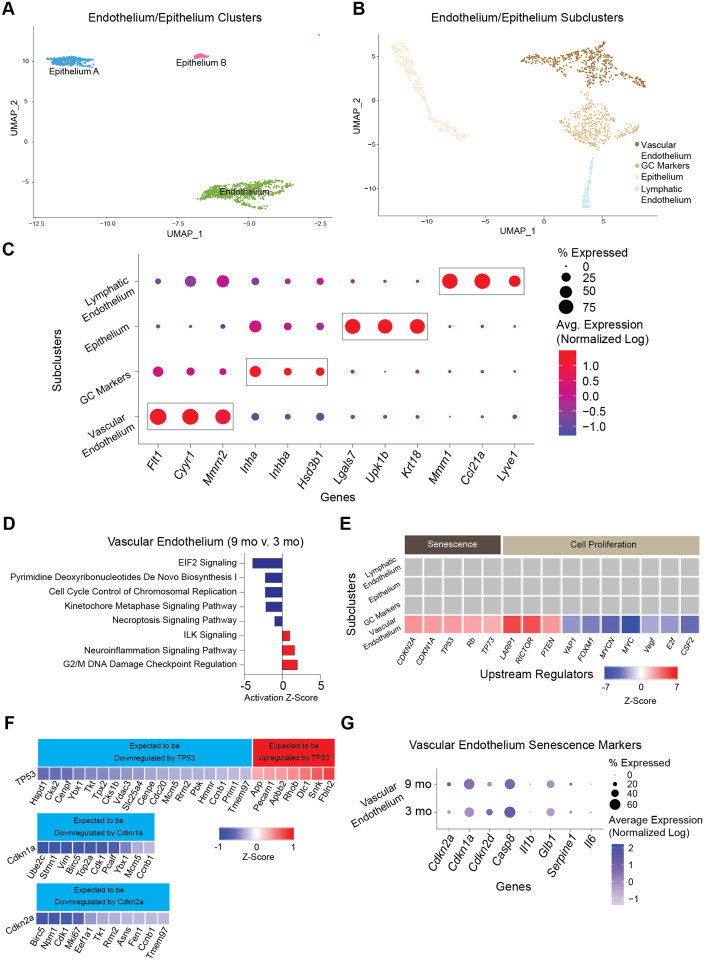
Ovarian aging leads to diminished fertility, dysregulated endocrine signaling, and increased chronic disease burden. These effects begin to emerge long before follicular exhaustion. Around 35 years old, women experience a sharp decline in fertility, corresponding to declines in oocyte quality. Despite a growing body of work, the field lacks a comprehensive cellular map of the transcriptomic changes in the aging ovary to identify early drivers of ovarian decline. To fill this gap, we performed single-cell RNA sequencing on ovarian tissue from young (3-month-old) and reproductively aged (9-month-old) mice. Our analysis revealed a doubling of immune cells in the aged ovary, with lymphocyte proportions increasing the most, which was confirmed by flow cytometry. We also found an age-related downregulation of collagenase pathways in stromal fibroblasts, which corresponds to rises in ovarian fibrosis. Follicular cells displayed stress response, immunogenic, and fibrotic signaling pathway inductions with aging. This report raises provides critical insights into mechanisms responsible for ovarian aging phenotypes.

Keywords: collagen; fibrosis; menopause; mouse; multinucleated giant cells; reproduction.


Conflict of interest statement

COMPLETING INTERESTS The authors declare no conflicts or competing interests.

Figures

Fig. 1.
Fig. 1.. scRNA-seq of the murine ovary.
Whole ovarian tissue was collected from 3- and 9-month-old C57BL/6J mice and processed for 10X Genomics 3’ scRNA-Seq. (A) UMAP plot of age-combined ovarian cells. Clustering analysis revealed 15 distinct ovarian cell populations. (B) Violin plots of specific marker genes for each ovarian cell type. scRNA-seq was performed in n=4 ovaries/age.
Fig. 2.
Fig. 2.. Age-related changes in ovarian cell populations.
(A) The number and percentage of cells in broad categories of cell type identity by age. (B) UMAP plot of ovarian cells split by age. (C) Representative images of H&E stained ovaries. (D) Estimated number of ovarian follicles in 3- and 9-month-old ovaries. (E) Representative images of follicles stained by H&E. Arrows are pointing to a primordial, primary, secondary and tertiary follicles (from left to right). Data are presented as mean ± SEM. *, **, *** represent statistical difference (FDR<0.05, 0.01 and 0.005, respectively) by multiple two-tailed t-test with Benjamini, Krieger, and Yekutieli correction for multiple comparisons. Black scale bars represent 500μm and blue scale bars represent 50μm. scRNA-seq was performed in n=4 ovaries/age.
Fig. 3.
Fig. 3.. Immune cells accumulate in the ovaries with age.
(A) UMAP of immune CLUs selected for sub-clustering analyses. (B) UMAP of immune SCL. (C) Dot plot of markers used for SCL cell-type identification. (D) Percentage of cells in each immune SCL out of total cells. (E) Percentages of immune cells out of tissue hematopoietic cells (after gating out intravascular hematopoietic cells) by flow cytometry. (F) Representative images of flow cytometry gating for CD19+ and CD90+ cells out of tissue hematopoietic cells (i.v. CD45; CD45+) in young and aged ovaries (see Suppl. Fig 4A for the complete gating strategy). For flow cytometry, 6 ovaries from mice in the same phase of estrous cycle were pooled together to comprise each sample (n=5/age). scRNA-seq was performed in n=4 ovaries/age. Data are presented as mean ± SEM. *, **, *** represent statistical difference (FDR<0.05, 0.01 and 0.005, respectively) by multiple two-tailed t-test with Benjamini, Krieger, and Yekutieli correction for multiple comparisons.
Fig. 4.
Fig. 4.. Lymphocyte populations are altered in the aged ovary.
(A) UMAP of flow cytometry panel of lymphoid cells, annotated using conventional gating strategies. The number of cells plotted was normalized to better observe differences in distribution of the populations. (B) Percentage of T cell subpopulations out of tissue hematopoietic cells. (C) Percentage of Type 1 and Type 17 T cells out of tissue hematopoietic cells. (D) Representative gating of Type 1 and Type 17 lymphoid cells in young and aged ovaries. (E) Percentage of ICL1 and ILC2 out of tissue hematopoietic cells. (F) Representative gating of ILCs in young and aged ovaries. For flow cytometry, 6 ovaries from mice in the same phase of estrous cycle were pooled together to comprise each sample (n=5/age). scRNA-seq was performed in n=4 ovaries/age. Data are presented as mean ± SEM. *, **, *** represent statistical difference (FDR<0.05, 0.01 and 0.005, respectively) by multiple two-tailed t-test with Benjamini, Krieger, and Yekutieli correction for multiple comparisons.
Fig. 5.
Fig. 5.. Sub-clustering of stroma and theca cells.
(A) UMAP of stroma and TC CLUs used for sub-clustering (B) UMAP of stroma and TC SCLs. (C) Dot plot of markers used for SCL cell-type identification. (D) IPA canonical pathways indicating activation or inhibition of specific pathways by aging in stromal fibroblast-like cells. scRNAseq was performed in n=4 ovaries/age.
Fig 6:
Fig 6:. Biological significance of altered pathways in ovarian stroma and theca SCLs.
(A) Expression of collagen genes in the fibroblast-like stroma SCL does not change with age. (B) PSR staining of collagen deposition in 3- and 9-month-old ovaries. (C) IPA upstream regulator analyses of age-related changes in stroma and TC SCLs (9 months-old vs. 3 months-old, z-score) related to inflammation and fibrosis. (D) Expression of Mmp2 gene in the fibroblast-like stroma decreases with age. (E) MMP2 protein is decreased in aged ovarian stroma by immunofluorescence. (F) Representative images of immunofluorescence of MMP2 (green), DAPI (blue) and autofluorescence (red). Yellow lines show representation of stromal regions analyzed, avoiding follicles and auto-fluorescent regions. (G-H) CellChat chord diagrams of the TGF-β signaling pathway interactions in the (G) 3-mo and (H) 9-mo ovarian CLUs. (I) IPA canonical pathways indicating activation of specific pathways by aging in TCs. (J) IPA upstream regulator analyses of age-related changes in stroma and TC SCLs (9 months-old vs. 3 months-old, z-score) related to cell proliferation. (n=5/age). scRNA-seq was performed in n=4 ovaries/age. Data are presented as mean ± SEM. *, **, *** represent statistical difference (p<0.05, 0.01 and 0.005, respectively) by one-tailed t-test (A-B) or two-tailed t test (D-E). Black scale bars represent 500μm and white scale bars represent 100μm.
Fig. 7:
Fig. 7:. Sub-clustering of granulosa cells, oocytes and luteal cells.
(A) UMAP of granulosa, oocytes and luteal cells CLUs used for sub-clustering (B) UMAP of granulosa/oocytes/luteal SCLs. (C) Dot plot of markers used for SCL cell-type identification. (D-G) Z-scores indicating activation or inhibition of pathways during aging by IPA analysis in (D) preantral GC, (E) antral GC, (F) atretic GC, and (G) oocytes. scRNA-seq was performed in n=4 ovaries/age.
Fig. 8:
Fig. 8:. Sub-clustering of endothelial and epithelial cells.
(A) UMAP of endothelium and epithelium CLUs used for sub-clustering. (B) UMAP of endothelium/epithelium SCLs. (C) Dot plot of markers used for SCL celltype identification. (D) Z-scores indicating activation or inhibition of pathways altered with aging by IPA analysis in vascular endothelial cells. (E) Z-scores indicating activation or inhibition of upstream regulators during aging by IPA analysis in endothelium/epithelium SCLs. (F) Z-scores indicating up or downregulation of genes by TP35, Cdkn1a and Cdkn2a genes. (G) Dot plot of expression of cell senescence markers in vascular endothelial cells in 3- and 9-month-old ovaries. scRNA-seq was performed in n=4 ovaries/age.

References

    1. Johnson J. A. & Tough S. No-271-Delayed Child-Bearing. J Obstet Gynaecol Can 39, e500–e515, doi: 10.1016/j.jogc.2017.09.007 (2017). - DOI - PubMed
    1. Broekmans F. J., Soules M. R. & Fauser B. C. Ovarian aging: mechanisms and clinical consequences. Endocr Rev 30, 465–493, doi: 10.1210/er.2009-0006 (2009). - DOI - PubMed
    1. Levine M. E. et al. Menopause accelerates biological aging. Proc Natl Acad Sci U S A 113, 9327–9332, doi: 10.1073/pnas.1604558113 (2016). - DOI - PMC - PubMed
    1. Wellons M., Ouyang P., Schreiner P. J., Herrington D. M. & Vaidya D. Early menopause predicts future coronary heart disease and stroke: the Multi-Ethnic Study of Atherosclerosis. Menopause 19, 1081–1087, doi: 10.1097/gme.0b013e3182517bd0 (2012). - DOI - PMC - PubMed
    1. Tchernof A., Calles-Escandon J., Sites C. K. & Poehlman E. T. Menopause, central body fatness, and insulin resistance: effects of hormone-replacement therapy. Coron Artery Dis 9, 503–511, doi: 10.1097/00019501-199809080-00006 (1998). - DOI - PubMed

Publication types