[Preprint]. 2024 Jun 20:2023.04.24.538020.
doi: 10.1101/2023.04.24.538020.

CD3+ T-cell: CD14+monocyte complexes are dynamic and increased with HIV and glucose intolerance

Affiliations

CD3+ T-cell: CD14+monocyte complexes are dynamic and increased with HIV and glucose intolerance

Laventa M Obare et al. bioRxiv. .

Update in

  • CD3+ T-cell: CD14+ monocyte complexes are dynamic and increased with HIV and glucose intolerance.
    Obare LM, Simmons J, Oakes J, Zhang X, Nochowicz C, Priest S, Bailin SS, Warren CM, Mashayekhi M, Beasley HK, Shao J, Meenderink LM, Sheng Q, Stolze J, Gangula R, Absi T, Ru Su Y, Neikirk K, Chopra A, Gabriel CL, Temu T, Pakala S, Wilfong EM, Gianella S, Phillips EJ, Harrison DG, Hinton A, Kalams SA, Kirabo A, Mallal SA, Koethe JR, Wanjalla CN. Obare LM, et al. J Immunol. 2025 Mar 1;214(3):516-531. doi: 10.1093/jimmun/vkae054. J Immunol. 2025. PMID: 40073149 Free PMC article.

Abstract

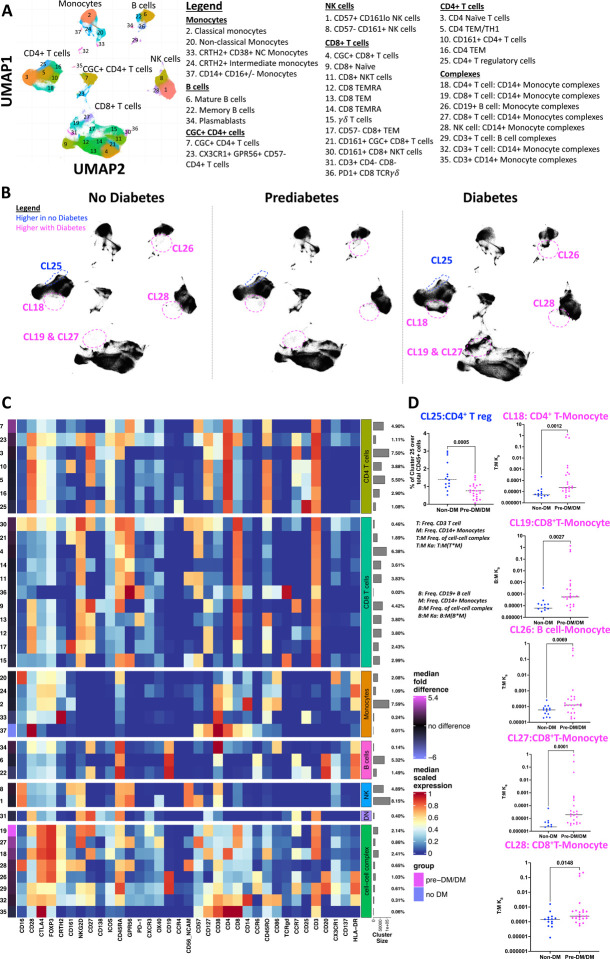
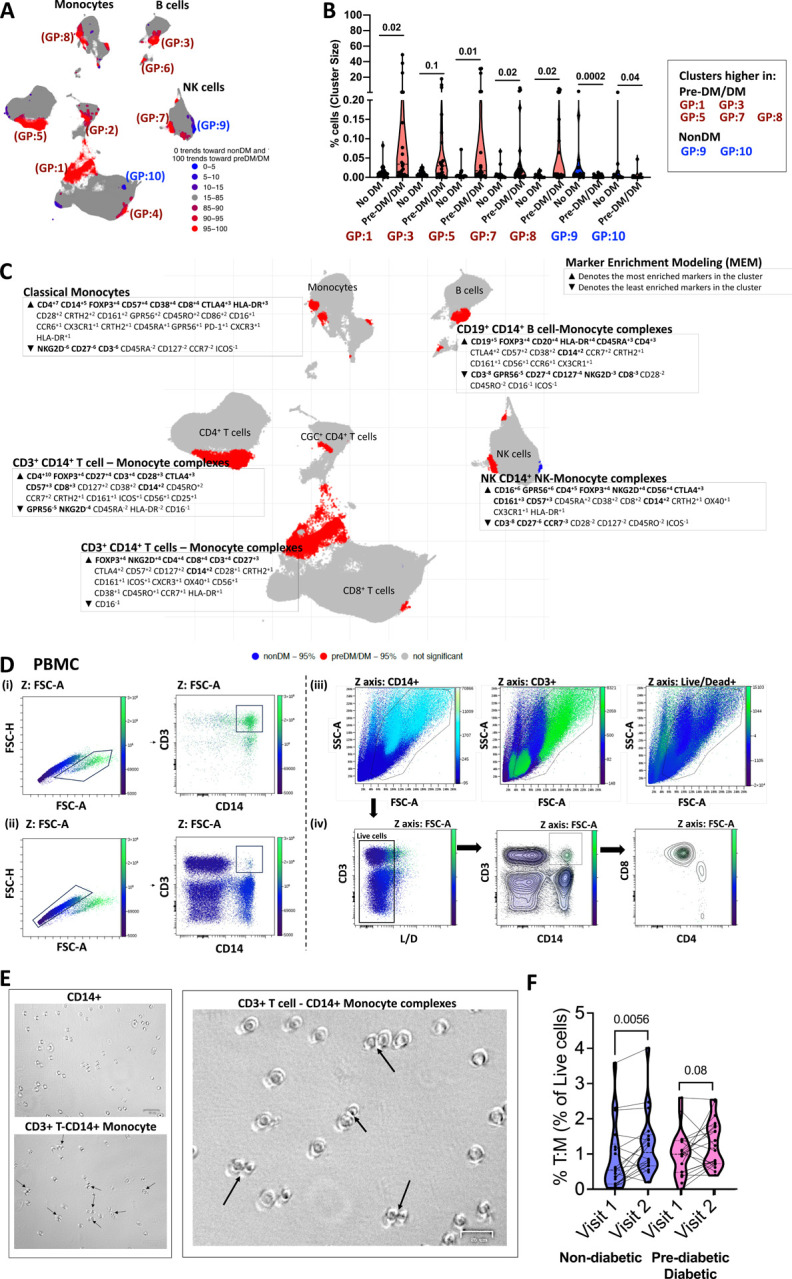
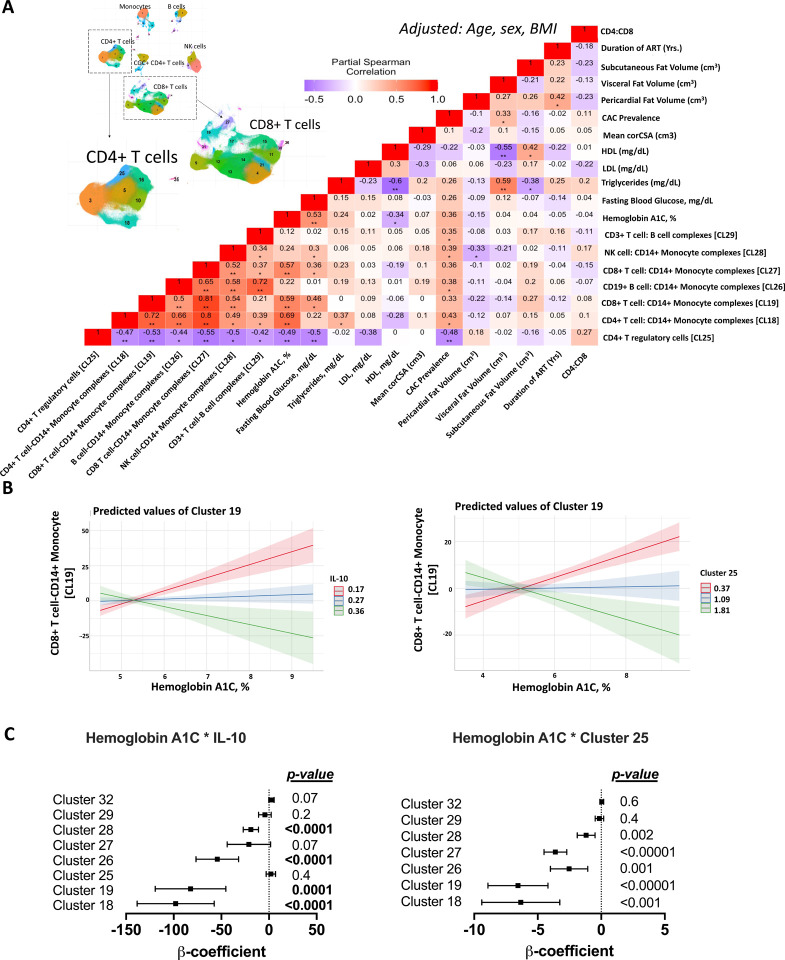
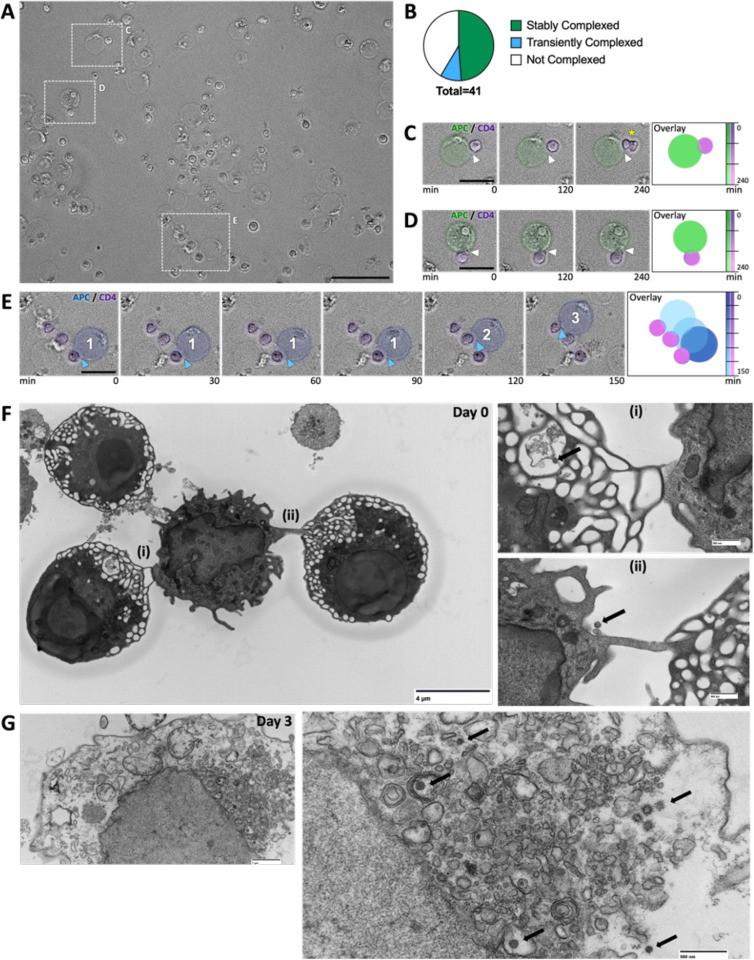
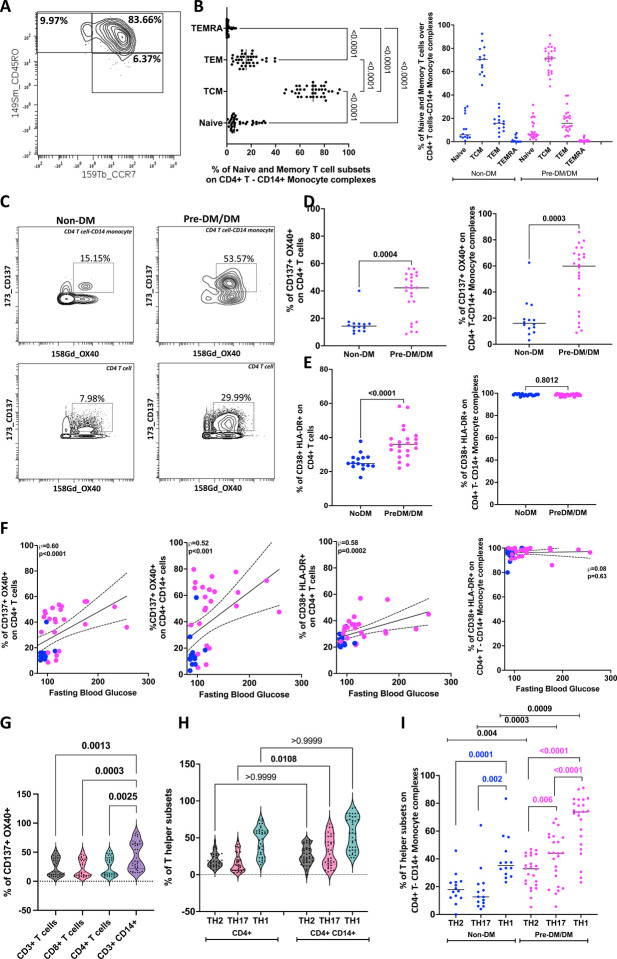
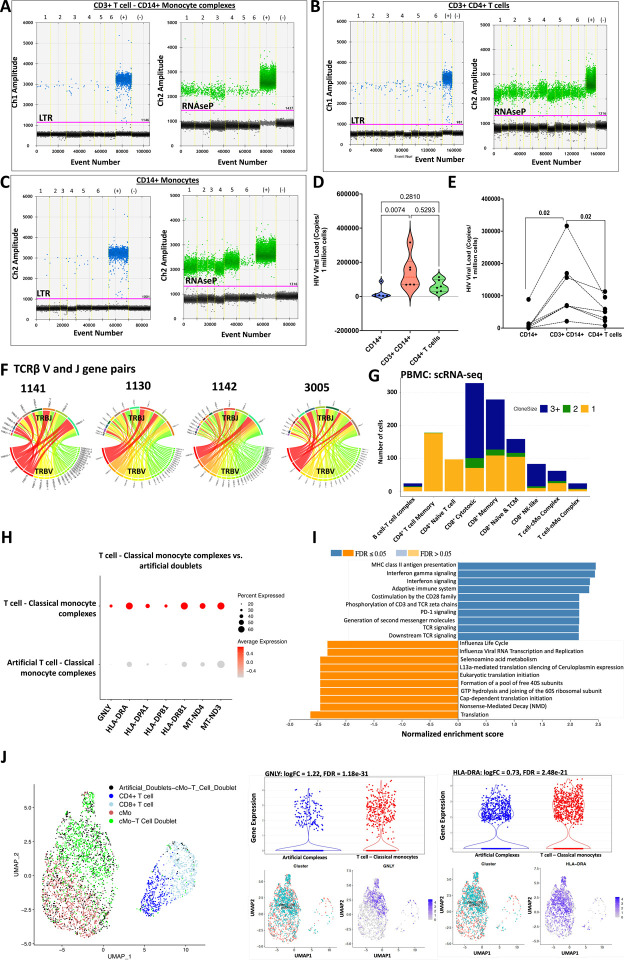
An increased risk of cardiometabolic disease accompanies persistent systemic inflammation. Yet, the innate and adaptive immune system features in persons who develop these conditions remain poorly defined. Doublets, or cell-cell complexes, are routinely eliminated from flow cytometric and other immune phenotyping analyses, which limits our understanding of their relationship to disease states. Using well-characterized clinical cohorts, including participants with controlled HIV as a model for chronic inflammation and increased immune cell interactions, we show that circulating CD14+ monocytes complexed to CD3+ T cells are dynamic, biologically relevant, and increased in individuals with diabetes after adjusting for confounding factors. The complexes form functional immune synapses with increased expression of proinflammatory cytokines and greater glucose utilization. Furthermore, in persons with HIV, the CD3+T-cell: CD14+monocyte complexes had more HIV copies compared to matched CD14+ monocytes or CD4+ T cells alone. Our results demonstrate that circulating CD3+T-cell:CD14+monocyte pairs represent dynamic cellular interactions that may contribute to inflammation and cardiometabolic disease pathogenesis and may originate or be maintained, in part, by chronic viral infections. These findings provide a foundation for future studies investigating mechanisms linking T cellmonocyte cell-cell complexes to developing immune-mediated diseases, including HIV and diabetes.

Keywords: CD3+T-cell:CD14+monocyte complexes; HIV; diabetes; doublets; reservoir.


Conflict of interest statement

Declaration of interests The authors have no competing interests.

Figures

Figure 1.
Figure 1.. Phenotypic characterization of PBMCs in non-diabetic, prediabetic, and diabetic PLWH highlights differences by metabolic disease category
(A) UMAP of 1.5 million CD45+ cells from the PBMCs of 38 participants with controlled HIV depicting clusters of monocytes, CD4+ T cells, CD8+ T cells, B cells, and NK cells. (B) UMAPs stratified by metabolic disease (no diabetes, prediabetes, and diabetes). For each UMAP, we downsampled to 40000 events per sample from all 38 participants. Clusters 18, 19, 26, 27, and 28 have cell-cell complexes and are significantly higher with prediabetes/diabetes compared to no diabetes. Other clusters that differ by diabetes are included in Table S2. (C) Heat map shows all markers used to define clusters in the UMAPs. The median fold difference legend bar (purple clusters are significantly higher in prediabetics/diabetics and blue are higher in non-diabetic PLWH). Clusters in the heat map are grouped according to the bigger clusters (labels on the right). The percentages indicate the number of cells in that cluster proportional to the total number of cells analyzed. (D) Dot plots show the % CD4+ T regulatory cell cluster over total live CD45+ and the constant of association between T/B cells and monocytes in the complex clusters 18, 19, 26, 27, and 28 by diabetes status. Statistical analysis by Mann-Whitney test (D). See Figure S1 and Table S3.
Figure 2.
Figure 2.. Classical monocytes complexed with T cells, NK cells, and B cells are increased in the peripheral blood of PLWH with glucose intolerance
(A) Clusters identified by the T-REX algorithm increase and decrease with prediabetes/diabetes (blue is higher in non-diabetics, and red is higher in prediabetic/diabetics). (B) Violin plots show proportions of select subclusters that are significantly different between non-diabetes (blue) and prediabetes/diabetes (maroon). (C) The enrichment scores of markers (increased ▲ and decreased ▼) for select clusters are shown over the UMAP adjacent to the clusters. The bold markers are the most significant among the markers that characterize the clusters. (D) Two-dimensional flow cytometry plot of PBMCs showing FSC-A and FSC-H of cells that comprise complexes (i) and singlets (ii). In section (iii), the FSC-A by SSC-A plots show CD14, CD3, and Live/Dead on the Z-channel. Lastly, (iv) shows live cells (including lymphocytes and monocytes), followed by a two-dimensional plot of CD3+ and CD14+ cells, and the last plot shows CD4 and CD8 marker expression on the T: M complexes. (E) Bright-field microscopy images of sorted CD14+ and CD3+ CD14+ cells. (F) Violin plot showing % CD3+ T cell-CD14+ monocyte complexes in longitudinal time points from the same patients 2–3 years apart. To avoid batch effects, all sample comparisons were performed within a single flow cytometry experiment. Statistical analysis by Mann-Whitney test (B) and Wilcoxon matched pair signed ranks test (F). See Figure S2. [Cluster 18: CD4+ T cell CD14+ Monocyte complex; Cluster 19: CD8+ T cell CD14+ Monocyte complex; Cluster 25: CD4+ T regulatory cell; Cluster 26: B cell-CD14+ Monocytes; Cluster 27: CD8+ T cell CD14+ Monocyte; Cluster 28: NK cell-CD14+ Monocyte; Cluster 29: CD3+ T cell B cell; Cluster 32: CD3+ T cell CD14+ Monocyte]
Figure 3.
Figure 3.. T cell-monocyte complexes are positively associated with blood glucose and negatively with IL-10 and CD4+ T regulatory cells in PLWH.
(A) Heatmap shows partial Spearman correlation between cell-cell complex clusters, CD4+ T regulatory cells from 38 participants as defined by mass cytometry, and hemoglobin A1c, fasting blood glucose adjusted for age, sex, and BMI (* p< 0.05, ** p<0.01). UMAP with clusters from Figure1 is included for reference. (B) Linear regression analysis with cell-cell complexes as the dependent variable and hemoglobin A1C*IL-10 or hemoglobin A1C*Cluster 25 as the independent variables. The line plots depict the relationship between CD8+ T cell – CD14+ monocyte complexes and hemoglobin A1C, with IL-10 as the interaction term (left) and CD4 T regulatory cells as the interaction term (right). (C) A similar analysis was performed for all cell-cell complex clusters, showing the β coefficients, the 95% confidence intervals, and p-values. See Figure S3.
Figure 4.
Figure 4.. CD3+ T cell-CD14+ monocyte complexes from PLWH are dynamic
(A) Phase-contrast microscopy of sorted CD3+ CD14+ T cell-monocyte complexes at time 0. (B) Pie chart shows the percentage of CD14+ monocytes that are stably associated with T cells, transiently associated with T cells, or not associated with T cells over 4.5hrs. (C & D) Insets of stable complexes, right-hand panel shows the time overlay and the color code. A yellow asterisk (*) in c marks a T cell that proliferates. Scale bars – purple pseudo color defines T cell and green marks the monocyte. (E) Time series demonstrating transient interactions between CD14+ monocyte and three T cells (marked 1,2,3). Blue arrowheads and numbers mark the point of interactions between CD14+ monocyte and T cells. (F) TEM of CD3+ T cell-CD14+ monocyte complexes. Inset highlights ultrastructural cell-cell interactions (i) and (ii) and the presence of 100nm diameter particles (black arrow). (G) TEM of CD3+ T cell among sorted CD3+ T cell-CD14+ monocyte complexes 3 days postculture. Enlarged image (i) highlighting 100nm diameter particles (black arrow). Scale bars are 50μm A, 20μm C-E, 4μM F, 500nm F(i), F(ii), G (i), and 1μm G. See Videos 1–3.
Figure 5.
Figure 5.. CD4+ T cells complexed with CD14+ monocytes are more activated with higher proportions of TH17 cells compared to singlet CD4+ T cells.
(A) Two-dimensional plot of mass cytometry data shows the gating of naïve and memory subsets of CD4+ T cells in complex with CD14+ monocytes (Naïve, CD45RO CCR7+; TCM, CD45RO+ CCR7+; TEM CD45RO+ CCR7; TEMRA CD45RO CCR7). Gating for CD4+ T cells shown in Figure S1A. (B) Dot plots show the proportions of naïve and memory cells in CD4+ T cell-CD14+ monocyte complexes in all participants (left) and in non-diabetic (n=14) and prediabetic/diabetic PLWH (n=24). (C) Representative plots showing CD137/OX40 on CD4+ T cell-CD14+ monocyte complexes and CD4+ T cells stratified by diabetes. (D) Dot plots show % CD137+ OX40+ cells on CD4+ T cells and on CD4+ T cell-CD14+ monocyte complexes. (E) Dot plots show % HLA-DR+ CD38+ cells on CD4+ T cells and on CD4+ T cell-CD14+ monocyte complexes. (F) Correlation plots showing the relationships between fasting blood glucose and % CD137+ OX40+ cells on CD4+ T cells and CD4+ T cell-CD14+ complexes with. Similar plots of CD38+ HLA-DR+ expressing cells on CD4+ T cells and on CD4+ T cell-CD14+ monocyte complexes are shown. (G) Violin plots show higher proportions of activated CD137+ OX40+ cells among CD3+ T cell-CD14+ monocyte complexes compared to CD3+ T cells, CD8+ T cells, and CD4+ T cells. (H) Violin plots show higher proportions of TH17 cells among CD3+ T cell-CD14+ monocyte complexes compared to singlet CD4+ T cells. (I) PLWH with pre-diabetes/diabetes have a higher proportion of TH2 (CRTH2/CCR4), TH17 (CCR6/CD161), and TH1 (CXCR3) cells as a proportion of CD3+ T cell-CD14+ monocyte complexes compared to non-diabetic PLWH. Statistical analyses were performed using the Mann-Whitney U test (D-E), Spearman correlation (F), and the Kruskal-Wallis test (G-I).
Figure 6.
Figure 6.. CD3+ T cell-CD14+ monocyte complexes from PLWH have more copies of HIV compared to singlet CD4+ T cells and CD14+ monocytes.
(A) Representative ddPCR plot showing HIV-LTR (blue droplets) and RNase P (green droplets) copies in sorted CD3+ T cell-CD14+ monocyte complexes, (B) CD3+ CD4+ T cells and (C) CD14+ monocytes from PLWH. (D) Violin plot shows ddPCR results for HIV quantification from 6 PLWH. (E) The line plot shows HIV viral copies in paired samples. (F) Single CD3+ T cell: CD14+ monocyte complexes were index-sorted from PBMCs followed by TCR sequencing. The Circos plot shows TCRβ V-J gene pairs of T cells complexed with monocytes from four PLWH (1130, 1141, 1142, and 3005). (G) TCR sequences were obtained from CITE-seq analysis of PBMCs from one individual with many CD3+ T cells-CD14+ monocyte complexes. The stacked bar chart shows the total number of cells with TCRs and is color-coded based on the clonality of the cells (shared complementarity-determining region 3 (CDR3) sequences with ≥ 2 were considered clonal). (H) Dot plot shows genes that are differentially expressed in T cell-classical monocyte complexes compared to artificial T cell-monocyte complexes from the same scRNA-seq data set. (I) GSEA analysis shows the Reactome pathways enriched by differentially expressed genes that are higher in the T cell-classical monocyte complexes (blue bars) when compared to the artificial complexes (orange bars). (J) UMAP shows artificial complexes and CD3+ T cell-CD14+ classical monocyte complexes among other T cells (left panel). Violin plots and UMAPs show differential gene expression of GNLY (middle panel) and HLA-DRA (right panel). Statistical analysis using Kruskal Wallis (D), Wilcoxon test (E). See Tables S7e

References

    1. Abana C. O., Pilkinton M. A., Gaudieri S., Chopra A., McDonnell W. J., Wanjalla C., … Mallal S. A. (2017). Cytomegalovirus (CMV) Epitope-Specific CD4(+) T Cells Are Inflated in HIV(+) CMV(+) Subjects. J Immunol, 199(9), 3187–3201. doi:10.4049/jimmunol.1700851 - DOI - PMC - PubMed
    1. Alcaide M. L., Parmigiani A., Pallikkuth S., Roach M., Freguja R., Della Negra M., … Pahwa S. (2013). Immune activation in HIV-infected aging women on antiretrovirals--implications for age-associated comorbidities: a cross-sectional pilot study. PLoS One, 8(5), e63804. doi:10.1371/journal.pone.0063804 - DOI - PMC - PubMed
    1. Argüello R. J., Combes A. J., Char R., Gigan J. P., Baaziz A. I., Bousiquot E., … Pierre P. (2020). SCENITH: A Flow Cytometry-Based Method to Functionally Profile Energy Metabolism with Single-Cell Resolution. Cell Metab, 32(6), 1063–1075.e1067. doi:10.1016/j.cmet.2020.11.007 - DOI - PMC - PubMed
    1. Arya S M. D., Kemp SE, Jefferis G. (2019). RANN: Fast Nearest Neighbour Search (Wraps ANN Library) Using L2 Metric. R package version 2.6.1. Retrieved from https://github.com/jefferislab/RANN
    1. Bailin S. S., Kundu S., Wellons M., Freiberg M. S., Doyle M. F., Tracy R. P., … Koethe J. R. (2022). Circulating CD4+ TEMRA and CD4+ CD28− T cells and incident diabetes among persons with and without HIV. Aids, 36(4), 501–511. doi:10.1097/qad.0000000000003137 - DOI - PMC - PubMed

Publication types