[Preprint]. 2023 Apr 29:2023.04.28.538590.
doi: 10.1101/2023.04.28.538590.

An RNA Damage Response Network Mediates the Lethality of 5-FU in Clinically Relevant Tumor Types

Affiliations

An RNA Damage Response Network Mediates the Lethality of 5-FU in Clinically Relevant Tumor Types

Jung-Kuei Chen et al. bioRxiv. .

Update in

  • An RNA damage response network mediates the lethality of 5-FU in colorectal cancer.
    Chen JK, Merrick KA, Kong YW, Izrael-Tomasevic A, Eng G, Handly ED, Patterson JC, Cannell IG, Suarez-Lopez L, Hosios AM, Dinh A, Kirkpatrick DS, Yu K, Rose CM, Hernandez JM, Hwangbo H, Palmer AC, Vander Heiden MG, Yilmaz ÖH, Yaffe MB. Chen JK, et al. Cell Rep Med. 2024 Oct 15;5(10):101778. doi: 10.1016/j.xcrm.2024.101778. Epub 2024 Oct 7. Cell Rep Med. 2024. PMID: 39378883 Free PMC article.

Abstract

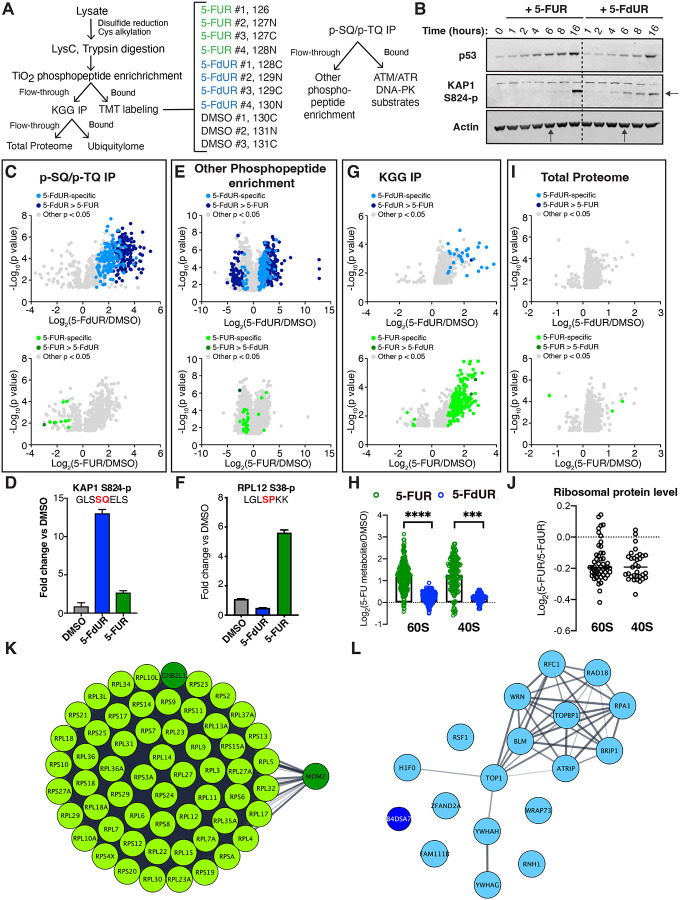
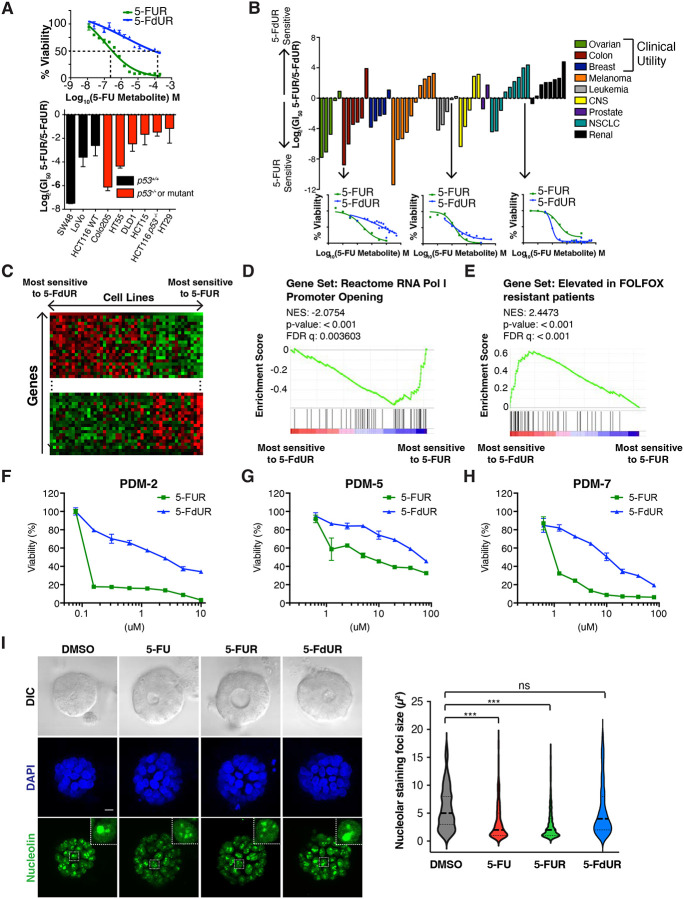
5-fluorouracil (5-FU) is a successful and broadly used anti-cancer therapeutic. A major mechanism of action of 5-FU is thought to be through thymidylate synthase (TYMS) inhibition resulting in dTTP depletion and activation of the DNA damage response. This suggests that 5-FU should synergize with other DNA damaging agents. However, we found that combinations of 5-FU and oxaliplatin or irinotecan failed to display any evidence of synergy in clinical trials, and resulted in sub-additive killing in a panel of colorectal cancer (CRC) cell lines. In seeking to understand this antagonism, we unexpectedly found that an RNA damage response during ribosome biogenesis dominates the drug's efficacy in tumor types for which 5-FU shows clinical benefit. 5-FU has an inherent bias for RNA incorporation, and blocking this greatly reduced drug-induced lethality, indicating that accumulation of damaged RNA is more deleterious than the lack of new RNA synthesis. Using 5-FU metabolites that specifically incorporate into either RNA or DNA revealed that CRC cell lines and patient-derived colorectal cancer organoids are inherently more sensitive to RNA damage. This difference held true in cell lines from other tissues in which 5-FU has shown clinical utility, whereas cell lines from tumor tissues that lack clinical 5-FU responsiveness typically showed greater sensitivity to the drug's DNA damage effects. Analysis of changes in the phosphoproteome and ubiquitinome shows RNA damage triggers the selective ubiquitination of multiple ribosomal proteins leading to autophagy-dependent rRNA catabolism and proteasome-dependent degradation of ubiquitinated ribosome proteins. Further, RNA damage response to 5-FU is selectively enhanced by compounds that promote ribosome biogenesis, such as KDM2A inhibitors. These results demonstrate the presence of a strong RNA damage response linked to apoptotic cell death, with clear utility of combinatorially targeting this response in cancer therapy.


Figures

Figure 1:
Figure 1:. Sub-additivity and antagonism of tumor cell killing in clinically relevant 5-FU drug combinations
A) Sensitivity of LoVo, Colo205, and HT-29 CRC cells to 5-FU, oxaliplatin, and irinotecan was determined using Resazurin cell viability assay after 72 h of drug treatment. The area under the curve (AUC) used to summarize the drug response in panel B is highlighted. B) Area under the curve data for each drug response was determined as in A) reveals distinct sensitivities of CRC cell lines to 5-FU, oxaliplatin, and irinotecan. C) 5-FU treatment impacts the DDR in multiple ways to potentially alter response to oxaliplatin and irinotecan. D) HT-29 cells were treated with a dose-response matrix of 5-FU and irinotecan (top doses of 200 μM and 50 μM, respectively), and cell viability was measured after 72 hours by CellTiter-Glo (Observed). The effect of each drug individually was used to calculate the expected viability of the drug combinations based on a Bliss Independence model (Expected), and the effect of the drug combination was determined by comparing these values. Negative numbers indicate antagonism or sub-additivity, 0 indicates an additive effect, and positive numbers indicate synergy. E) HT-29 cells were treated with a dose-response matrix of hydroxyurea (HU) and irinotecan (top doses of 4 mM and 50 μM, respectively). Observed and expected viability from the combinations was determined as in panel F. F) Dose-response matrices for the indicated cell lines were generated with 5-FU and oxaliplatin (top doses of 200 μM and 20 μM, respectively), and viability was measured using Resazurin cell viability assay after 72 h of drug treatment. The effect of the drug combinations was determined as in panel D. G) DLD1 cells were treated with oxaliplatin (5 μM) or irinotecan (6.25 μM) +/− 50 μM 5-FU for 48 hours, and the induction of apoptosis was measured by flow cytometry. H) 5-FU/LV and irinotecan have sub-additive effects on time to progression (hazard ratio for observed versus expected efficacy = 1.25, 95% CI [1.03, 1.51], Cox proportional hazard model). Note that HR=1 does not mean no efficacy, it means as effective as expected, Cox proportional hazard model. I) 5-FU/LV and oxaliplatin have additive effects on Progression-free survival (hazard ratio for observed versus expected efficacy = 1.08, 95% CI [0.86, 1.36], Cox proportional hazard model).
Figure 2:
Figure 2:. The canonical mechanism of 5-FU action does not explain drug-induced lethality
A) 5-FU is metabolized by the pyrimidine salvage pathway to generate multiple bioactive metabolites. B) HCT116 cells were treated with 0.6 μCi [2-14C]-5-FU or [2-14C]-uracil for 24 or 48 hours. RNA and DNA were purified and incorporation was quantified using a scintillation counter. C) HCT116 cells were treated with 0.6 μCi [2-14C]-5-FU, 0.6 μCi [2-14C]-uracil, or 0.6 μCi [2-14C]-uracil + 12.5 μM unlabeled 5-FU (the drug dose used when cells are treated with 0.6 μCi [2-14C]-5-FU). RNA and DNA were purified and incorporation was quantified as in panel B. D) HCT116 cells were treated with aphidicolin (APH) for 4 hours, CX-5461 for 1 hour, or both prior to addition of 200 μM 5-FU for 24 h. Cells were harvested, fixed, and the percentage of apoptotic cells was determined by flow cytometry. Representative FACS data were presented and quantified at bottom as mean ± s.e.m. from three independent experiments. *P < 0.05, **P < 0.01. E) HCT116 cells were treated with aphidicolin or CX-5461 as in D) prior to addition of 0.6 μCi [2-14C]-5-FU. RNA was purified and incorporation was quantified as in panel B. F) HCT116 cells were treated as in D), and collected after 24 h for western blot. G) HCT116 cells were transfected with siControl or siTYMS for 48 h, and knockdown efficiency was determined by western blot. H) HCT116 cells were transfected with siRNA as in G), and cells were treated with 5-FU for 24 hours. The percentage of apoptotic cells was quantified as mean ± s.e.m. from three independent experiments. *P < 0.05, **P < 0.01.
Figure 3:
Figure 3:. 5-FU metabolites biased towards RNA and DNA damage reveal pathway specific responses
A) HCT116 cells were treated with equal concentrations of 5-FU, 5-FdUR, or 5-FUR for 8 or 24 hours, and activation of the DDR was monitored by detecting phosphorylation of Chk1 and Chk2. B) Response to 5-FUR and 5-FdUR in HCT116 cells was determined by flow cytometry 24 hours after drug treatment C) As in B), except with HCT116 p53−/− cells after 48 hours of treatment. D) SW48 cells were treated with increasing doses of 5-FUR or 5-FdUR (10 μM top concentration) for 16 hours, and lysates were analyzed by western blot. E) HCT116 cells were treated with CX-5461 prior to addition of 2 μM 5-FUR or 20 μM 5-FdUR. Induction of apoptosis was determined by flow cytometry 24 hours after drug treatment. Representative FACS data were presented and quantified at right as mean ± s.e.m. from three independent experiments. *P < 0.05. F) HCT116 cells were treated with CX-5461 or the RNA Polymerase III inhibitor ML-60218 prior to 5-FUR addition. After 4 hours of 5-FUR treatment, drugs were washed out to reduce the toxicity of ML-60218 and viability was determined by flow cytometry. G) A CRC cell line panel (see Figure 4A) was treated with 5-FUR or 5-F-5’dUR for 72 hours, and viability was determined by CellTiter-Glo. Each line represents the dose-response curve for 5-FUR or 5-F-5’dUR. H) HCT116 WT cells were treated with a dose-response matrix of a Chk1 inhibitor and 5-FdUR (left) or 5-FUR (right). Viability following treatment was determined by staining with SYTO60 I) As in H), except using HCT116 p53−/− cells.
Figure 4:
Figure 4:. Distinct signaling responses exist to 5-FU metabolites that cause DNA and RNA damage
A) Schematic for 11-plex TMT mass spectrometry to assess signaling response to 5-FUR and 5-FdUR. B) HCT116 cells were treated with 1 μM 5-FUR or 5-FdUR for the indicated times, and the indicated proteins were assessed by western blot. C) Volcano plot for p-SQ/p-TQ IP showing all peptides that were significantly different in 5-FdUR (top) or 5-FUR (bottom) treated cells compared to cells treated with DMSO. Peptides were classified as being specific or enriched for one metabolite as described in materials and methods. D) Quantification of KAP1 S824-p peptide from p-SQ/p-TQ IP across all treatment conditions as an example of a 5-FdUR phosphopeptide. E) As in C), showing significant peptides identified following phosphopeptide enrichment. F) Quantification of RPL12 S38-p peptide from all treatment conditions as an example of a 5-FUR specific phosphopeptide. G) As in C), showing significant peptides identified following KGG IP. H) Quantification of peptides identified following KGG IP from proteins that are part of the 60S or 40S ribosomal subunits for 5-FUR or 5-FdUR treatment. I) As in C), showing proteins whose expression significantly changed following compound treatment. J) Total levels of ribosomal proteins decrease following treatment with 5-FUR relative to 5-FdUR. K) STRING functional protein association networks of 5-FUR-induced ubiquitinated proteins generated by Cytoscape software. L) STRING functional protein association networks of 5-FdUR-induced ubiquitinated proteins generated by Cytoscape software.
Figure 5:
Figure 5:. 5-FUR causes proteasome-dependent degradation of ribosomal proteins
A) HCT116 cells were treated with 2 μM 5-FUR or 2 μM 5-FdUR for 18 hours and subjected to polysome gradient to reveal ribosome profile. B) HCT116 cells were treated with increasing concentration of 5-FUR for 18 hours. The total cell lysates were prepared using Laemmli buffer and subjected to immunoblotting against the indicated antibodies. C) HCT116 cells were treated with 2 μM 5-FUR together with 20 uM chloroquine or 5 uM MG132 for 18 hours. Data from three independent experiments were quantified as mean ± s.e.m. *P < 0.05. D) HCT116 cells were treated with DMSO, 80 μM 5-FU, 2 μM 5-FUR, or 20 μM 5-FUR for 6 hours and subjected to immunofluorescence against nucleolin. The arrow indicates necklace-like nucleolin distribution, and the arrowhead indicates punctate nucleolin foci. The scale bar is 10 μm. E) HCT116 cells were treated with DMSSO or 1 μM 5-FUR for 6 and 24 hours and subjected to immunofluorescence as shown in 5D.
Figure 6.
Figure 6.. 5-FUR causes autophagy-dependent degradation of ribosomal rRNA
A) HCT116 cells were treated with 40 μM 5-FU, 2 μM 5-FUR or 2 μM 5-FdUR for 18 hours. The extracted RNA was subjected to electrophoresis to show the 18S/28S ribosomal RNA abundance. 18S and 28S rRNA abundance were quantified at right as mean ± s.e.m. from three independent experiments. *P < 0.05, **P < 0.01, ***P < 0.001. B) HCT116 cells were treated with 2 μM 5-FUR or 2 μM 5-FdUR for 18 hours. The extracted RNA was reverse-transcribed to cDNA using random hexamer and subjected to qPCR analysis to show the 18S, 28S and 45S ribosomal RNA abundance. Data is presented as mean ± s.e.m. from three independent experiments ***P < 0.001, ns, not significant (P > 0.05). C) HCT116 cells were treated with 2 μM 5-FUR or 2 μM 5-FdUR for 18 hours and subjected to immunofluorescence against indicated antibodies. Representative fluorescent images of LC3 expression of three independent experiments. The scale bar is 10 μm. D) HCT116 cells were treated with 2 μM 5-FUR or 2 μM 5-FdUR for 15 hours. 20uM chloroquine (CQ) was added for another 3 hours. LC3-II was normalized to actin and autophagic flux was calculated by subtracting the value of normalized LC3-II in the presence of CQ by that without CQ. Autophagy flux of DMSO-treated cells was set to 1, and the rest of the samples were normalized accordingly. Data is presented as mean ± s.e.m. from three independent experiments. ***P < 0.001. E) HCT116 cells were transfected with non-targeting or ATG5 siRNA and then treated with or without 2 μM 5-FUR for 18 hours. The extracted RNA was reverse-transcribed to cDNA and subjected to quantitative PCR against individual ribosomal RNA transcript. Data was normalized to DMSO-treated cells and presented as mean ± s.e.m. from three independent experiments. **P < 0.01. F) HCT116 cells were treated with DMSO or 2 μM 5-FUR for 12 hours. After the incubation, live cells were stained with SYTO RNA select for 20 min at 37 °C, and then with 50 μM monodansylcadaverine (MDC) for a further 30 min at 37 °C. The data showed representative fluorescent images of MDC and SYTO RNA staining of three independent experiments. DIC, differential interference contrast. The scale bar is 10 μm. G) HCT116 cells were treated with 2 μM 5-FUR in the presence or absence of 20 μM chloroquine (CQ) for 18 hours. Viability was accessed by trypan exclusion assay and each bar represents ratio of cells treated with 5-FUR to cells treated with DMSO in the presence or absence of chloroquine. Data was presented as mean ± s.e.m. from three independent experiments. *P < 0.05. H) HCT116 cells were treated with 2 μM 5-FUR in the presence of 20 μM chloroquine (CQ) for 24 hours. Induction of apoptosis was determined by flow cytometry and presented as mean ± s.e.m. from three independent experiments. *P < 0.05. I) HCT116 cells were transfected with non-targeting or ATG5 siRNA and then treated with or without 2 μM 5-FUR for 18 hours. Cell viability was determined as in Figure 6F. J) Non-targeting or ATG5 siRNA-transfected cells were treated with or without 1 μM 5-FUR for 20 hours. Induction of apoptosis was determined as in Figure 6G.
Figure 7.
Figure 7.. KDM2A depletion enhances RNA damage and synergizes cells to 5-FU
A) HCT116 cells were cultured in DMEM with or without glucose and treated with 5-FUR. 48 hours after 5-FUR treatment, viability was assessed by MTT assay. (representative of two independent experiments). B) HCT116 cells were cultured in DMEM with or without glucose for 24 hours followed by EU labelling and the newly synthesized RNA was analysed by immunofluorescence. The fluorescence intensity was quantified at right, each dot represents the average nuclear EU intensity for cells in a field. Data is presented as mean ± s.e.m. from two independent experiments. ***P < 0.001. The scale bar is 10 μm. C) HCT116 cells were treated with 0.4 μM of 5-FUR in the presence or absence of Daminozide (KDM2A inhibitor). Viability was accessed by trypan exclusion assay and each bar represents ratio of cells treated with 5-FUR to cells treated with DMSO in the presence or absence of Daminozide. Data is presented as mean ± s.e.m. from three independent experiments. *P < 0.05, **P < 0.01. The scale bar is 10 μm. D) HCT116 cells were treated with DMSO or 2 μM Daminozide for 24 hours and following EU labelling as B). Data is presented as mean ± s.e.m. from three independent experiments. ***P < 0.001. E) HCT116 cells were treated DMSO or 5-FUR in the presence or absence of Daminozide for 24 hours. The total cell lysates were prepared using Laemmli buffer and subjected to immunoblotting against the antibodies indicated. F) HCT 116 cells were transfected with non-targeting or KDM2A siRNAs and then treated with or without 0.4 μM 5-FUR for 24 hours. Viability was measured as shown in C). Data is presented as mean ± s.e.m. from three independent experiments. *P < 0.05, **P < 0.01. G) HCT 116 cells were transfected with non-targeting or KDM2A siRNA and then treated with or without 0.4 μM 5-FUR for 24 hours. The total cell lysates were prepared using Laemmli buffer and subjected to immunoblotting against the antibodies indicated. H) HCT 116 cells were transfected with non-targeting or KDM2A siRNAs and then treated with or without various concentration of 5-FU, 5-FUR and 5-FdUR for 24 hours. Viability was accessed by colony formation assay. (representative of three independent experiments). I). HCT 116 cells were transfected with non-targeting or KDM2A siRNAs and then treated with or without 40 μM 5-FU, 0.4 μM 5-FUR and 20 μM 5-FdUR for 24 hours. Induction of apoptosis was determined by flow cytometry. Representative FACS data were presented and quantified at right as mean ± s.e.m. from three independent experiments.
Figure 8:
Figure 8:. Variance in response to 5-FU metabolites predicts patient response to 5-FUbased therapy
A) A CRC cell line panel was treated with 5-FUR and 5-FdUR dose titrations, and viability was determined after 72 hours by CellTiter-Glo. Shown is Log2(GI50 5-FUR/GI50 5-FdUR) to assess the relative sensitivity to 5-FU’s RNA and DNA damage effects. The top panel represented 5-FUR and 5-FdUR dose titrations in SW48 cell line. B) Dose-response curves for 5-FUR and 5-FdUR were calculated for cell lines in the NCI60 from publically available data, and the Log2(GI50 5-FUR/GI50 5-FdUR) was calculated. Each bar represents a single cell line, and bars are colored based on the tissue of origin for the cell line. C) The Z-score of Log2(GI50 5-FUR/GI50 5-FdUR) calculated in panel B was correlated with the Z-score of gene expression for the NCI-60 cell line panel to identify genes that were highly correlated with sensitivity to one metabolite or the other. D) The sensitivity-gene expression correlation from panel C was used to identify gene sets that were highly expressed in 5-FUR sensitive and resistant cell lines. Gene sets involved in RNA polymerase I transcription were highly enriched (ES: −0.551, NES: −2.0754, p value: < 0.001, FDR q value: 0.003603). E) A gene signature that predicts patient sensitivity to FOLFOX suggests that non-responders are resistant to 5-FU mediated RNA damage (ES: 0.6301, NES: 2.4473, p value: < 0.001, FDR q value: < 0.001). F-I) organoid were treated with or without various concentration of 5-FU, 5-FUR and 5-FdUR. Viability was determined using Resazurin cell viability assay after 5 days of drug treatment J) PDM2 organoid were treated with DMSO, 40 μM 5-FU, 1 μM 5-FUR, or 20 μM 5-FUR for 6 hours and subjected to immunofluorescence against nucleolin. The scale bar is 10 μm. The size of nucleolin staining were quantified and plotted as violin plot from more than 100 cells ***P < 0.001.
Figure 9:
Figure 9:. Proposed model for 5-FU-induced RNA damage
5-FU incorporation into rRNA is proposed to cause rRNA degradation through a autophagosome-mediated pathway. The ubiquitinated ribosome proteins are degraded by proteasome pathway. The 5-FU toxicity can be modulated by targeting the ribosome biogenesis pathway.

References

    1. An H., and Harper J.W. (2018). Systematic analysis of ribophagy in human cells reveals bystander flux during selective autophagy. Nat Cell Biol 20, 135–143. - PMC - PubMed
    1. Becouarn Y., Ychou M., Ducreux M., Borel C., Bertheault-Cvitkovic F., Seitz J.F., Nasca S., Nguyen T.D., Paillot B., Raoul J.L., et al. (1998). Phase II trial of oxaliplatin as first-line chemotherapy in metastatic colorectal cancer patients. Digestive Group of French Federation of Cancer Centers. J Clin Oncol 16, 2739–2744. - PubMed
    1. Bruno P.M., Liu Y., Park G.Y., Murai J., Koch C.E., Eisen T.J., Pritchard J.R., Pommier Y., Lippard S.J., and Hemann M.T. (2017). A subset of platinum-containing chemotherapeutic agents kills cells by inducing ribosome biogenesis stress. Nat Med 23, 461–471. - PMC - PubMed
    1. Bruno P.M., Lu M., Dennis K.A., Inam H., Moore C.J., Sheehe J., Elledge S.J., Hemann M.T., and Pritchard J.R. (2020). The primary mechanism of cytotoxicity of the chemotherapeutic agent CX-5461 is topoisomerase II poisoning. Proc Natl Acad Sci U S A 117, 4053–4060. - PMC - PubMed
    1. Burger K., Muhl B., Harasim T., Rohrmoser M., Malamoussi A., Orban M., Kellner M., Gruber-Eber A., Kremmer E., Holzel M., et al. (2010). Chemotherapeutic drugs inhibit ribosome biogenesis at various levels. J Biol Chem 285, 12416–12425. - PMC - PubMed

Publication types