[Preprint]. 2023 Apr 29:2023.04.29.23289296.
doi: 10.1101/2023.04.29.23289296.

Single-cell profiling reveals immune aberrations in progressive idiopathic pulmonary fibrosis

Affiliations

Single-cell profiling reveals immune aberrations in progressive idiopathic pulmonary fibrosis

Avraham Unterman et al. medRxiv. .

Update in

Abstract

Rationale: Changes in peripheral blood cell populations have been observed but not detailed at single-cell resolution in idiopathic pulmonary fibrosis (IPF).

Objectives: To provide an atlas of the changes in the peripheral immune system in stable and progressive IPF.

Methods: Peripheral blood mononuclear cells (PBMCs) from IPF patients and controls were profiled using 10x Chromium 5' single-cell RNA sequencing (scRNA-seq). Flow cytometry was used for validation. Protein concentrations of Regulatory T-cells (Tregs) and Monocytes chemoattractants were measured in plasma and lung homogenates from patients and controls.

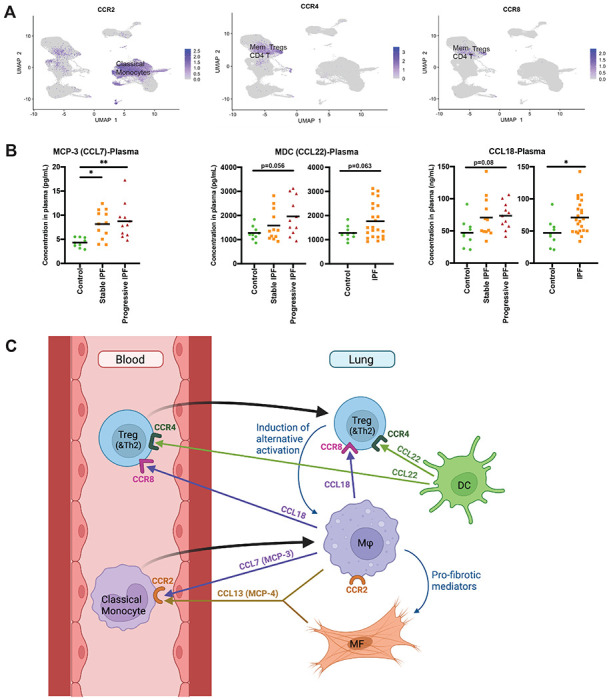
Measurements and main results: Thirty-eight PBMC samples from 25 patients with IPF and 13 matched controls yielded 149,564 cells that segregated into 23 subpopulations, corresponding to all expected peripheral blood cell populations. Classical monocytes were increased in progressive and stable IPF compared to controls (32.1%, 25.2%, 17.9%, respectively, p<0.05). Total lymphocytes were decreased in IPF vs controls, and in progressive vs stable IPF (52.6% vs 62.6%, p=0.035). Tregs were increased in progressive IPF (1.8% vs 1.1%, p=0.007), and were associated with decreased survival (P=0.009 in Kaplan-Meier analysis). Flow cytometry analysis confirmed this finding in an independent cohort of IPF patients. Tregs were also increased in two cohorts of lung scRNA-seq. CCL22 and CCL18, ligands for CCR4 and CCR8 Treg chemotaxis receptors, were increased in IPF.

Conclusions: The single-cell atlas of the peripheral immune system in IPF, reveals an outcome-predictive increase in classical monocytes and Tregs, as well as evidence for a lung-blood immune recruitment axis involving CCL7 (for classical monocytes) and CCL18/CCL22 (for Tregs).

Keywords: Idiopathic Pulmonary Fibrosis; Immune System; Monocytes; Regulatory T Cells; Single-cell RNA Sequencing.


Conflict of interest statement

NK is a scientific founder at Thyron, served as a consultant to Biogen Idec, Boehringer Ingelheim, Third Rock, Pliant, Samumed, NuMedii, Theravance, LifeMax, Three Lake Partners, Optikira, Astra Zeneca, RohBar, Veracyte, Augmanity, CSL Behring, Galapagos, Fibrogen, and Thyron over the last 3 years, reports Equity in Pliant and Thyron, and grants from Veracyte, Boehringer Ingelheim, BMS and non-financial support from MiRagen and Astra Zeneca. AU reports receiving research funding from Boehringer Ingelheim, and personal consulting fees or honoraria from Boehringer Ingelheim, Kamada, RemedyCell, Augmanity Nano, Splisense, Veracyte, and 1E Therapeutics in the last 36 months. JCS reports receiving honoraria and travel support from Boehringer Ingelheim. All other authors report no conflict of interest.

Figures

Figure 1:
Figure 1:. Study design and single-cell clustering results.
A. Banked, cryopreserved PBMCs from 12 progressive IPF patients, 13 matched stable IPF patients and 13 matched control subjects were included in this study. Blood had been drawn at the time of IPF diagnosis and was processed into cryopreserved PBMCs and plasma. IPF patients were followed for 36 months after the blood draw. Those subjects alive at the end of the 36 months period were considered “Stable”, while those who died were termed “Progressive”, as depicted in the Kaplan-Meyer curve. Cryopreserved PBMCs were processed in 5 randomized batches and subjected to 5’ scRNA-seq while plasma was used to determine the level of relevant cytokines and chemokines. Re-analysis of lung scRNA-seq data and cytokine levels in lung tissue homogenates supplemented the blood-based data. B. UMAP representation of 149,564 cells parceled into 23 cell types. All expected cell types were identified. C. Same UMAP as in panel B, with cells color coded according to disease and disease progression. Abbreviations: PBMCs peripheral blood mononuclear cells, DC dendritic cells, NK natural killer cells.
Figure 2:
Figure 2:. Shifts in PBMC subpopulations with disease severity.
A. Boxplots showing scRNA-seq based cell proportions for all monocytes and all lymphocytes (as % of all PBMCs), grouped by control, stable, and progressive IPF. The results are depicted in boxplots, in which the value for each subject is represented by a dot, the upper and lower bounds represent the 75% and 25% percentiles, respectively. The center bars indicate the medians, and the whiskers denote values up to 1.5 interquartile ranges above the 75% or below the 25% percentiles. B. Similar boxplots showing scRNA-seq based cell proportions for each cell type. Abbreviations: DC dendritic cells, IM intermediate, NC non-classical, NK natural killer. * p<0.05, ** p<0.01.
Figure 3:
Figure 3:. Differences in PBMC gene expression profile between IPF and controls.
A. Heatmap showing the top differentially expressed genes (log2FC > 0.3, adjusted P values < 0.05) for each major cell type, comparing IPF patients to matched controls. The upper part of the heatmap depicts genes that are increased in IPF compared to control subjects (marked “increased in IPF”). Hierarchical clustering highlights the inter-subject variability in gene expression, leading to a mix of IPF and control subjects (color coded in upper panel). B. Violin plots focusing on selected genes that differ in monocytes and DCs between IPF and controls. S100A8, S100A12 and CTSD are increased in IPF while a composite score of HLA class II transcripts is decreased. C. Violin plots depicting increased expression of the platelet-specific PPBP gene in monocyte clusters of IPF vs. controls. D. UMAP of PPBP expression in PBMCs, demonstrating increased expression in a subset of monocytes, potentially attributable to higher platelet-monocyte complexes (PMCs) formation in IPF. Abbreviations: DC dendritic cells, NK natural killer, PMCs platelet-monocyte complexes.
Figure 4:
Figure 4:. Gene expression changes in stable vs progressive IPF, and the increased Tregs in blood and lung in progressive disease.
A. Heatmap showing the top differentially expressed genes (log2FC > 0.3, adjusted P values < 0.05) for each major cell type, comparing stable and progressive IPF patients. The upper part of the heatmap enumerates genes that are increased in progressive compared to stable IPF (marked “increased in progressive”), while the lower part lists genes increased in stable IPF. Each row is a gene, each column is a patient. Note the color codes for IPF severity on top and cell type on the right. B. Expression of IL1B in monocytes of all subjects. On average, IL1B expression is higher in stable compared to progressive patients. C. Box plot showing an increased level of Tregs (presented as % of all T cells) in progressive IPF subjects. Each dot represents an individual subject. D. Flow cytometry validation in an independent cohort of IPF patients, demonstrating an increase in Tregs in progressive IPF (P=0.039). E. Kaplan-Meier survival curves in IPF patients, showing a clear split of the curves based on the scRNA-seq levels of Tregs (cutoff for high Tregs [as % of T cells] >5%, P=0.009). F. Same as D but split according to the scRNA-seq levels of all monocytes (cutoff for high monocytes >39% of all PBMCs, P=0.046). G. Tregs are increased in progressive IPF/ILD in two lung scRNA-seq datasets by Adams et al (18) and Habermann et al (17), following the removal of outliers. Abbreviations: DC dendritic cells, ILD interstitial lung disease, IPF idiopathic pulmonary fibrosis, NK natural killer cells. * p<0.05, ** p<0.01.
Figure 5:
Figure 5:. Potential chemoattractants of monocytes and Tregs in IPF and a proposed lung-blood recruitment model.
A. Expression of the monocyte chemokine receptor CCR2, and of the Treg chemokine receptors CCR4 & CCR8 in IPF PBMCs. Note that CCR4 & CCR8 are also expressed in memory CD4 T cells, especially Th2 cells (see Supplementary Figure E8), and that non-classical monocytes lack the expression of CCR2. B. Chemokine ligands (CCL7, CCL22, CCL18) of the above respective chemokine receptors (CCR2, CCR4, CCR8) that were increased in plasma of IPF patients (N=12 stable, and 11 progressive) compared to controls (N=9). Black bars indicate the mean values. These chemokines are potential candidates that may be involved in chemoattraction of classical monocytes and Tregs from the blood into the IPF lung. Supplementary Figure E9 contains levels of other cytokines and chemokines measured in plasma and lung tissue homogenates. C. Proposed integrative lung-blood recruitment model in IPF. The left part of the figure depicts Tregs and classical monocytes in the peripheral blood, while the right part is dedicated to lung cells. Lung macrophages (Mφ) and myofibroblasts (MF) secrete CCL7 (and potentially CCL13) into the blood, which stimulate CCR2-mediated recruitment of classical monocytes. These monocytes migrate to the IPF lung (black arrow) and are thought to be precursors of lung macrophages. Lung macrophages and dendritic cells (DC) secrete CCL18 and CCL22, respectively. These chemokines may drive CCR8 and CCR4-mediated recruitment of Tregs and Th2 cells, which may migrate to the fibrotic niche and induce a pro-fibrotic secretory profile in macrophages. Figure 5C was created with BioRender.com. * p<0.05, ** p<0.01.
Figure 6:
Figure 6:. Cellular origin of the outcome-predictive 52-gene signature.
Dot plot showing the cellular origin of the 52-gene signature in our scRNA-seq cohort. Each row represents a binned cell type, while each column represents a gene. Dot size indicates the percentage of cells expressing a gene, while its color intensity represents the average expression. Fifty of the 52 genes were detected in our dataset. The 7 increased genes that correlate with shorter TFS (green) were mainly of monocyte origin, while the 43 decreased genes (red) originated mainly from T, B and NK cells. Abbreviations: NK natural killer, TFS transplant-free survival.

References

    1. Raghu G, Remy-Jardin M, Richeldi L, Thomson CC, Inoue Y, Johkoh T, Kreuter M, Lynch DA, Maher TM, Martinez FJ, Molina-Molina M, Myers JL, Nicholson AG, Ryerson CJ, Strek ME, Troy LK, Wijsenbeek M, Mammen MJ, Hossain T, Bissell BD, Herman DD, Hon SM, Kheir F, Khor YH, Macrea M, Antoniou KM, Bouros D, Buendia-Roldan I, Caro F, Crestani B, Ho L, Morisset J, Olson AL, Podolanczuk A, Poletti V, Selman M, Ewing T, Jones S, Knight SL, Ghazipura M, Wilson KC. Idiopathic Pulmonary Fibrosis (an Update) and Progressive Pulmonary Fibrosis in Adults: An Official ATS/ERS/JRS/ALAT Clinical Practice Guideline. Am J Respir Crit Care Med 2022; 205: e18–e47. - PMC - PubMed
    1. Desai O, Winkler J, Minasyan M, Herzog EL. The Role of Immune and Inflammatory Cells in Idiopathic Pulmonary Fibrosis. Front Med (Lausanne) 2018; 5: 43. - PMC - PubMed
    1. Kolahian S, Fernandez IE, Eickelberg O, Haiti D. Immune Mechanisms in Pulmonary Fibrosis. Am J Respir Cell Mol Biol 2016; 55: 309–322. - PubMed
    1. van Geffen C, Deissler A, Quante M, Renz H, Hartl D, Kolahian S. Regulatory Immune Cells in Idiopathic Pulmonary Fibrosis: Friends or Foes? Front Immunol 2021; 12: 663203. - PMC - PubMed
    1. Idiopathic Pulmonary Fibrosis Clinical Research Network N, Raghu G, Anstrom KJ, King TE Jr., Lasky JA, Martinez FJ. Prednisone, azathioprine, and N-acetylcysteine for pulmonary fibrosis. N Engl J Med 2012; 366: 1968–1977. - PMC - PubMed

Publication types