

This is a preprint.
It has not yet been peer reviewed by a journal.
The National Library of Medicine is
running a pilot
to include preprints that result from research funded by NIH in PMC and PubMed.
[Preprint]. 2023 Jul 20:2023.04.21.537877.
doi: 10.1101/2023.04.21.537877.
CoSIA: an R Bioconductor package for CrOss Species Investigation and Analysis
Affiliations
- PMID: 37163017
- PMCID: PMC10168259
- DOI: 10.1101/2023.04.21.537877
Item in Clipboard
CoSIA: an R Bioconductor package for CrOss Species Investigation and Analysis
bioRxiv.
.
Update in
-
CoSIA: an R Bioconductor package for CrOss Species Investigation and Analysis.Bioinformatics. 2023 Dec 1;39(12):btad759. doi: 10.1093/bioinformatics/btad759. Bioinformatics. 2023. PMID: 38109675 Free PMC article.
Abstract
High throughput sequencing technologies have enabled cross-species comparative transcriptomic studies; however, there are numerous challenges for these studies due to biological and technical factors. We developed CoSIA (Cross-Species Investigation and Analysis), an Bioconductor R package and Shiny app that provides an alternative framework for cross-species transcriptomic comparison of non-diseased wild-type RNA sequencing gene expression data from Bgee across tissues and species (human, mouse, rat, zebrafish, fly, and nematode) through visualization of variability, diversity, and specificity metrics.
Figures
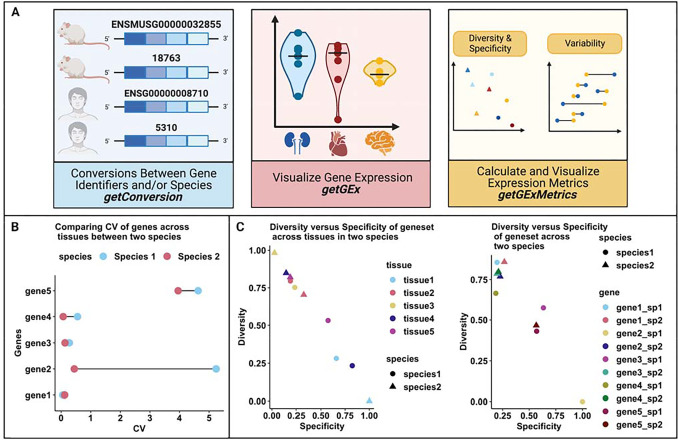
(A) The CoSIA R package workflow. (B) The coefficient of variation cross-species comparison analysis depicts a lollipop plot of example data used to show median-based CV gene comparison across species. This example highlights genes with high variability (gene5), low variability (gene4, gene3, and gene1), and species-specific variability (gene2) in expression across tissues. (C) The diversity and specificity cross-species comparison analysis depicts scatter plots of example data (Supplemental file: Table 2) showing diversity and specificity metric for tissues and genes. This example highlights the differences in diversity and specificity across tissues (tissue1 and tissue3 in species2), and the similarities in diversity and specificity across species (gene1, gene2, gene3, gene4 in species2). Figure was created with BioRender.com .
References
Publication types
Grants and funding
LinkOut - more resources
Full Text Sources