[Preprint]. 2023 Apr 27:rs.3.rs-2700789.
doi: 10.21203/rs.3.rs-2700789/v1.

The release of inhibition model reproduces kinetics and plasticity of neurotransmitter release in central synapses

Affiliations

The release of inhibition model reproduces kinetics and plasticity of neurotransmitter release in central synapses

Christopher A Norman et al. Res Sq. .

Update in

Abstract

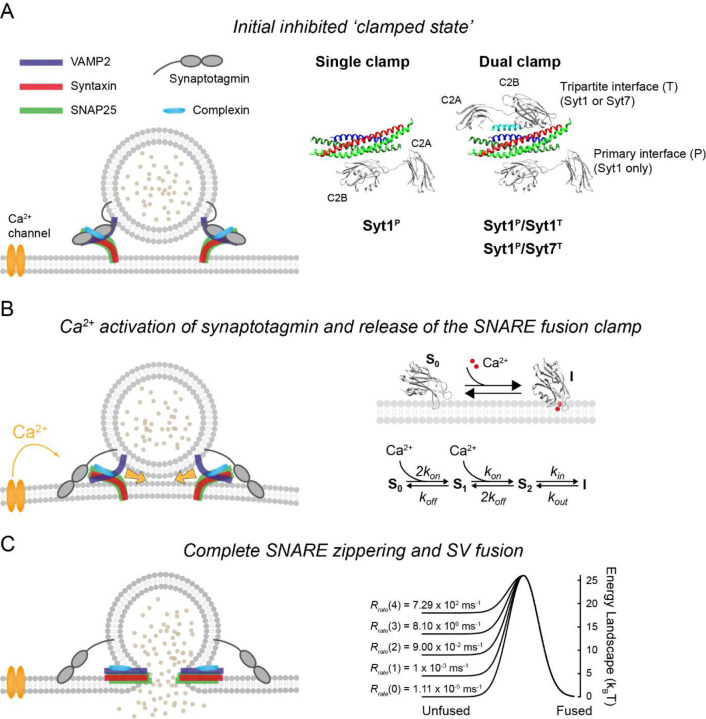
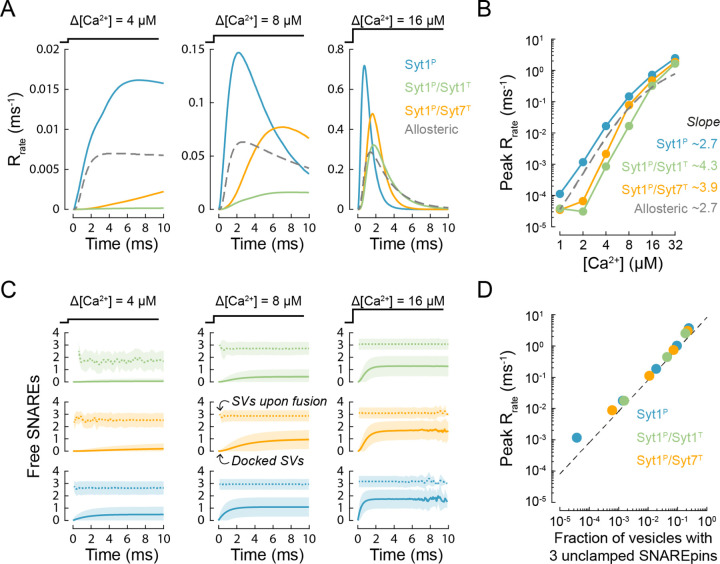
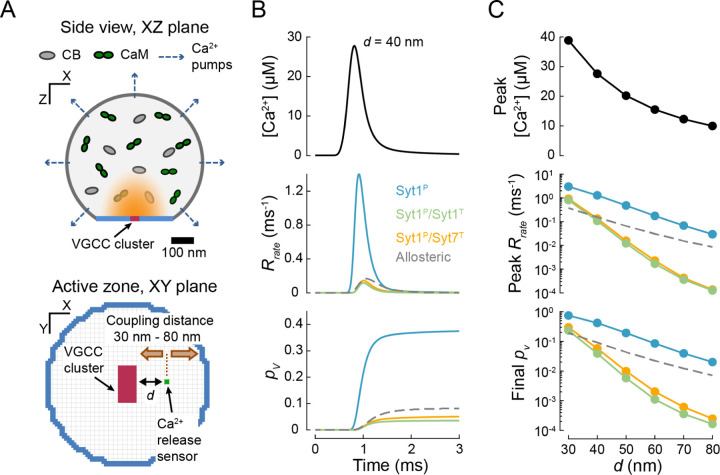
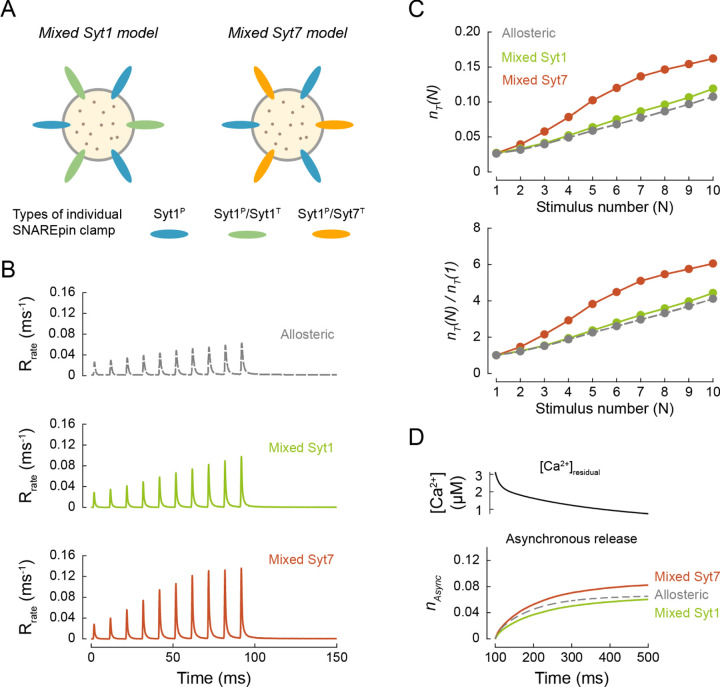
Calcium-evoked release of neurotransmitters from synaptic vesicles (SVs) is catalysed by SNARE proteins. The predominant view is that, at rest, complete assembly of SNARE complexes is inhibited ('clamped') by synaptotagmin and complexin molecules. Calcium binding by synaptotagmins releases this fusion clamp and triggers fast SV exocytosis. However, this model has not been quantitatively tested over physiological timescales. Here we describe an experimentally constrained computational modelling framework to quantitatively assess how the molecular architecture of the fusion clamp affects SV exocytosis. Our results argue that the "release-of-inhibition" model can indeed account for fast calcium-activated SV fusion, and that dual binding of synaptotagmin-1 and synaptotagmin-7 to the same SNARE complex enables synergistic regulation of the kinetics and plasticity of neurotransmitter release. The developed framework provides a powerful and adaptable tool to link the molecular biochemistry of presynaptic proteins to physiological data and efficiently test the plausibility of calcium-activated neurotransmitter release models.


Conflict of interest statement

Competing interests The authors declare no competing interests.

Figures

Figure 1.
Figure 1.. Computational implementation of the release of inhibition model
(A). At rest, the full zippering of SNAREs on RRP vesicles is inhibited (‘clamped’) by binding of synaptotagmin and complexin molecules. Based on structural data, three synaptotagmin/SNARE clamp architectures were considered in the model (right). In all cases Syt1 occupies the primary interface. The tripartite interface is either unoccupied (single clamp, Syt1P) or occupied (dual clamp) by Syt1 (Syt1P/Syt1T) or Syt7 (Syt1P/Syt7T). Crystal structure (PDB ID: 5W5C) . (B) The binding of two Ca2+ ions to a synaptotagmin C2 domain leads to its subsequent membrane insertion (described by the reaction scheme on the right) and release of its SNARE fusion clamp allowing full zippering of SNAREs which provides energy for membrane fusion. (C) The fusion rate is determined by the number of free SNARE complexes that reduce the effective membrane fusion energy barrier, illustrated here as a Gaussian landscape (right). Each SNAREpin was assumed to independently contribute to the lowering of the membrane fusion barrier which is spontaneously overcome at a rate given by the Arrhenius equation (see Methods). Note that only two out of six SNARE complexes are shown in the cartoons on the left that represent a vertical cross-section of the SV.
Figure 2.
Figure 2.. Release of inhibition model describes the kinetics of vesicular release in the calyx of Held.
(A) Time-course of vesicular release rate simulated in response to 4 µM, 8 µM, and 16 µM [Ca2+] steps for the single and dual synaptotagmin/SNARE clamp architectures considered in the model (solid coloured traces) and for the benchmark allosteric model (dashed grey trace) that describes the vesicular release kinetics recorded in the calyx of Held . (B) Dependency of the peak release rate (achieved within 10 ms) on the amplitude of the [Ca2+] step. The numbers indicate the slopes corresponding to the exponent of the power relationship between peak vesicular release rate and [Ca2+] in the range of 4 – 16 µM. (C) Time evolution of the mean number of unclamped SNAREpins (‘Free SNAREs’) on all docked SVs (solid lines), and on SVs at the instance of fusion (dotted lines) in response to [Ca2+] step. Shaded areas indicate 1 standard deviation each side of the mean. Each time point includes data from a 0.25 ms bin. The colour code is the same as in (A). (D) The relationship between peak release rate and the fraction of SVs that have 3 unclamped SNARE complexes at the instance of fusion. The dotted line represents an asymptote for the case when fusion may only occur for vesicles that have exactly 3 unclamped SNARE complexes (i.e. the product of the fraction of vesicles with 3 unclamped SNAREs and the Arrhenius rate Rrate (3) = 8.1 ms−1 as in Figure 1C). Data points represent mean values taken over a 0.25 ms bin centred on the time of peak release rate. For each [Ca2+] step and fusion clamp architecture at least N = 500,000 stochastic simulations were performed with at least 2,000 vesicular fusion events recorded during the first 10 ms time window. This restricted the normalised root mean squared error in stochastic estimates of the kinetics of SV fusion to less than 1% (See Supplementary Figure 3).
Figure 3.
Figure 3.. The release of inhibition model recapitulates synchronous release in response to AP-evoked [Ca2+] transients in the presynaptic active zone.
(A) A cartoon illustrating the model of AP-evoked presynaptic Ca2+ dynamics. The presynaptic terminal was modelled as a truncated sphere with a diameter of 0.6 μm with a single AZ containing a 40 nm x 80 nm rectangular cluster of VGCCs. Intraterminal Ca2+ dynamics were subject to diffusion, buffering (by calbindin, CB; calmodulin, CaM; and ATP) and extrusion via ion pumps. Illustrations of the volume cross-section (upper) and the AZ plane (lower) are adapted from our previous work . (B) Time course of AP-evoked [Ca2+](t) at an AZ point 40 nm from the VGCC cluster (top) and the corresponding vesicular release rates (middle) and the cumulative vesicular release probability, pv (bottom) for the three clamp architectures (solid coloured lines) and the benchmark allosteric model (dashed grey line). (C) Dependences of peak [Ca2+] (top), peak vesicular release rate (middle) and ‘final’ pv calculated 2 ms after an AP (bottom) on the coupling distance d between the docked vesicle and the VGCC cluster. Colour codes as in (B). Data points represent mean values. For each [Ca2+](t) transient and fusion clamp architecture at least N = 500,000 stochastic simulations were performed with at least 2,000 vesicular fusion events recorded during the first 3 ms time window.
Figure 4.
Figure 4.. The release of inhibition model reproduces Syt7-dependent short-term facilitation
(A) Modelling of vesicular release in response to paired-pulse stimulation. Left, VCell computed Ca2+ dynamics at a vesicular release site located at d = 40 nm from the VGCC cluster (see Figure 3A) in response to a pair of APs separated by 20 ms (ISI, interstimulus interval). Time course of the corresponding vesicular release rates (middle) and the cumulative vesicular release probability (pv) (right) for the three fusion clamp architectures (solid coloured lines) and the benchmark allosteric model (dashed grey line). (B, C) Dependency of the paired-pulse ratio (PPR = pv (2) / pv (1), where pv (1) and pv (2) are the vesicular release probabilities at the 1st and the 2nd AP respectively), on the coupling distance (B) and the interstimulus interval (C) for different clamp architectures. Note that facilitation of vesicular release was only observed when Syt7 was present (Syt1P/Syt7T). Colour codes as in (A). (D) Probability that the tripartite interface remains unoccupied (Pfree tripartite) at the time of arrival of the 2nd AP. Due to the faster membrane dissociation rate of Syt1 (kout = 0.67 ms−1), the model predicts restoration of the Syt1 clamp within 10 ms after the 1st AP. In contrast, Syt7 exhibits slower membrane dissociation (kout = 0.02 ms−1) which leads to a delayed restoration of the fusion clamp and results in the facilitation of vesicular release at the 2nd AP. Colour codes as in (A). Data points represent mean values. For each [Ca2+](t) transient and fusion clamp architecture at least N = 500,000 stochastic simulations were performed with at least 2,000 vesicular fusion events recorded during the first for each AP.
Figure 5.
Figure 5.. Modelling vesicular release for single and dual clamp models in response to bursts of action potentials in MFB terminals.
(A) Top, VCell computed [Ca2+](t) transient approximating Ca2+ dynamics at vesicular release sites in MFB terminals in response to 10 × 100 Hz AP train (see ref.). Bottom, time course of corresponding vesicular release rates for the benchmark allosteric model and the three fusion clamp architectures. (B) Top, expected numbers of vesicles exocytosed at a single release site, nT (N), for each AP of the train, N. Bottom, paired-pulse ratio: release efficacy at each AP normalised to release efficacy at the first AP, nT (N) / nT (1). (C) Top, residual [Ca2+]residual after the 10 × 100 Hz AP train, corresponding to the dashed box in (A). Bottom, corresponding cumulative asynchronous releases per release site, nAsync, for the three fusion clamp architectures and the benchmark allosteric model. Data points represent mean values. For each [Ca2+](t) transient and fusion clamp architecture at least N = 100,000 stochastic simulations were performed with at least 6,000 vesicular fusion events recorded during the AP train.
Figure 6.
Figure 6.. Mixed single and dual clamp model can describe the kinetics and plasticity of release in MFBs.
(A) We considered two partial dual clamp models where on average 3 out of 6 SNAREpins had a single Syt1P clamp, and the other 3 had dual Syt1P/Syt1T or Syt1P/Syt7T clamps. (B) Time course of vesicular release rates for the benchmark allosteric model and the Mixed Syt1 and Mixed Syt7 models in response to the same [Ca2+](t) transient as in Figure 5A. (C) Top, expected numbers of vesicles exocytosed at a single release site, nT (N), for each AP of the train, N. Bottom, paired-pulse ratio: release efficacy at each AP normalised to release efficacy at the first AP, nT (N) / nT (1). (D) Top, residual [Ca2+]residual after the 10 × 100 Hz AP train, corresponding to the dashed box in Figure 5A. Bottom, corresponding cumulative asynchronous releases per release site, nAsync, for the two mixed clamp architectures and the benchmark allosteric model. Data points represent mean values. For each [Ca2+](t) transient and fusion clamp architecture at least N = 150,000 stochastic simulations were performed with at least 100,000 vesicular fusion events recorded during the AP train.

References

    1. Sollner T. et al. SNAP receptors implicated in vesicle targeting and fusion. Nature 362, 318–324 (1993). - PubMed
    1. Weber T. et al. SNAREpins: minimal machinery for membrane fusion. Cell 92, 759–772 (1998). - PubMed
    1. Sudhof T.C. Neurotransmitter release: the last millisecond in the life of a synaptic vesicle. Neuron. 80, 675–690 (2013). - PMC - PubMed
    1. Sudhof T.C. & Rothman J.E. Membrane fusion: grappling with SNARE and SM proteins. Science. 323, 474–477 (2009). - PMC - PubMed
    1. Kaeser P.S. & Regehr W.G. Molecular mechanisms for synchronous, asynchronous, and spontaneous neurotransmitter release. Annu. Rev. Physiol. 76:333–63. doi: 10.1146/annurev-physiol-021113-170338. Epub@2013 Nov 21., 333–363 (2014). - DOI - PMC - PubMed

Publication types

LinkOut - more resources