[Preprint]. 2023 Apr 27:rs.3.rs-2862719.
doi: 10.21203/rs.3.rs-2862719/v1.

Chronic viral infection compromises the quality of circulating mucosal-invariant T cells and follicular T helper cells via expression of both activating and inhibitory receptors

Affiliations

Chronic viral infection compromises the quality of circulating mucosal-invariant T cells and follicular T helper cells via expression of both activating and inhibitory receptors

Jaisheela Vimali et al. Res Sq. .

Update in

Abstract

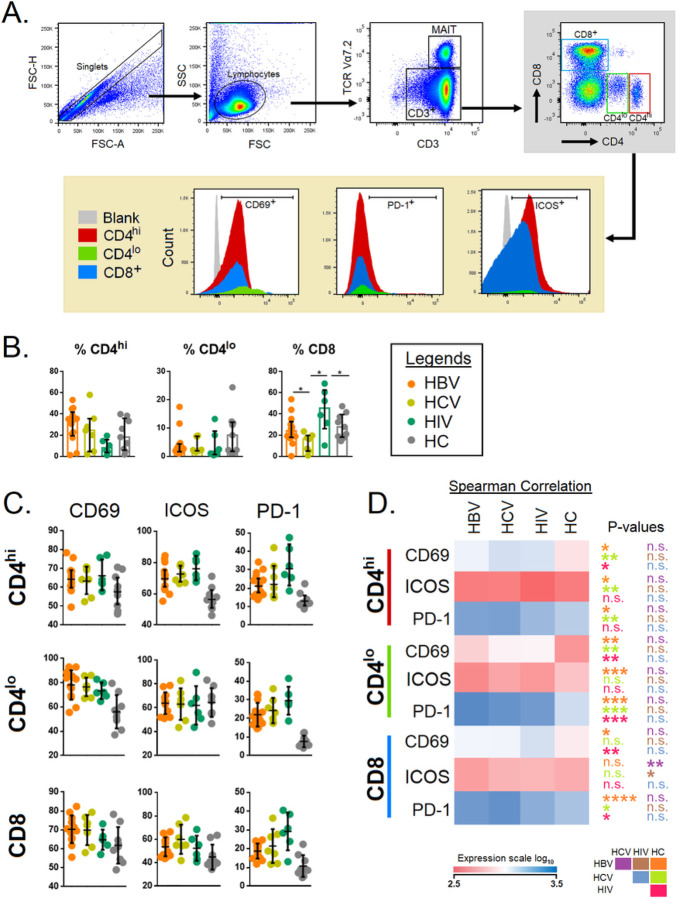
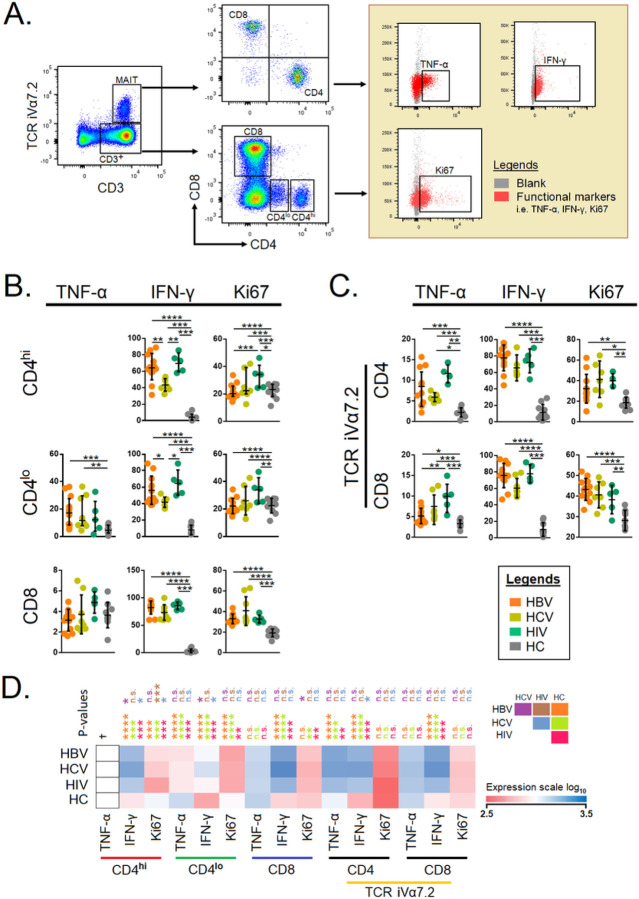
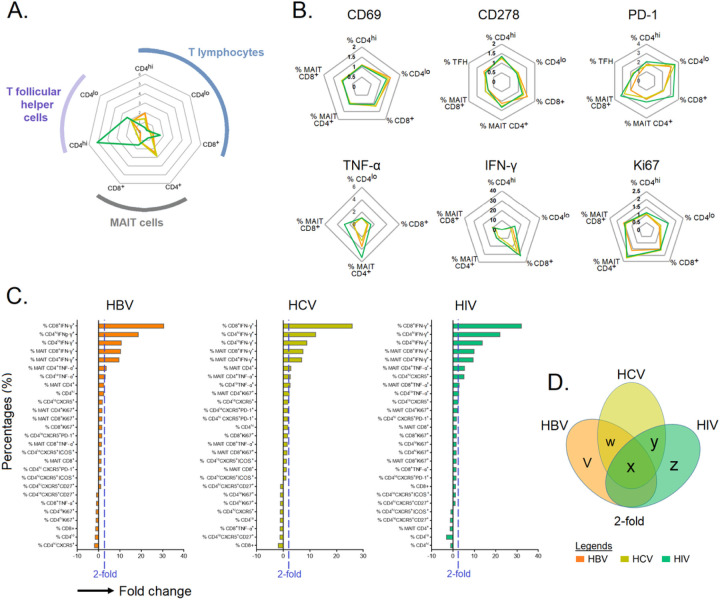
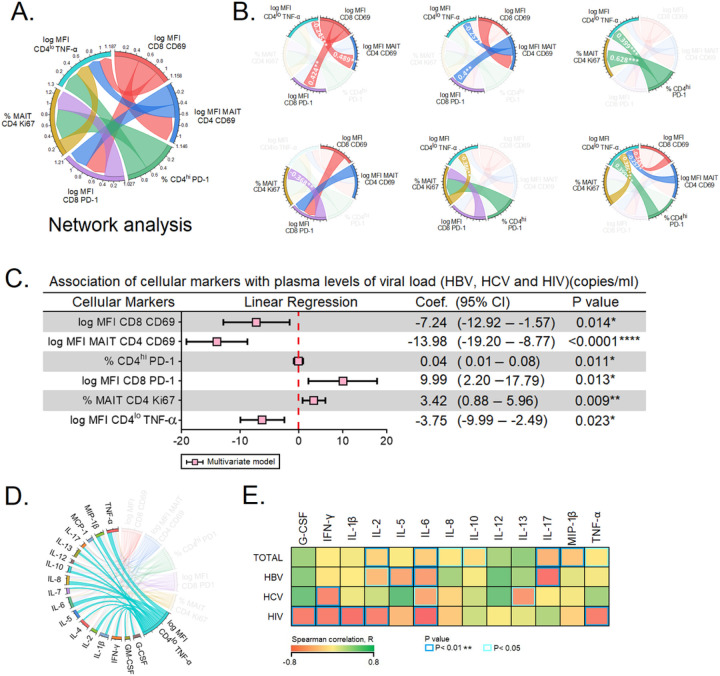
Chronic viral infection results in impaired immune responses rendering viral persistence. Here, we investigated the role of immune activation and compared the quality of T-cell responses in chronic HBV, HCV, and HIV infections. Cytokines were measured using a commercial Bio-plex Pro Human Cytokine Grp I Panel 17-plex kit (BioRad, Hercules, CA, USA). Inflammation was assessed by measuring an array of plasma cytokines, and peripheral CD4+ T cells including circulating Tfh cells, CD8+ T cells, and TCR iVα7.2+ MAIT cells in chronic HBV, HCV, and HIV-infected patients and healthy controls. The cells were characterized based markers pertaining to immune activation (CD69, ICOS, and CD27) proliferation (Ki67), cytokine production (TNF-α, IFN-γ) and exhaustion (PD-1). The cytokine levels and T cell phenotypes together with cell markers were correlated with surrogate markers of disease progression. The activation marker CD69 was significantly increased in CD4+ hi T cells, while CD8+ MAIT cells expressing IFN-γ were significantly increased in chronic HBV, HCV and HIV infections. Six cell phenotypes, viz., TNF-α+CD4+ lo T cells, CD69+CD8+ T cells, CD69+CD4+ MAIT cells, PD-1+CD4+ hi T cells, PD-1+CD8+ T cells, Ki67+CD4+ MAIT cells were independently associated with decelerating the plasma viral load (PVL). TNF-α levels showed a positive correlation with increase in cytokine levels and decrease in PVL. Chronic viral infection negatively impacts the quality of peripheral MAIT cells and TFH cells via expression of both activating and inhibitory receptors.

Keywords: HBV; HIV; MAIT cells; PD-1; T cell exhaustion.


Conflict of interest statement

Declarations Disclosure statement The authors declare that the research was conducted in the absence of any commercial or financial relationships that could be construed as a potential conflict of interest.

Figures

Figure 1
Figure 1
A) Gating strategy for CD69, ICOS and PD-1 expression on peripheral CD4+hi, CD4lo, and CD8+ T cell populations. Lymphocytes were gated from whole human PBMCs using height and area of forward scatter, then singlet gates were utilized to remove doublet populations. This was followed by lymphocyte gating using forward and side scatters areas. This was followed by a total CD3+ cell gate against TCR iVα7.2. From CD3+ cells, total CD8+ cells CD4+hi, and CD4+lo were gated out. From this CD8+, CD4+hi, and CD4+lo we determined CD69+, PD-1 and ICOS. B) The results of these gates are three T cell populations: CD8+, CD4+hi, and, CD4+lo. Comparison of the levels of, CD4+lo, CD4+hi and CD8+ among patients chronically infected with HBV, HCV, HIV, and HCs. C) CD69, PD-1 and ICOS expression was determined by using a CD69, PD-1, and ICOS mean fluorescence intensity (MFI), respectively, which was used as a negative control for CD69, PD-1, and ICOS staining and allowed for accurate gating on the positive populations only. D) Expression (MFI) of CD69, ICOS, and PD-1 in CD4+hi, CD4lo and CD8+ T cells among patients chronically-infected with HBV, HCV, HIV and HCs. The level of expression of each marker was reflected by the color scale of the heatmap. The cells were compared across the four groups by the Kruskal–Wallis test. Post-hoc Mann–Whitney U tests were subsequently performed only for those biomarkers with a Kruskal–Wallis test P value of <0.05. P<0.05 are considered significant; *P<0.05, **P<0.01, ***P<0.001, ****P<0.0001.
Figure 2
Figure 2
A) Gating strategies for mucosal-associated invariant T cells and follicular T helper cells. Total CD3+ cells were gated against TCR iVα7.2 (MAIT cells). From MAIT cells CD8+ and CD4+ T cell populations were gated. From CD3+ cells, CD4+ cells were gated against CXCR5. The different gates were determined: TCR iVα7.2, CD4+ TCR iVα7.2, CD8+ TCR iVα7.2, CD4+ CXCR5. B) Comparison of the levels of TCR iVα7.2, CD4+ TCR iVα7.2, CD8+ TCR iVα7.2 among individuals chronically infected with HBV, HCV, HIV, and HCs.C) Comparison of the levels of TFH among patients chronically infected with HBV, HCV, HIV, and HCs. D) Percentage level of CD4+ TCR iVα7.2, CD8+ TCR iVα7.2 were compared with CD69, ICOS expression and PD-1. E) Expression (mean fluorescence intensity, MFI) of CD69, ICOS, and PD-1 in CD4+ TCR iVα7.2, CD8+ TCR iVα7.2 with among individual chronically infected with HBV, HCV, HIV, and HCs. F) Percentage levels of TFH were compared with CD27, PD-1, and ICOS expression. G) The expression scale for MFI of CD27, ICOS and PD-1 in CD4+ TCR iVα7.2, CD8+ TCR iVα7.2 among individual chronically infected with HBV, HCV, HIV, and HCs. The level of expression of each marker was reflected by the color scale of the heatmap. The cells were compared across the four groups by the Kruskal–Wallis test. Post-hoc Mann–Whitney U tests were subsequently performed only for those biomarkers with a Kruskal–Wallis test P value <0.05. P<0.05 are considered significant; *P<0.05, **P<0.01, ***P<0.001, ****P<0.0001.
Figure 3
Figure 3
A) Gating strategies of intercellular cytokines in conventional and unconventional T cells. Total CD3+ cells were gated against TCR iVα7.2 (MAIT cells). From MAIT cells CD8+ and CD4+ T cell populations were gated whereas CD3+ was gated as CD4+hi, CD4+lo, and CD8+ T cells. The functional markers of different gates were determined: CD4+ TCR iVα7.2, CD8+ TCR iVα7.2, CD4+, and CD8+ cells B) Comparison of the levels of TNF-α, IFN-γ, and Ki67 in CD4+hi, CD4+lo and CD8+ T cells among individuals chronically-infected with HBV, HCV, HIV, and HCs. C) Comparison of the levels of CD4+ MAIT cells, and CD8+ MAIT cells among patients chronically-infected with HBV, HCV, HIV, and HCs. D) The level of expression of TNF-α, IFN-γ, Ki67 with CD4+hi, CD4+lo, CD8+, CD4+ TCR iVα7.2, CD8+ TCR iVα7.2. The level of expression for each marker was reflected by the color scale of the heatmap. The cells were compared across the four groups by the Kruskal–Wallis test. Post-hoc Mann–Whitney U tests were subsequently performed only for those with a Kruskal–Wallis test P value of <0.05. P<0.05 are considered significant; *P<0.05, **P<0.01, ***P<0.001, ****P<0.0001. †, TNF-α did not express in the CD4hi population.
Figure 4
Figure 4
Immune cell profiling in chronic HBV-, HCV-, and HIV-infected individuals. A-B) The fold change in immune cells with identified intracellular and extracellular markers in individuals chronically infected with HBV, HCV and HIV normalized against HCs. C) Bar plot depicting mean 2-fold change among identified markers in specific immune cell type. D) Venn diagram showing immune cells that are upregulated >2-fold. The Venn diagram identified a profile of seven immune cell populations that are commonly expressed among chronically HBV-, HCV-, and HIV-infected individuals. Footnotes: v. %CD4hi; w. %MAIT CD4+; x. %CD4lo TNF-α+, %MAIT CD4+ TNF-α+, %MAIT CD4+ IFN-γ+, %MAIT CD8+ IFN-γ+, %CD4hi IFN-γ+, %CD4lo IFN-γ+, CD8+ IFN-γ+; y. %MAIT CD4+ Ki67+, %CD4lo CXCR5+; z. %CD4hi CXCR5+, %MAIT CD8+ TNF-α+
Figure 5
Figure 5
Predictors of plasma viral load. A-B) Network analysis of the six predictors of plasma viral load. Panel A depicts the complexity of the interactions between the six predictors. B) Spearman correlation between the six predictors of plasma viral load. C) The six markers were subjected to multivariate linear regression analysis to determine the markers that independently predict the plasma viral load. D) Expression of TNF-α and their association with plasma cytokines. E) Plasma level of cytokines associated with plasma viral load. Variables with P values <0.05 were considered independent predictors in their respective models. *, **, **** represent P<0.05, <0.01, and <0.0001, respectively.

References

    1. Vella LA, Herati RS, Wherry EJ. CD4+ T Cell Differentiation in Chronic Viral Infections: The Tfh Perspective. Trends Mol Med. 2017;23(12):1072–1087. - PMC - PubMed
    1. Boldogh I, Albrecht T, Porter DD. Persistent Viral Infections. In: Baron S, editor. Medical Microbiology. 4th edition. Galveston (TX): University of Texas Medical Branch at Galveston; 1996. Chapter 46. Available from: www.ncbi.nlm.nih.gov/books/NBK8538/ - PubMed
    1. Wherry EJ, Kurachi M. Molecular and cellular insights into T cell exhaustion. Nat Rev Immunol. 2015;15(8):486–499. - PMC - PubMed
    1. Mysore KR, Leung DH. Hepatitis B and C. Clin Liver Dis. 2018;22(4):703–722. - PubMed
    1. Chisari FV, Isogawa M, Wieland SF. Pathogenesis of hepatitis B virus infection. Pathol Biol (Paris). 2010;58(4):258–266. - PMC - PubMed

Publication types