[Preprint]. 2024 Aug 13:2023.04.28.538770.
doi: 10.1101/2023.04.28.538770.

A transposase-derived gene required for human brain development

Affiliations

A transposase-derived gene required for human brain development

Luz Jubierre Zapater et al. bioRxiv. .

Abstract

DNA transposable elements and transposase-derived genes are present in most living organisms, including vertebrates, but their function is largely unknown. PiggyBac Transposable Element Derived 5 (PGBD5) is an evolutionarily conserved vertebrate DNA transposase-derived gene with retained nuclease activity in human cells. Vertebrate brain development is known to be associated with prominent neuronal cell death and DNA breaks, but their causes and functions are not well understood. Here, we show that PGBD5 contributes to normal brain development in mice and humans, where its deficiency causes disorder of intellectual disability, movement, and seizures. In mice, Pgbd5 is required for the developmental induction of post-mitotic DNA breaks and recurrent somatic genome rearrangements. In the brain cortex, loss of Pgbd5 leads to aberrant differentiation and gene expression of distinct neuronal populations, including specific types of glutamatergic neurons, which explains the features of PGBD5 deficiency in humans. Thus, PGBD5 might be a transposase-derived enzyme required for brain development in mammals.


Conflict of interest statement

Competing interests: Authors declare that they have no competing interests. AK is a consultant for Novartis, Rgenta, Blueprint, and Syndax. RR is a founder and a member of the SAB of Genotwin, and a member of the SAB of Diatech Pharmacogenetics. None of these activities are related to the work described in this manuscript.

Figures

Fig. 1.
Fig. 1.. PGBD5 is specifically expressed in neuronal tissues and its deficiency in humans is associated with abnormal brain development.
(A-B) Bar graphs showing specific neuronal tissue expression of PGBD5 in human (A) and mouse (B) tissues. Color gradient from red to white indicates gene expression in transcripts per million reads (TPM). (C) Schematic of the primary structure of PGBD5 with observed genetic variants, most of which appear to be loss-of-function upstream of the evolutionarily conserved DDE_Tnp_1_7 transposase domain (red box). D, Comparison of volumes of different brain structures between 4 PGBD5 patients and age/sex matched controls. Dashed red line indicates 2 standard deviations from controls. E-I, Sagittal MRI brain images demonstrating thin corpus callosum (thick blue arrow) in patients 2 years and older and decreased cerebellar size (thin yellow arrow) in patients 6 years and older. E, Patient 1.1 (10 years) with progressive cerebellar atrophy determined after repeat imaging as compared to 4 years of age, F, Patient 1.2 (2 years) with CC thinning present, G, Patient 2.1 (15 years) with marked cerebellar atrophy, H, Patient 5.1 (3 years) with some thinning of CC, I, Patient 5.2 (21 months) with cerebellar atrophy. J, Phenogram summarizing frequency of conserved features in neurodevelopmental, motor, and congenital anomaly domains. Frequency calculated using patients with data provided, excluding N/A from denominator. ID/DD=intellectual disability/developmental delay, ASD=autism spectrum disorder.
Fig. 2.
Fig. 2.. Pgbd5 knock-out and knock-in mice reproduce behavioral and brain developmental deficits associated with human PGBD5 mutation.
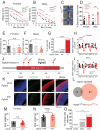
A-B, Whisker plot analysis of the distance traveled in locomotor assays of 12-week old female (A) and male (B) Pgbd5wt/wt (black), Pgbd5wt/- (grey), and Pgbd5−/− (red) mice, demonstrating significantly increased activity of Pgbd5-deficient mice (Female and male n=12 and two-way ANOVA p = 5.41E-7 and n=12 and p = 5.47E-5, respectively; post-hoc Tukey test *p<0.05, ** p<0.01, ***p<0.001, ****p<0.0001). C, Representative heatmaps of elevated plus maze assay (color index from dark blue (low) to red (high) indicates time spent in the area), with D, bar plot of the percentage of the distance traveled in the open arm by 12-weeks old Pgbd5wt/wt (black), Pgbd5wt/- (grey), and Pgbd5−/− (red) mice. Pgbd5-deficient mice exhibit a significantly increased propensity to explore the open arms (Two-way ANOVA p = 2.6E-6 for genotype and p = 0.3 for sex; * Tukey test p = 0.019 and **** p = 2.67E-7). E-F, Bar plots of probe day Rotarod fall latency in females (E) and males (F), showing significant reduction by Pgbd5−/− (red) as compared to Pgbd5wt/wt in male mice (** = One-way ANOVA p =9.2E-3, Tukey’s test p = 7.5E-3 in males; n.s= One-way ANOVA p =0.2, Tukey’s test p = 0.76 ** ANOVA. G, Bar plot of seizure activity of Pgbd5−/− versus Pgbd5wt/wt litter mate mice (χ2-test p = 5.8E-7). n indicates number of mice with seizures over the total number of mice assayed. H-I, Box plots of z-scores of brain MRI volumetric measurements of 60-day old Pgbd5−/− as compared to Pgbd5wt/wt mice, showing significant reduction in cortex and ventricle size brain regions in Pgbd5-deficient female (*= Two-way ANOVA p = 9E-4, Cortex Bonferroni-adjusted p=5.7E-3) (H) and male (**= Two-way ANOVA p=0.28, Cortex Bonferroni-adjusted p=1.9E-2) (I) mice. J, Pgbd5 primary protein sequence schematic indicating the location of conserved aspartate triad and in red, the exon 2 D236A (ki) substitution. ENSMUST00000140012.8 Pgbd5 transposase domain highlighted in red. K, Representative fluorescence in situ hybridization micrographs of coronal sections of heads of 14.5-day old Pgbd5ki/ki as compared to Pgbd5wt/wt litter mate embryos, showing similar expression of Pgbd5 transcripts between Pgbd5wt/wt and Pgbd5ki/ki litter mates. Green staining indicates mouse Pgbd5 RNA, red indicates Tuj1 staining of postmitotic neurons and blue denotes nuclei stained with DAPI. Scale bar = 100 μm. L, Venn diagram of gene variants detected in the whole-genome sequencing of Pgbd5ki/ki 107 and Pgbd5ki/ki73 founder lines. Only the Pgbd5 gene variant was found to be shared between founder lines. M-N, Total body weight of 60-day old Pgbd5wt/wt (black), and Pgbd5ki/ki(red) mice, shows no difference of total weights in females (n.s. p = 0.3) (M) and males (n.s. p = 0.6) (N) mice. O, Bar plot of seizure activity Pgbd5−/− versus Pgbd5ki/ki litter mate mice (χ2-test p = 7.41E-05). n indicates number of mice with seizures over total number of mice assayed; O = open arm, C = closed arm, CB = cerebellum, CT = cortex, HC = hippocampus, OB = olfactory bulb, CC = corpus callosum, VT = ventricles.
Fig. 3.
Fig. 3.. Pgbd5 is required for developmental induction of DNA breaks in postmitotic cortical neurons.
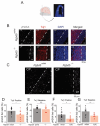
A, Schematic showing representative coronal section of a 14.5-days old embryo mouse forebrain and the regions selected for further quantification. B, Representative immunofluorescence micrographs of Pgbd5wt/wt and Pgbd5−/− 14.5-day old litter mate embryos. DAPI shown in blue stains nuclei, γH2AX in white indicates sites of double-strand DNA break repair, and Tuj1 in red marks differentiated postmitotic neurons; CP = cortical plate, VZ = ventricular zone. C, Enlarged representative γH2AX immunofluorescence micrographs from panel A of Pgbd5wt/wt (left) and Pgbd5−/− (right) 14.5-day old litter mate embryos stained for γH2AX in white. D-G, Quantification of γH2AX in postmitotic (Tuj1 positive) and proliferating neurons (Tuj1 negative) in the Pgbd5wt/wt and Pgbd5ki/ki mice. D-E, Bar plots showing the percentages of cells with punctate γH2AX staining in Tuj1-positive (D) and Tuj1-negative neurons (E) in Pgbd5wt/wt versus Pgbd5−/− mice (t-test *p = 0.029 and n.s. p = 0.6 for % of positive cells). F-G, Bar plots showing the percentages of cells with punctate γH2AX staining in Tuj1-positive (F) and Tuj1-negative neurons (G) in Pgbd5wt/wt versus Pgbd5ki/ki mice (t-test **p = 3.8E-3 and ***p = 2.9E-3 for Tuj1 positive and negative cells, respectively).
Fig. 4.
Fig. 4.. Xrcc5 is required for Pgbd5-induced double-strand DNA break repair.
A, Representative immunofluorescence micrographs of Xrcc5−/−;Pgbd5wt/wt (top) and Xrcc5−/−;Pgbd5−/− (bottom) 14.5-day old litter mate embryos stained for γH2AX. DAPI nuclear staining is shown in blue; γH2AX indicates sites of double-strand break repair (white), and Tuj1 marks postmitotic neurons (red); CP = cortical plate, VZ = ventricular zone. B, Enlarged representative immunofluorescence micrographs of Xrcc5−/−;Pgbd5wt/wt and Xrcc5−/−;Pgbd5−/− 14.5-day old litter mate embryos from panel A. C-D, Quantification of nuclear γH2AX in postmitotic neurons (Tuj1 positive) and proliferating neurons (Tuj1 negative). Bar plots showing percentages of cells with punctate γH2AX staining in Tuj1-positive (C; t-test *p = 2.3E-2, **p = 1E-3, and ***p = 4.1E-2) and Tuj1-negative neurons (D; t-test *p = 0.012 and **p = 1.8E-3, ***p = 0.024 for postmitotic and proliferating neurons, respectively). E, Schematic showing potential genetic interaction models between Pgbd5 and Xrcc5 in cortical neuronal developmental DNA break repair. Arrows denote relative levels of DNA damage.
Fig. 5.
Fig. 5.. Pgbd5 is required for recurrent somatic DNA rearrangements in developing mouse brain.
A, Schematics for somatic whole-genome sequencing analysis of neuronal and non-neuronal tissues from three Pgbd5wt/wt and three Pgbd5−/− adult and embryonal littermate mice. B-D, Dot plots showing numbers of somatic structural variants at different variant junction read thresholds shared across cerebellum, hippocampus, and olfactory bulb brain regions (B) and three individuals (C) in adult and embryonal Pgbd5wt/wt (black circles and grey squares, respectively) and Pgbd5−/− (red circles and light-red squares, respectively). The overlap among structural variants was calculated using the breakpoint analysis (Fig. S26D): 5’ and 3’ DNA breakpoint ± 350bp requiring an overlap of at least 1%. There are significantly more recurrent somatic structural variants in Pgbd5wt/wt with support of at least 5 variant junction reads in the recurrent events shared among three individuals and three brain regions (*χ2-test p = 2.2E-145 and 2.8E-133, respectively). (D) Bar plot summarizing the results from B and C using the support threshold of at least 5 variant junction reads. Significant differences between the number of recurrent somatic DNA rearrangements between adult Pgbd5wt/wt and Pgbd5−/− shared among three individuals and three brain regions (**χ2-test p = 1.6E-17 and 1.3E-9, respectively. E, Mouse chromosome ideograms showing the locations of recurrent somatic DNA rearrangements in three individuals observed in Pgbd5wt/wt (black) and Pgbd5−/− (red) brains; bin = 1 million bases.
Fig. 6.
Fig. 6.. Pgbd5 deficiency alters gene expression in distinct cortical neurons.
A, Schematic of experimental procedures for analysis of combined single-nucleus RNA and ATAC sequencing of brain motor cortices from three Pgbd5wt/wt and three Pgbd5−/− littermate mice. B, Uniform manifold approximation and projection (UMAP) plots of single nuclei gene expression from brain motor cortices of Pgbd5wt/wt and Pgbd5−/− littermates, colored by their classification with respect to the reference atlas of normal mouse brain cortex (left; n = 18,107 and 14,359, respectively). Right UMAP is colored by Pgbd5 expression (normalized white to dark red). C, Cell clusters with greater than 200 nuclei corresponding to cell populations of cortical origin in Pgbd5wt/wt (grey) and Pgbd5−/− (red) mice, excluding ‘Striatal Neurons’ and ‘Other Neurons’. From left to right: proportions of predominant cell type annotations per cluster; proportion of each genotype per cluster; expression (dot color) and detection rate (dot size) of Pgbd5 expression in wildtype cells of each cluster; number of differentially expressed genes (DEG; log2FC > 0.25, adjusted p < 0.05) between the genotypes per cluster. D-G, Differential expression and promoter accessibility analysis in clusters corresponding to Meis2 cluster 9 (D-E) and cortical cluster 5 neurons (F-G). Bubble plots showing changes in gene expression correlated with changes in chromatin accessibility at the corresponding gene promoter regions (+/− 2.5kb from TSS). Only genes with significant changes in expression (adjusted p < 0.05) are plotted in Meis2 cluster 9 (D) and cortical intratelencephalic (IT) neurons (F). Top GO pathways ranked by the number of genes showing adjusted p-values in bubble size for DEGs upregulated in knockout (top) and wildtype (bottom) cells of the corresponding cluster in Meis2 cluster 9 (E) and cortical IT cluster 5 neurons (G).

References

    1. Edelman G. M., Neural Darwinism: selection and reentrant signaling in higher brain function. Neuron 10, 115–125 (1993). - PubMed
    1. Barnes D. E., Stamp G., Rosewell I., Denzel A., Lindahl T., Targeted disruption of the gene encoding DNA ligase IV leads to lethality in embryonic mice. Current biology : CB 8, 1395–1398 (1998). - PubMed
    1. Gao Y., Chaudhuri J., Zhu C., Davidson L., Weaver D. T., Alt F. W., A targeted DNA-PKcs-null mutation reveals DNA-PK-independent functions for KU in V(D)J recombination. Immunity 9, 367–376 (1998). - PubMed
    1. Frank K. M. et al., Late embryonic lethality and impaired V(D)J recombination in mice lacking DNA ligase IV. Nature 396, 173–177 (1998). - PubMed
    1. Sekiguchi J. M. et al., Nonhomologous end-joining proteins are required for V(D)J recombination, normal growth, and neurogenesis. Cold Spring Harb Symp Quant Biol 64, 169–181 (1999). - PubMed

Publication types