[Preprint]. 2023 Apr 28:2023.04.26.538373.
doi: 10.1101/2023.04.26.538373.

Bcl-xL is translocated to the nucleus via CtBP2 to epigenetically promote metastasis

Affiliations

Bcl-xL is translocated to the nucleus via CtBP2 to epigenetically promote metastasis

Tiantian Zhang et al. bioRxiv. .

Update in

Abstract

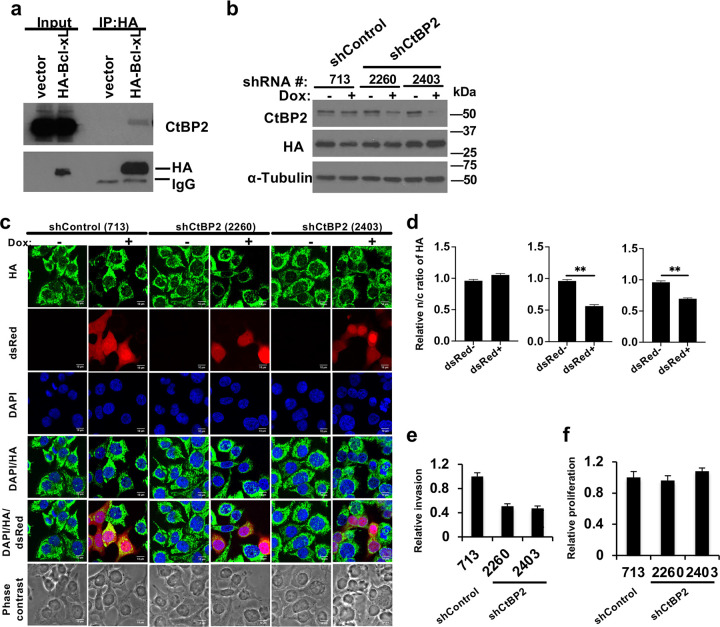
Besides its mitochondria-based anti-apoptotic role, Bcl-xL also travels to the nucleus to promote cancer metastasis by upregulating global histone H3 trimethyl Lys4 (H3K4me3) and TGFβ transcription. How Bcl-xL is translocated into the nucleus and how nuclear Bcl-xL regulates H3K4me3 modification are not understood. Here, we report that C-terminal Binding Protein 2 (CtBP2) binds Bcl-xL via its N-terminus and translocates Bcl-xL into the nucleus. Knockdown of CtBP2 by shRNA decreases the nuclear portion of Bcl-xL and reverses Bcl-xL-induced cell migration and metastasis in mouse models. Furthermore, knockout of CtBP2 suppresses Bcl-xL transcription. The binding between Bcl-xL and CtBP2 is required for their interaction with MLL1, a histone H3K4 methyltransferase. Pharmacologic inhibition of MLL1 enzymatic activity reverses Bcl-xL-induced H3K4me3 and TGFβ mRNA upregulation as well as cell invasion. Moreover, cleavage under targets and release using nuclease (CUT&RUN) coupled with next generation sequencing reveals that H3K4me3 modifications are particularly enriched in the promotor region of genes encoding TGFβ and its signaling pathway in the cancer cells overexpressing Bcl-xL. Altogether, the metastatic function of Bcl-xL is mediated by its interaction with CtBP2 and MLL1.

Keywords: Bcl-xL; CtBP2; MLL1; epigenetic modification; metastasis.


Conflict of interest statement

Competing interests The authors declare no competing financial interests.

Figures

Figure 1.
Figure 1.. Nuclear Bcl-xL is found in human breast cancer specimen.
Confocal microscopy images of Bcl-xL (red), mitochondrial marker MTCO1 (green), and DAPI (blue) from two primary human breast cancer (a and c) and lymph node met (b). Scale bar, 20 μm. Original magnification, × 60.
Figure 2.
Figure 2.. Identification of CtBP2 as a novel Bcl-xL interacting protein.
(a) Whole cell lysates from BON1/TGL cells that stably express HA tagged Bcl-xL or pQCXIP (pQ) vector were used for ReCLIP using anti-HA magnetic beads and Western blotting using CtBP2 and HA anti-bodies. (b) BON1/TGL/pQ and BON1/TGL/HA-Bcl-xL cells expressing dox-inducible shCtBP2 or shRLuc were treated with 1 μg/ml doxycycline (dox) for 96 hours and harvested for Western blot analysis of CtBP2 and HA (for HA-Bcl-xL). α-tubulin was used a loading control. (c) Representative confocal images of BON1/TGL/HA-Bcl-xL/tet-O-dsRed-shRLuc (#713)-PGK-rtTA3, BON1/TGL/HA-Bcl-xL/tet-O-dsRed-shCtBP2 (#2260)-PGK-rtTA3, and BON1/TGL/HA-Bcl-xL/tet-O-dsRed-shCtBP2 (#2403)-PGK-rtTA3 cells that were treated or untreated with 1 μg/ml Dox for 96 hours, fixed, and stained with anti-HA antibody (green) and DAPI (blue). Scale bar, 10 μm. Original magnification, × 60. (d) The nuclear to cytosol (n/c) ratio of HA-Bcl-xL florescent signals were quantified in at least 40 individual cells per cell line and normalized to the dsRed negative. Results are reported as mean ± SEM. Data were analyzed by one-way ANOVA followed by Turkey HSD post hoc test. *: statistically significant difference at p<0.05. (e and f) Cells pre-treated with 0.5 μg/ml doxycycline for 96 hours were assayed for transwell invasion (e) and proliferation. (f) Values are mean ± SEM, N= 3. *: p<0.05, two tail t test.
Figure 3.
Figure 3.. Knockdown of CtBP2 reduces metastasis promoted by Bcl-xL in vivo.
(a) Representative fluorescent images of sorted, dsRed positive BON1/TGL/HA-Bcl-xL/tet-O-dsRed-shRLuc (#713)-PGK-rtTA3, BON1/TGL/HA-Bcl-xL/tet-O-dsRed-shCtBP2 (#2260)-PGK-rtTA3, and BON1/TGL/HA-Bcl-xL/tet-O-dsRed-shCtBP2 (#2403)-PGK-rtTA3 cells pre-treated with 0.5 μg/ml doxycycline for 96 hours. Scale bar, 50 μm. Original magnification, × 20. (b) Western blot analysis of CtBP2 protein levels. α-tubulin was used as loading control. (c) Cells were subjected to the biochemical fractionation. Mek1/2 (cytosolic protein) and histone H3 (nuclear protein) were used as controls. (d) Dox-pretreated BON1/TGL/HA-Bcl-xL/tet-O-dsRed-shRLuc (#713)-PGK-rtTA3 and BON1/TGL/HA-Bcl-xL/tet-O-dsRed-shCtBP2 (#2260)-PGK-rtTA3 cells were injected into NSG mice that started doxycycline diet one day before tumor injection. Fold change of bioluminescent signals over the course of the 28 days was shown. N= 5 for each group. (e) Representative bioluminescent images of mice at day 28 were shown from each group.
Figure 4.
Figure 4.. Knockout of CtBP2 reduces Bcl-xL transcripts and the nuclear to cytosol ratio of Bcl-xL.
(a) MDA-MB-231 control cells and MDA-MB-231 with CtBP2 knockout (KO) cells were harvested for Western blot analysis of CtBP2, CtBP1, and Bcl-xL protein levels. (b and c) RT-qPCR analysis of the CtBP2 (b) and Bcl-xL (c) expression levels. (d) Cells were subjected to the biochemical fractionation. Mek1/2 (cytosolic protein) and histone H3 (nuclear protein) were used as controls for the biochemical fractionation. (e) Cells were fixed and stained with anti-CtBP2 antibody (green), anti-Bcl-xL antibody (red), and DAPI (blue). Representative confocal images were shown. Scale bar, 20 μm. Original magnification, × 60. (f) The nuclear to cytosol ratio of Bcl-xL florescent signals were quantified in at least 40 individual cells. Data were analyzed by one-way ANOVA followed by Turkey HSD post hoc test and shown as mean ± SEM. *: p<0.05.
Figure 5.
Figure 5.. Mapping the Bcl-xL/CtBP2 interaction domain on CtBP2.
(a) Schematic diagrams of full-length CtBP2 and its truncation constructs. (b and c) V5 tagged full length (FL) CtBP2 or CtBP2 truncation constructs were co-transfected with HA-tagged Bcl-xL to U2OS cells. 500 μg of clarified U2OS lysates were used for ReCLIP with anti-HA agarose followed by Western blotting for V5, HA, and MLL1.
Figure 6.
Figure 6.. Mapping the Bcl-xL/CtBP2 interaction domain on Bcl-xL.
(a) Schematic diagrams of chimeric Myc-tagged Bcl-xL/Bcl-B. (b) V5 tagged full length CtBP2 or Myc-tagged Bcl-xL/Bcl-B were co-transfected to 293T cells. The cell lysates were used for anti-Myc IP followed by Western blotting for V5, Myc, and MLL1. (c) Construct # 5 and 6 subcloned into HA-tagged RCAS vectors and were expressed in N134 cells. The expression of HA chimeric proteins was verified by Western blot. (d) Indicated cell lines were treated 10 mM etoposide or vehicle. After 24h, apoptosis was measured by Caspase-Glo 3/7 Assay. Results were presented as mean ± the standard error of the mean (SEM). *: p<0.05 compared with vehicle-treated control cells and #: p<0.05 compared with etoposide - treated control cells, student’s t-test. (e) N134-HA-construct #5 and N134-HA-construct #6 cells were injected into tail vein of NSG mice. Five weeks later, liver metastases (> 1 mm in diameter on Hematoxylin and eosin (H&E)-stained slides) were quantified.
Figure 7.
Figure 7.. MLL1 interacts with the Bcl-xL/CtBP2 complex and knockdown of MLL1 reduces tumor spheroid invasion.
(a) BON1/TGL cells overexpressing pQ vector or HA-Bcl-xL were treated with DMSO or 40 μM MM102 (MLL1 inhibitor) for 96 hours with medium changing for every 48 hours and harvested for Western blotting for H3K4me3 and total histone H3. (b) TGFβ mRNA levels in the BON1/TGL cells overexpressing Bcl-xL were analyzed by RT-qPCR. (c) Transwell invasion assay of the BON1/TGL cells overexpressing Bcl-xL treated with DMSO or MM102 was performed. Data are expressed as the normalized number of cells invaded to the bottom surface of the transwell inserts in eight fields under × 20 magnification after 24 hours relative to that of cells with vector alone. Values are means ± SEM. N= 3. *p<0.05, two tail t test. (d) Representative fluorescent images of BON1/TGL/HA-Bcl-xL/tet-O-dsRed-shRLuc (#713)-PGK-rtTA3, BON1/TGL/HA-Bcl-xL/tet-O-dsRed-shMLL1 (#13408)-PGK-rtTA3, and BON1/TGL/HA-Bcl-xL/tet-O-dsRed-shMLL1 (#13406)-PGK-rtTA3 cells treated with 1 μg/ml Dox for 96 hours were shown. Scale bar, 50 μm. Original magnification, × 20. (e) Cells were harvested for Western blotting of MLL1, H3K4me3 levels, α-tubulin and H3. (f) Representative images of spheroids of BON1/TGL/HA-Bcl-xL/tet-O-dsRed-shMLL1 (#13408)-PGK-rtTA3 cells. Original magnification ×4, scale bar 100 μm. (g) Change of whole tumor spheroid area over time was quantified (N= 6 for each condition). ****: p<0.0001, GEE method.
Figure 8.
Figure 8.. Bcl-xL positively regulates TGFβ signaling through H3K4me3 epigenetic modifications.
(a) CUT&RUN-Seq analysis using anti-H3K4me3 antibody or IgG control in BON1/TGL/pQ (pQ) and BON1/TGL/HA-Bcl-xL (HA) cells was performed. Venn diagram of the number of H3K4me3 binding sites was shown. (b) IPA analysis of the gene promoters with unique H3K4me3 binding sites in BON1/TGL/HA-Bcl-xL cells. (c-h) Track views of representative Integrative Genomics Viewer (IGV) for peaks near the transcription start sites of ACVR1, NKX2-5, SMAD3, SMAD5, ZNF42, and TGFβ1 in CUT&RUN assays were shown. (i) RT-qPCR of ACVR1, NKX2-5, SMAD3, SMAD5, and ZNF42 from BON1/TGL/pQ and BON1/TGL/HA-Bcl-xL cells.

References

    1. Beverly LJ, Varmus HE (2009) MYC-induced myeloid leukemogenesis is accelerated by all six members of the antiapoptotic BCL family. Oncogene 28: 1274–1279 - PMC - PubMed
    1. Boise LH, Gonzalez-Garcia M, Postema CE, Ding L, Lindsten T, Turka LA, Mao X, Nunez G, Thompson CB (1993) bcl-x, a bcl-2-related gene that functions as a dominant regulator of apoptotic cell death. Cell 74: 597–608 - PubMed
    1. Bolger AM, Lohse M, Usadel B (2014) Trimmomatic: a flexible trimmer for Illumina sequence data. Bioinformatics 30: 2114–2120 - PMC - PubMed
    1. Cerami E, Gao J, Dogrusoz U, Gross BE, Sumer SO, Aksoy BA, Jacobsen A, Byrne CJ, Heuer ML, Larsson E et al. (2012) The cBio cancer genomics portal: an open platform for exploring multidimensional cancer genomics data. Cancer Discov 2: 401–404 - PMC - PubMed
    1. Chawla AT, Cororaton AD, Idowu MO, Damle PK, Szomju B, Ellis KC, Patel BB, Grossman SR (2018) An intestinal stem cell niche in. Oncotarget 9: 32408–32418 - PMC - PubMed

Publication types