. 2023 Aug 7;220(8):e20221773.
doi: 10.1084/jem.20221773. Epub 2023 May 10.

Diet-mediated constitutive induction of novel IL-4+ ILC2 cells maintains intestinal homeostasis in mice

Affiliations

Diet-mediated constitutive induction of novel IL-4+ ILC2 cells maintains intestinal homeostasis in mice

Wanlin Cui et al. J Exp Med. .

Abstract

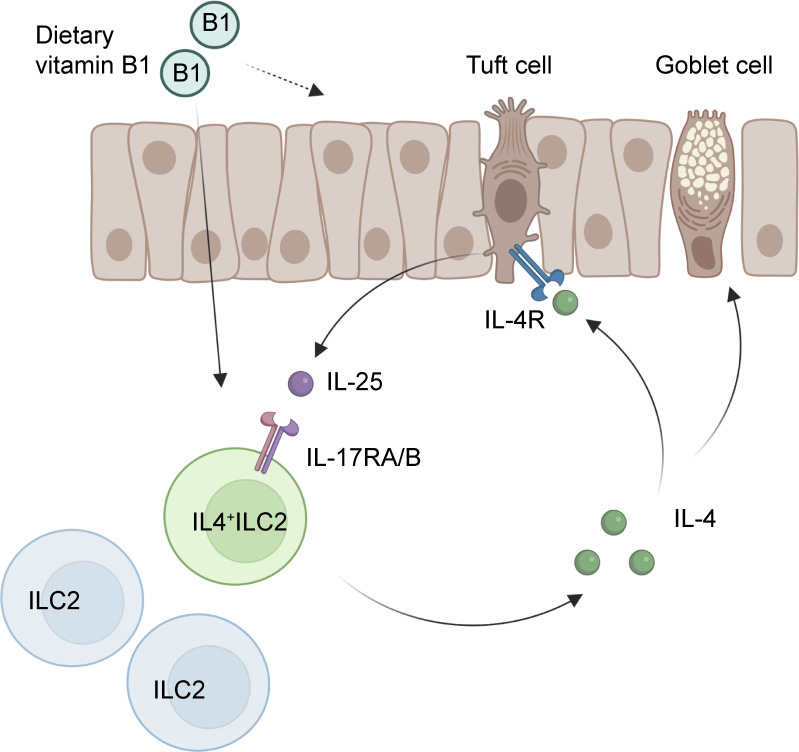
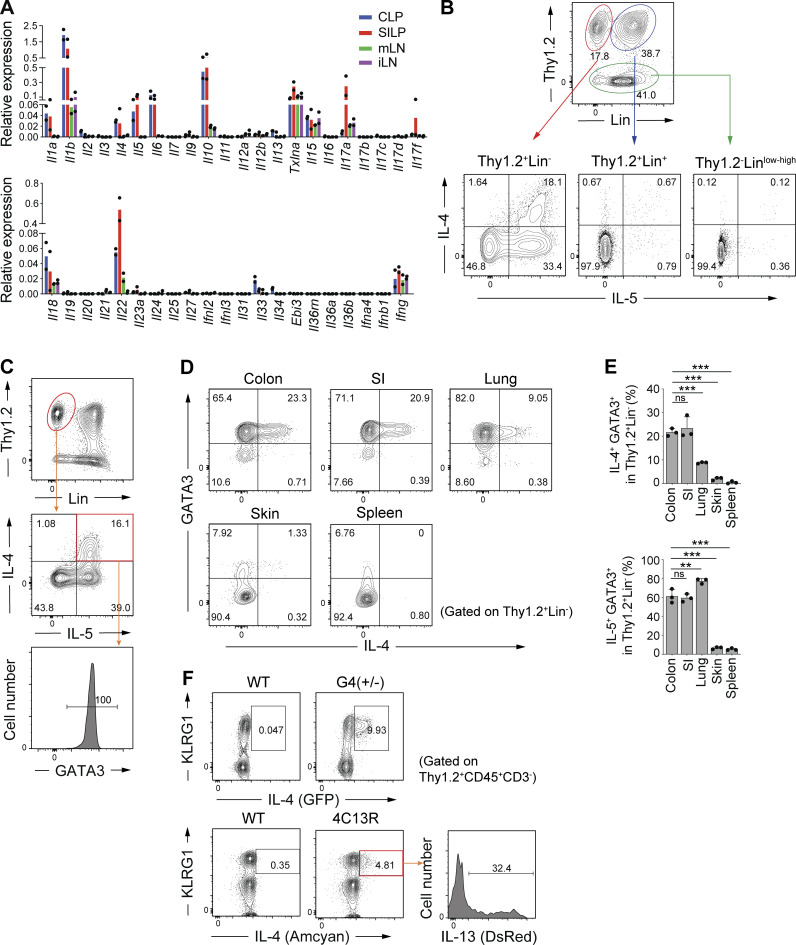
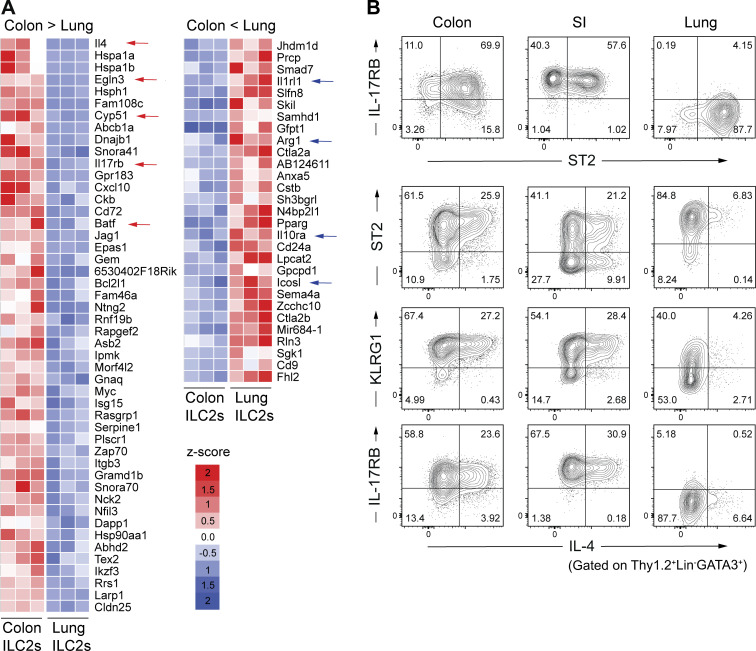
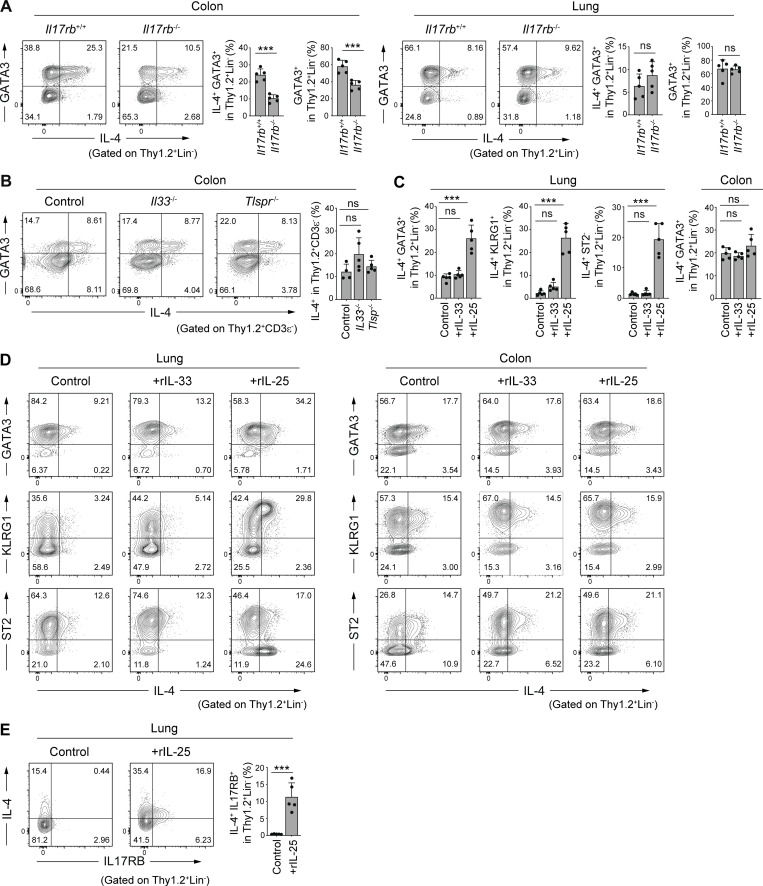
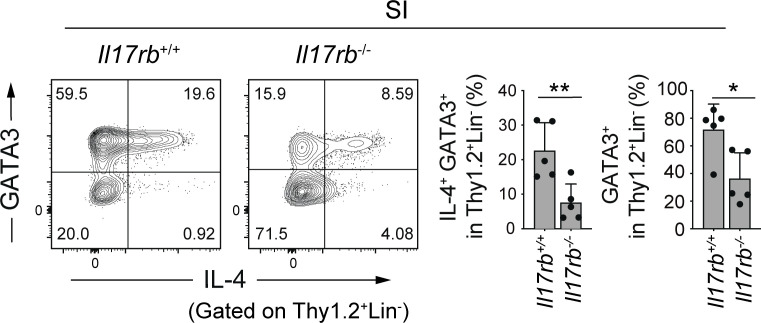
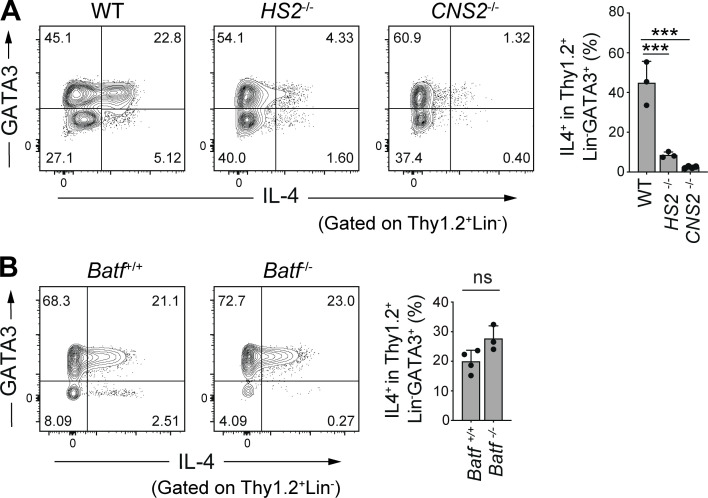
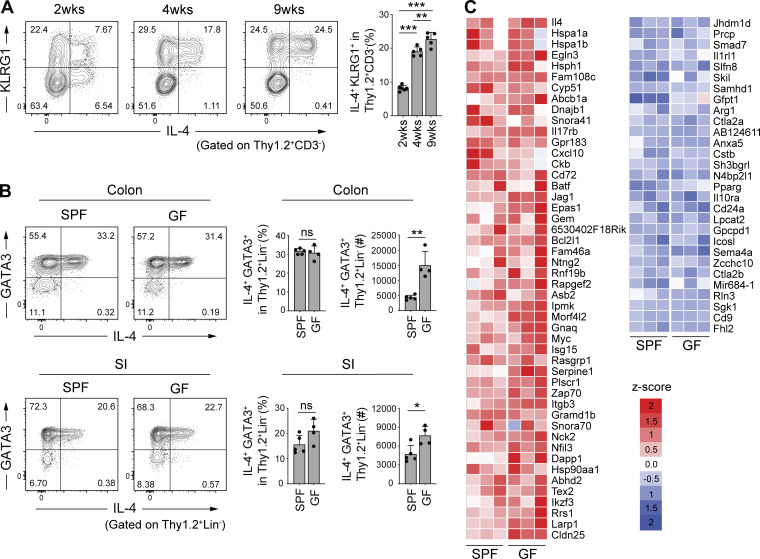
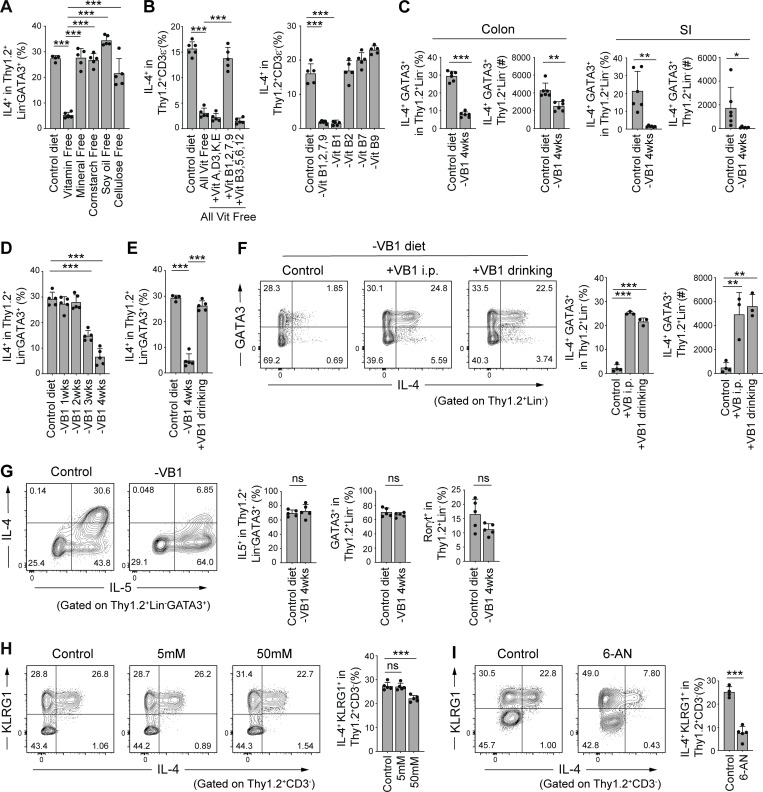
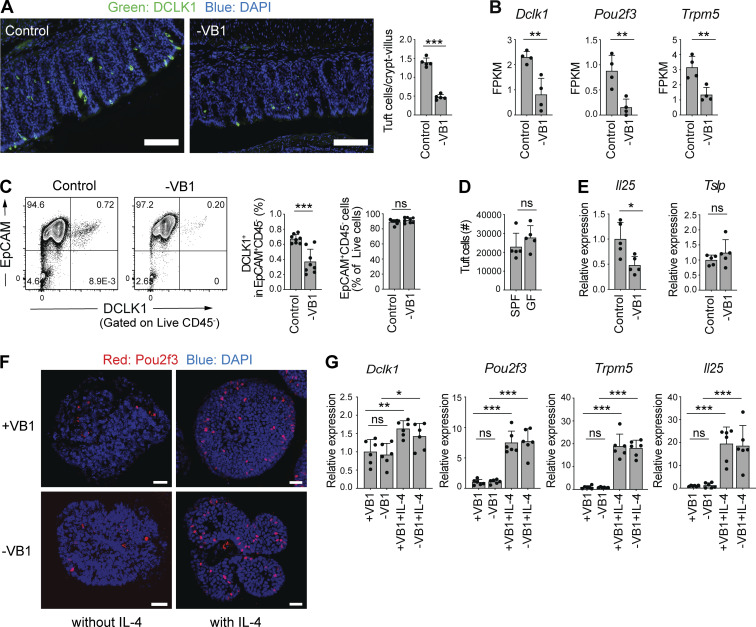
Group 2 innate lymphoid cells (ILC2s) expressing IL-5 and IL-13 are localized at various mucosal tissues and play critical roles in the induction of type 2 inflammation, response to helminth infection, and tissue repair. Here, we reveal a unique ILC2 subset in the mouse intestine that constitutively expresses IL-4 together with GATA3, ST2, KLRG1, IL-17RB, and IL-5. In this subset, IL-4 expression is regulated by mechanisms similar to but distinct from those observed in T cells and is partly affected by IL-25 signaling. Although the absence of the microbiota had marginal effects, feeding mice with a vitamin B1-deficient diet compromised the number of intestinal IL-4+ ILC2s. The decrease in the number of IL-4+ ILC2s caused by the vitamin B1 deficiency was accompanied by a reduction in IL-25-producing tuft cells. Our findings reveal that dietary vitamin B1 plays a critical role in maintaining interaction between tuft cells and IL-4+ ILC2s, a previously uncharacterized immune cell population that may contribute to maintaining intestinal homeostasis.


Conflict of interest statement

Disclosures: Y. Nagano reported personal fees from Astellas Pharma outside the submitted work. K. Honda reported being a scientific advisory board member of Vedanta Biosciences and 4BIO CAPITAL. No other disclosures were reported.

Figures

None
Graphical abstract
Figure 1.
Figure 1.
IL-4+ ILC2s are abundant in the colonic LP. (A) Expression of the indicated cytokine genes normalized to Gapdh in lymphocytes from colonic LP (CLP), small intestinal LP (SILP), mesenteric LN (mLN), and inguinal LN (iLN), as quantified using qPCR. (B) Representative flow cytometry plots showing IL-4 and IL-5 expression in three different subsets (Thy1.2+Lin, Thy1.2+Lin+, Thy1.2) of colonic LP lymphocytes stimulated with PMA and ionomycin. (C) GATA3 expression in Thy1.2+Lin IL-4+ IL-5+ cells in colonic LP. (D) Representative flow cytometry plots showing the expression of GATA3 and IL-4 by gated Thy1.2+Lin cells in the indicated organs. (E) Frequencies of IL-4+GATA3+ cells and IL-5+GATA3+ cells among Thy1.2+Lin cells in the indicated organs. Bar graphs showed the mean ± SD. ***P < 0.001; **P < 0.01; ns, not significant; one-way ANOVA with Tukey’s test. Each dot represents an individual mouse. (F) Representative flow cytometry plots and histogram showing KLRG1, IL-4, and IL-13 expression by gated colonic LP CD45+ Thy1.2+CD3 cells. Data shown are representative of more than two independent experiments.
Figure 2.
Figure 2.
Characteristics of colonic IL-4+ ILC2s. (A) Differential gene expression in colonic ILC2s (Thy1.2+CD3 KLRG1+ cells) and pulmonary ILC2s (Thy1.2+CD3 ST2+ cells) sorted from SPF B6 mice. Heatmap colors represent the z-score normalized FPKM values for each gene. (B) Representative flow cytometry plots showing the expression of IL-17RB, KLRG1, ST2, and IL-4 by gated Thy1.2+LinGATA3+ cells in the colon, SI LP, and lungs. Data shown are representative of more than two independent experiments with n ≥ 3 individual mice per group.
Figure 3.
Figure 3.
IL-25 dependence of colonic IL-4+ ILC2s. (A) Representative flow cytometry plots and frequencies of IL-4+GATA3+ cells and GATA3+ cells among Thy1.2+Lin cells in the colonic LP and lungs of Il17rb+/+ and Il17rb−/− mice. (B) Representative flow cytometry plots and frequencies of IL-4+ cells among Thy1.2+CD3ε cells in the colonic LP of WT, Il33−/−, and Tslpr−/− mice (BALB/c background). (C–E) SPF B6 mice were intraperitoneally injected once daily for 3 d with PBS control, recombinant IL-25 (200 ng/mouse/d), or recombinant IL-33 (200 ng/mouse/d). Frequencies of IL4+GATA3+, IL-4+KLRG1+, and IL-4+ST2 cells among Thy1.2+Lin cells in the lung and IL4+GATA3+ cells among Thy1.2+Lin cells in the colon (C), and representative flow cytometry plots showing the expression of IL-4, GATA3, KLRG1, and ST2 by gated Thy1.2+Lin cells from the lungs and colon (D). Representative flow cytometry plots and frequencies of IL-4+ IL-17RB+ cells in gated Thy1.2+Lin cells from the lungs of mice injected with rIL-25 are shown in E. Bar graphs show the mean ± SD. ***P < 0.001; ns, not significant; two-tailed unpaired Student’s t test (A and E), one-way ANOVA with Tukey’s test (B and C). Each dot represents an individual mouse. Data shown are representative of more than two independent experiments with n ≥ 4 individual mice per group.
Figure S1.
Figure S1.
IL-4+ ILC2s in the small intestine of Il17rb−/− mice. Representative plots (left) and frequencies (right) of IL-4+GATA3+ cells and GATA3+ cells among Thy1.2+Lin cells in the SI LP of Il17rb+/+ and Il17rb−/− mice. Bar graphs show the mean ± SD. **P < 0.01; *P < 0.05; two-tailed unpaired Student’s t test. Each dot represents an individual mouse. Data shown are representative of more than three independent experiments with n ≥ 3 individual mice per group.
Figure 4.
Figure 4.
Unique regulation of Il4 gene expression in colonic IL-4+ ILC2s. (A) Representative flow cytometry plots (left) and frequencies (right) of IL-4+ cells among Thy1.2+LinGATA3+ cells in the colonic LP of mice deficient for the HS2 or CNS2 loci of the Il4 gene. (B) Representative flow cytometry plots (left) and frequencies (right) of IL-4+ cells among Thy1.2+LinGATA3+ cells in the colonic LP of mice deficient for the Batf gene. Bar graphs show the mean ± SD. ***P < 0.001; ns, not significant; one-way ANOVA with Tukey’s test (A), two-tailed unpaired Student’s t test (B). Each dot represents an individual mouse. Data shown are representative of more than two independent experiments with n ≥ 3 individual mice per group.
Figure 5.
Figure 5.
Microbiota-independent induction of colonic IL-4+ ILC2s. (A) Representative flow cytometry plots (left) and frequencies (right) of IL-4+KLRG1+ cells among Thy1.2+CD3 cells in the colonic LP of SPF B6 mice at 2–9 wk of age. (B) Representative flow cytometry plots (left), frequencies, and absolute number (right) of IL-4+GATA3+ cells among Thy1.2+Lin cells in the intestinal LP of SPF and GF B6 mice. Bar graphs show the mean ± SD. ***P < 0.001; **P < 0.01; *P < 0.05; ns, not significant; one-way ANOVA with Tukey’s test (A), two-tailed unpaired Student’s t test (B). Each dot represents an individual mouse. (C) Relative expression of genes listed in Fig. 2 A in colonic ILC2s (Thy1.2+CD3KLRG1+ cells) sorted from SPF (n = 3) and GF (n = 3) B6 mice. Heatmap colors represent the z-score normalized FPKM values for each gene. Data shown are representative of more than two independent experiments with n ≥ 3 individual mice per group.
Figure 6.
Figure 6.
VB1-dependent induction of colonic IL-4+ ILC2s. (A) Frequencies of IL-4+ cells among Thy1.2+LinGATA3+ population in the colonic LP of SPF B6 mice fed a control diet or a diet lacking the indicated dietary components for 4 wk. (B) Frequencies of IL-4+ cells among Thy1.2+ CD3ε population in the colonic LP of SPF B6 mice fed a control diet, an all vitamin-free diet, a vitamin-free diet supplemented with the indicated vitamins (left), or a diet deprived of the indicated vitamin B component (right). (C) Frequencies and absolute number of IL-4+GATA3+ cells among Thy1.2+Lin cells in colonic and SI LP of SPF B6 mice fed a control diet or VB1-deficient (-VB1) diet. (D and E) Frequencies of IL-4+ cells among Thy1.2+LinGATA3+ population in the colonic LP of SPF B6 mice fed VB1-deficient diet for the indicated weeks (D) or VB1-deficient diet for 4 wk and then supplemented with VB1 for 1 wk via the drinking water (E). (F) Representative flow cytometry plots and frequencies of IL-4+GATA3+ cells among Thy1.2+Lin cells in the colonic LP of SPF B6 mice fed a VB1-deficient diet for 4 wk followed by treatment with VB1 either through i.p. injection or drinking water for 1 wk. (G) SPF mice were fed a VB1-deficient diet for 4 wk. Representative flow cytometry plots (left) showing the expression of IL-4 and IL-5 by gated Thy1.2+LinGATA3+ cells in the colonic LP and frequencies (right) of colonic LP IL-5+ cells among Thy1.2+LinGATA3+ population and GATA3+ or Rorγt+ cells among Thy1.2+Lin population. (H) Representative plots (left) and frequencies (right) of IL-4+KLRG1+ cells among Thy1.2+CD3 cells in the colonic LP of SPF B6 mice treated with 0, 5, or 50 mM lactic acid for 5 wk in drinking water. (I) Representative plots (left) and frequencies (right) of IL-4+KLRG1+ cells among Thy1.2+CD3 cells in the colonic LP of SPF B6 mice treated with PBS or 6-AN. Bar graphs show the mean ± SD. ***P < 0.001; **P < 0.01; *P < 0.05; ns, not significant; one-way ANOVA with Tukey’s test (A, B, D–F, and H), two-tailed unpaired Student’s t test (C, G, and I). Each dot represents an individual mouse. Data shown are representative of more than two independent experiments with n ≥ 3 individual mice per group.
Figure 7.
Figure 7.
Dietary VB1 maintains IL-4+ILC2– and IL-25–producing tuft cell populations. (A) Colon sections from SPF B6 mice fed a control or VB1-deficient diet were stained for DCLK1 (green) and DAPI (blue). Scale bar = 100 μm. Bar graph shows the number of DCLK1+ cells per crypt-villus of the colon. (B) Expression of the indicated genes in colonic epithelium isolated from SPF C57/B6 mice fed a control or VB1-deficient (-VB1) diet, as quantified by RNAseq. (C) Representative flow cytometry plots (left) of colonic tuft cells (EpCAM+CD45DCLK1+). Bar graphs show frequency of colonic DCLK+ cells among CD45EpCAM+ population and EpCAM+CD45 cells among live cells. (D) The number of tuft cells (EpCAM+CD45DCLK1+) in the colon of GF and SPF B6 mice was measured by flow cytometry. (E) qPCR quantification of IL-25 and TSLP expression normalized to Actb in the colonic epithelial cell fraction from mice fed a control or VB1-deficient diet. (F and G) Colonic organoids from mice were grown in the presence or absence of VB1, followed by incubation with or without recombinant IL-4. Whole-mount immunofluorescent staining of the organoids with anti-Pou2f3 antibody (red) and DAPI (blue) are shown in F. qPCR quantification of the indicated gene expression normalized to Gapdh is shown in G. Scale bar = 25 μm. Bar graph shows the mean ± SD. ***P < 0.001; **P < 0.01; *P < 0.05; ns, not significant; two-tailed unpaired Student’s t test (A–E), one-way ANOVA with Tukey’s test (G). Each dot represents an individual mouse. Data shown are representative of more than two independent experiments with n ≥ 4 individual mice per group.
Figure S2.
Figure S2.
Expression of VB1 transporters by intestinal epithelial cells. qPCR quantification of ThTr1 and ThTr2 expression normalized to Actb in the colonic tuft cells (EpCAM+CD45DCLK1+) and other (EpCAM+CD45DCLK1) epithelial cells isolated from SPF B6 mice by flow cytometry. ns, not significant; two-tailed unpaired Student’s t test. Each dot represents an individual mouse. Data shown are representative of more than two independent experiments with ≥3 individual mice per group.
Figure 8.
Figure 8.
Exacerbation of experimental colitis by VB1 deficiency. (A) The proximal colon from SPF B6 mice fed a control or VB1-deficient (-VB1) diet were subjected to fluorescence staining with Muc2 (red) and DAPI (blue; upper panels), and the thickness of the inner mucus layer and the number of goblet cells in transverse sections of each mouse were determined using ImageJ software (lower bar graphs). Scale bar = 50 μm. (B) TNBS-colitis was induced in SPF B6 mice fed a control or VB1-deficient diet for 3 wk. H&E staining (left) and histological score (right) of the indicated mice are shown. Scale bar = 100 μm. Scale bar = 100 μm. Bar graph shows the mean ± SD. ***P < 0.001; **P < 0.01; *P < 0.05; two-tailed unpaired Student’s t test (A) and one-way ANOVA with Tukey’s test (B). Each dot represents an individual mouse. Data shown are representative of more than two independent experiments with n ≥ 3 individual mice per group.
Figure S3.
Figure S3.
Influences of VB1-deficiency on IL-13 expression by ILC2s. Representative plots (left) showing the expression of IL-4 and IL-13 by gated Thy1.2+Lin GATA3+ cells and frequencies (right) of IL-13+GATA3+ cells among Thy1.2+Lin cells in the colonic LP of SPF B6 mice fed a control or VB1-deficient diet. Bar graphs show the mean ± SD. ns, not significant; two-tailed unpaired Student’s t test. Each dot represents an individual mouse. Data shown are representative of more than three independent experiments with n ≥ 3 individual mice per group.

References

    1. Angkasekwinai, P., Park H., Wang Y.H., Wang Y.H., Chang S.H., Corry D.B., Liu Y.J., Zhu Z., and Dong C.. 2007. Interleukin 25 promotes the initiation of proallergic type 2 responses. J. Exp. Med. 204:1509–1517. 10.1084/jem.20061675 - DOI - PMC - PubMed
    1. Artis, D., and Spits H.. 2015. The biology of innate lymphoid cells. Nature. 517:293–301. 10.1038/nature14189 - DOI - PubMed
    1. Betz, B.C., Jordan-Williams K.L., Wang C., Kang S.G., Liao J., Logan M.R., Kim C.H., and Taparowsky E.J.. 2010. Batf coordinates multiple aspects of B and T cell function required for normal antibody responses. J. Exp. Med. 207:933–942. 10.1084/jem.20091548 - DOI - PMC - PubMed
    1. Campbell, L., Hepworth M.R., Whittingham-Dowd J., Thompson S., Bancroft A.J., Hayes K.S., Shaw T.N., Dickey B.F., Flamar A.L., Artis D., et al. . 2019. ILC2s mediate systemic innate protection by priming mucus production at distal mucosal sites. J. Exp. Med. 216:2714–2723. 10.1084/jem.20180610 - DOI - PMC - PubMed
    1. Carpino, N., Thierfelder W.E., Chang M.S., Saris C., Turner S.J., Ziegler S.F., and Ihle J.N.. 2004. Absence of an essential role for thymic stromal lymphopoietin receptor in murine B-cell development. Mol. Cell. Biol. 24:2584–2592. 10.1128/MCB.24.6.2584-2592.2004 - DOI - PMC - PubMed

Publication types