Evaluating the impact of Trichoderma biofertilizer and planting dates on mustard yield performance using the InfoCrop growth model
- PMID: 37163528
- PMCID: PMC10171583
- DOI: 10.1371/journal.pone.0285482
Evaluating the impact of Trichoderma biofertilizer and planting dates on mustard yield performance using the InfoCrop growth model
Abstract
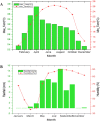
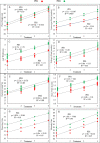
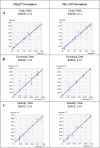
A crop simulation model is adopted to calculate the potential yield in a certain location. The data sets generated in each scenario (2021-2022) were used to evaluate the InfoCrop model. A field experiment using a randomized complete block design was conducted at the Agronomy Department's research field, Hajee Mohammad Danesh Science and Technology University. The following two factors: 1) factor A: sowing dates (Planting date 1: PD1 = 5th November and Planting date 2: PD2 = 15th November 2021) and 2) factor B: Trichoderma biofertilizers (T1 = control, T2 = 50% chemical fertilizer + 2,000 kg ha-1 Trichoderma biofertlizer, T3 = fully chemical fertilizer; and T4 = fully 3,000 kg ha-1 Trichoderma biofertilizer). Three BARI (Bangladesh Agricultural Research Institute) released varieties (V1 = BARI Sarisa-14, V2 = BARI Sarisa-16, and V3 = BARI Sarisa-17) used for the completion of the experiment. The Trichoderma biofertilizer and planting dates had a significant influence on yield and yield attributes of mustard. Results showed that plant height, leaf width, leaves per plant, pods per plant, harvest index, maturity date, and yield were significantly affected by Trichoderma biofertilizer treatments, two different conditions, and varieties. The regression analysis indicated a significant linear relationship between two different growing conditions especially for harvest index PD2>PD1 (0.88>0.83), grain yield (0.94>0.90), flowering date (0.95>0.91) and maturity date (0.95>0.90). It was found that the model significantly overestimated all the parameters with an acceptable error range (<15%) while growth and yield characteristics including flowering and maturity dates and yield were simulated and results were compared to observed data. BARI Sarisa 16 had the highest simulated yield of 2.5 t ha-1 and showed a high yielding variety among the used varieties in the experiment. As a result, it can be concluded that if the InfoCrop growth model is carefully calibrated, it will be an excellent tool for evaluating and identifying the best yielding variety.
Copyright: © 2023 Islam et al. This is an open access article distributed under the terms of the Creative Commons Attribution License, which permits unrestricted use, distribution, and reproduction in any medium, provided the original author and source are credited.
Conflict of interest statement
The authors have declared that no competing interests exist.
Figures


References
-
- Banglapedia. National encyclopedia of Bangladesh. Agriculture. 2021 [cited 2022 June 18]. Available from: https://en.banglapedia.org/index.php/Agriculture.
-
- Bhojiya AA, Mahmud AA, Upadhyay SK, Srivastava AK. Biofertilizers: A nexus between soil fertility and crop productivity under abiotic stress. Current Research in Environmental Sustainability. 2021; 3:100063. 10.1016/j.crsust.2021.100063. - DOI
-
- Dhaliwal SS, Naresh RK, Mandal A, Singh R, Dhaliwal MK. Dynamics and transformations of micronutrients in agricultural soils as influenced by organic matter build-up: A review. Environmental and Sustainability Indicators. 2019; 1–2:100007. 10.1016/j.indic.2019.10000. - DOI
-
- Hajong P, Rahman MH, Rahman MS, Ahammad KU, Islam MI. Study on scope and existing cropping pattern at south-western saline region of Bangladesh. Journal of Bioscience and Agriculture Research. 2020; 27(02):2278–2286. 10.18801/jbar.270221.277. - DOI
Publication types
MeSH terms
Substances
LinkOut - more resources
Full Text Sources
Research Materials

