. 2023 May 10;9(19):eade4443.
doi: 10.1126/sciadv.ade4443. Epub 2023 May 10.

Functional neuronal circuits promote disease progression in cancer

Affiliations

Functional neuronal circuits promote disease progression in cancer

Anthony C Restaino et al. Sci Adv. .

Abstract

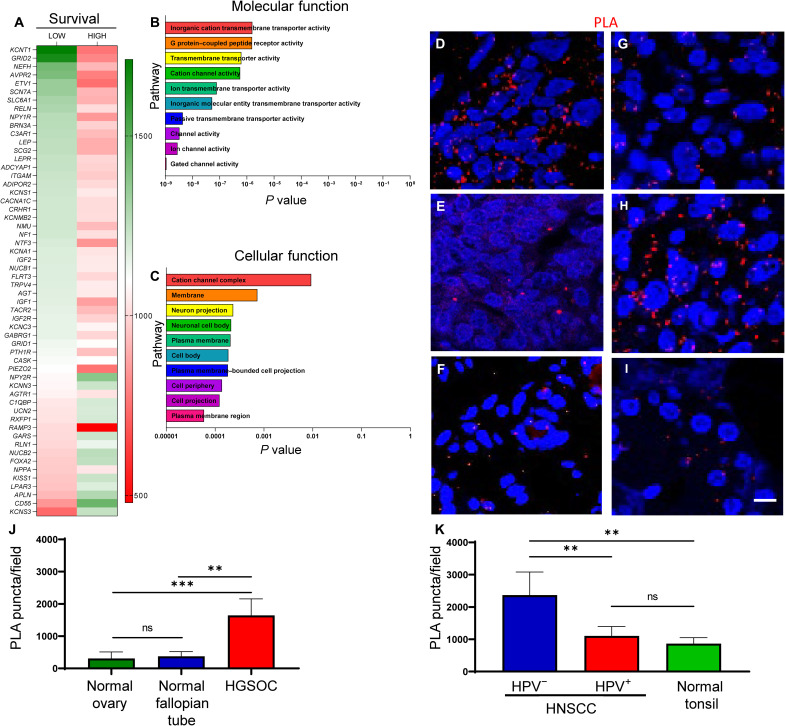
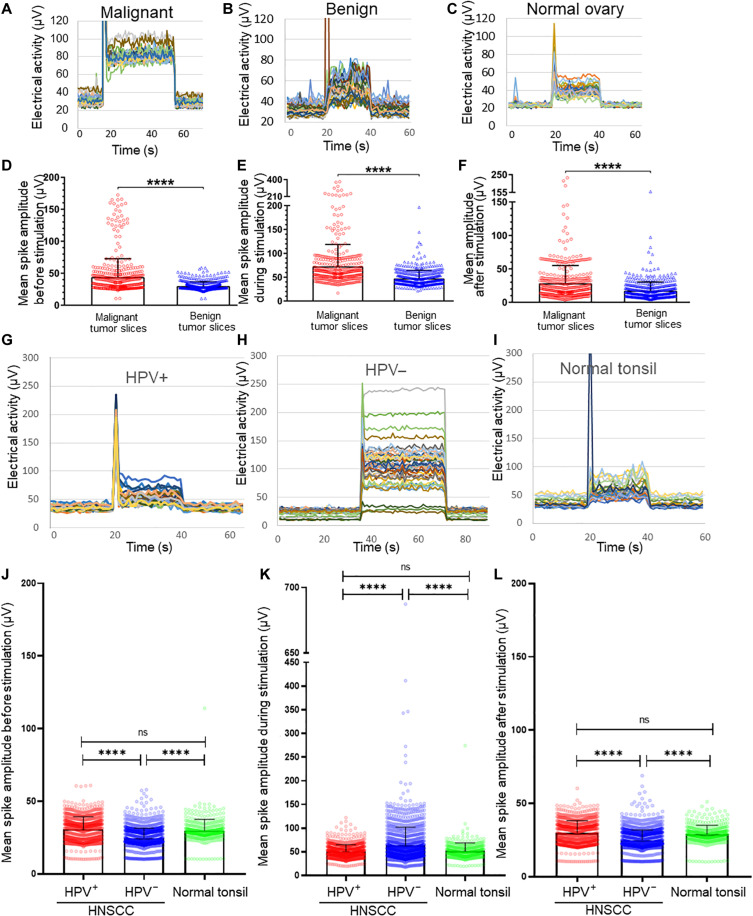
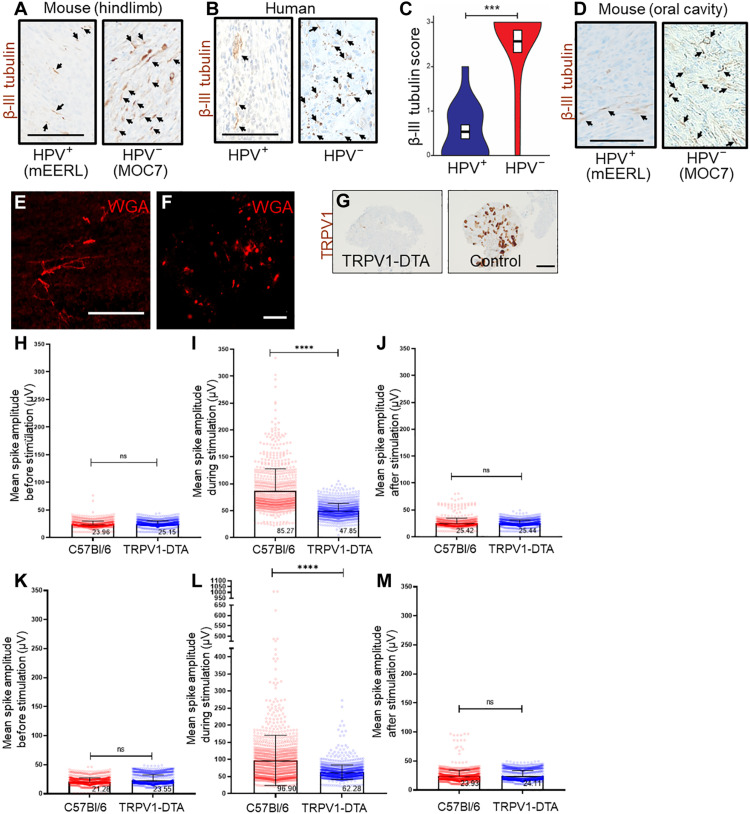
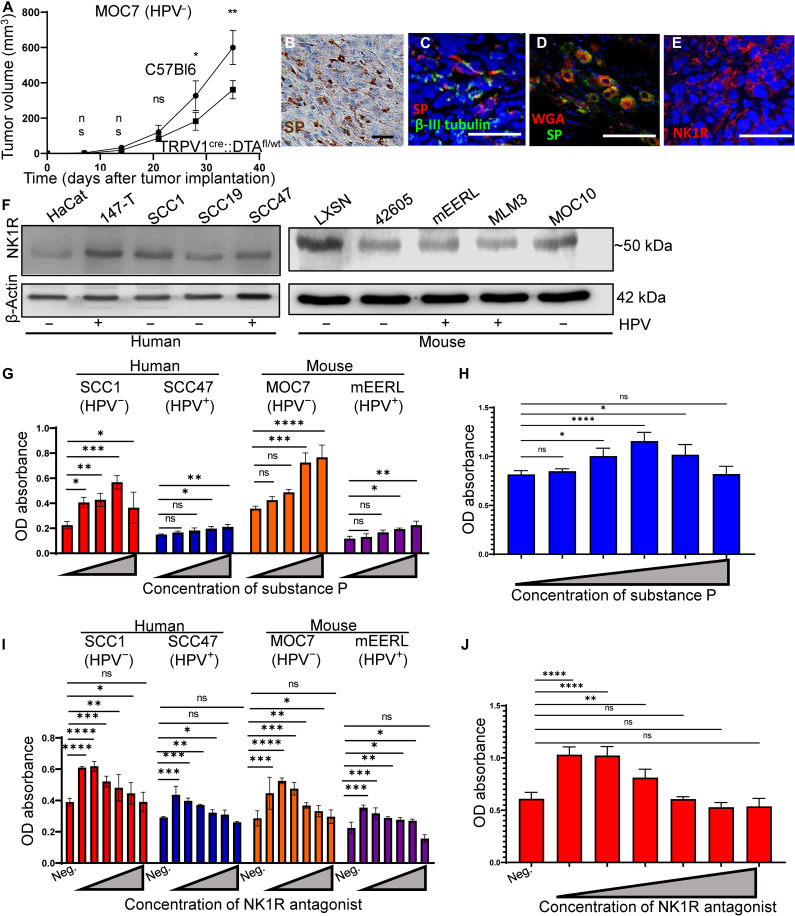
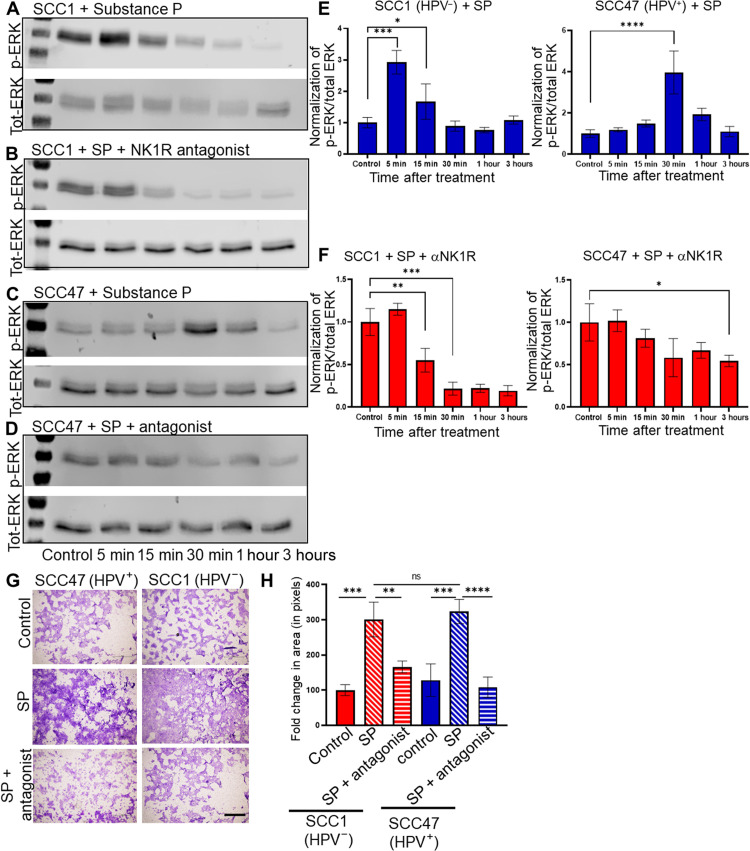
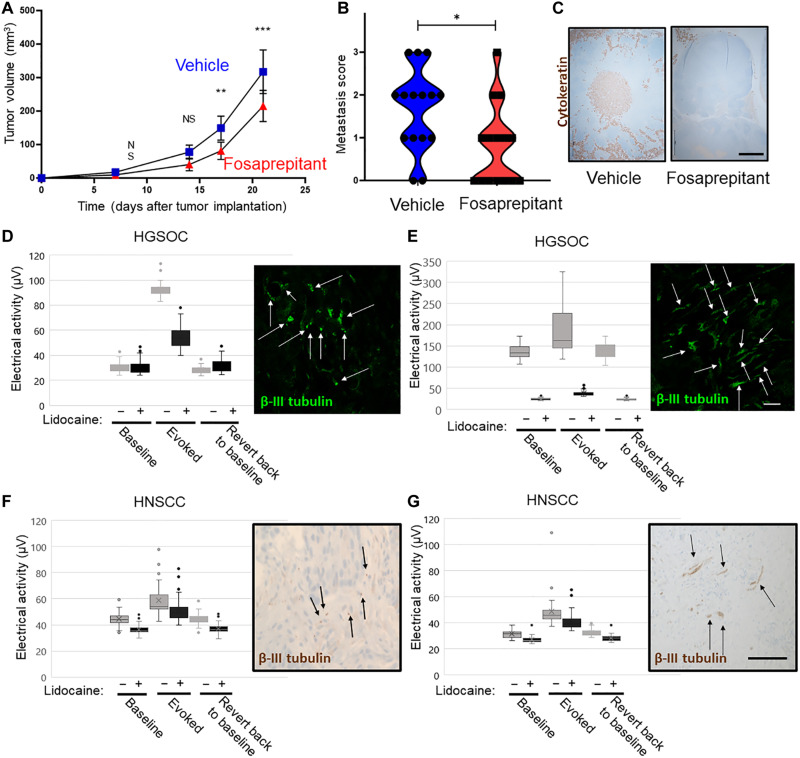
The molecular and functional contributions of intratumoral nerves to disease remain largely unknown. We localized synaptic markers within tumors suggesting that these nerves form functional connections. Consistent with this, electrophysiological analysis shows that malignancies harbor significantly higher electrical activity than benign disease or normal tissues. We also demonstrate pharmacologic silencing of tumoral electrical activity. Tumors implanted in transgenic animals lacking nociceptor neurons show reduced electrical activity. These data suggest that intratumoral nerves remain functional at the tumor bed. Immunohistochemical staining demonstrates the presence of the neuropeptide, Substance P (SP), within the tumor space. We show that tumor cells express the SP receptor, NK1R, and that ligand/receptor engagement promotes cellular proliferation and migration. Our findings identify a mechanism whereby intratumoral nerves promote cancer progression.


Figures

Fig. 1.
Fig. 1.. Neuronal gene expression correlates with survival, neuronal pathways, and synapse-like structures in tumors.
Heatmap of neuronal genes expressed by ovarian cancers from OncoLnc, Gepia2, and Oncomine datasets (A). Correlations between gene expression and patient survival shown. GO enrichment analysis of neuronal genes demonstrating significant pathways important for molecular (B) and cellular (C) functions in ovarian cancers. Representative en face confocal images of HGSOC (n = 4) (D), normal ovary (n = 2) (E), normal fallopian tube (n = 2) (F), HPV+ HNSCC (n = 4) (G), HPV HNSCC (n = 4) (H), and normal tonsil (n = 2) (I) stained by PLA for neurexin-3 and neuroligin-1. Red, positive PLA signal. Blue, 4′,6-diamidino-2-phenylindole nuclear stain. Scale bar, 100 μm. Quantification of PLA-positive signals from normal ovary, normal fallopian tube, and HGSOC (J) as well as HPV, HPV+, and normal tonsil (K). Statistical analysis by unpaired Student’s t test. **P < 0.05; ***P < 0.01; ns, not significant.
Fig. 2.
Fig. 2.. MEA analysis of tumors.
Snapshots of representative MEA recordings from malignant HGSOC (n = 13 cases) (A), benign gynecologic tumor (n = 5 cases) (B), and normal ovary (n = 2 cases) (C) patient samples before, during, and after stimulation. MEA quantification comparing malignant and benign disease at baseline (D), during evoked activation (E), and after removal of the artificial stimulus (F). Snapshots of representative MEA recordings from n = 2 HPV+ cases (G), n = 4 HPV cases (H), and n = 2 normal tonsils (I) before, during, and after stimulation. Quantification of MEA data comparing baseline (J), during evoked activation (K), and after removal of the artificial stimulus (L). Signals from all electrodes and all tissue slices were pooled, averaged, and compared. Statistical analysis by one-way analysis of variance (ANOVA). SD, error bars. ****P < 0.0001. N ≥ 4 slices per sample were generated on the basis of tumor size.
Fig. 3.
Fig. 3.. Electrical activity from TRPV1-expressing neurons.
Photomicrographs of murine [(A), hindlimb] and human (B) HPV+ and HPV HNSCCs immunohistochemically stained for β-III tubulin (brown). Arrows, positively stained intratumoral nerves. Scale bar, 100 μm. (C) Quantification of β-III tubulin score; score of 0, no positive staining; score of 1 indicates 10% positive staining; score of 2 indicates 30% positive staining; score of 3 indicates more than 30% positive staining. N = 15 cases each of HPV+ and HPV HNSCCs. Statistical analysis by Student’s t test. ***P < 0.0001. Representative photomicrograph of orthotopic mEERL (HPV+) and MOC7 (HPV) tumors IHC stained for β-III tubulin (arrowheads) (D). Scale bar, 100 μm. En face confocal image of orthotopic MOC7 (HPV) tumor injected with wheat germ agglutinin (WGA) neural tracer. Tracer+ (red) nerves in the tumor bed (E) map to the ipsilateral TGM ganglion (F). Scale bar, 200 μm. (G) Photomicrographs of DRG from TRPV1cre::DTAfl/WT (TRPV1-DTA) and C57Bl/6 (control) mice IHC stained for TRPV1 (brown). Scale bar, 100 μm. MEA analysis of Trp53−/−;Pten−/− [HGSOC, (H) to (J)] and MOC7 [HPV HNSCC, (K) to (M)] tumors subcutaneously implanted into either C57Bl/6 or TRPV1cre::DTAfl/WT (TRPV1-DTA) animals. Signals from all electrodes and all tissue slices were pooled, averaged, and compared. Statistical analysis by one-way ANOVA. SD, error bars. ****P < 0.0001.
Fig. 4.
Fig. 4.. SP induces tumor cell proliferation.
(A) Tumor growth curve of MOC7 (HPV) tumors orthotopically implanted into C57Bl/6 (control) or TRPV1cre::DTAfl/WT mice (n = 10 mice per group). Statistical analysis by multiple Student’s t test. **P < 0.01; *P < 0.05. (B) Photomicrograph of HNSCC (n = 4 cases) IHC stained for SP (brown). Scale bar, 50 μm. (C) En face confocal image of a HNSCC patient sample immunofluorescently stained for SP (red) and β-III tubulin (green). N = 4 tumors analyzed with similar results. Scale bar, 100 μm. (D) Ipsilateral TGM ganglion from tracer injected MOC7 (HPV) tumor showing colocalization of tracer (red) and SP (green). Scale bar, 50 μm. (E) Representative en face confocal images of HNSCC patient sample immunofluorescently stained for NK1R (red) (n = 4 patient samples). Scale bar, 100 μm. (F) Western blot analysis of whole cell lysates from the indicated HNSCC cell lines for NK1R. β-Actin, loading control. Cellular proliferation of the indicated HNSCC (G) or HGSOC (H) cell lines in response to increasing concentrations of SP for 24 hours or with inclusion of an anti-NK1R antagonist that inhibits this effect [(I), HNSCC; (J), HGSOC]. Statistical test by one-way ANOVA with post hoc Tukey test. *P < 0.05, **P < 0.01; ***P < 0.001; ****P < 0.0001. OD, optical density.
Fig. 5.
Fig. 5.. SP induces cellular migration.
Western blot analysis for p-ERK and total-ERK for SCC1 (HPV) or SCC47 (HPV+) cells treated with SP alone (A and C, respectively) or in the presence of the NK1R antagonist (B and D, respectively) for indicated time points. Densitometric quantification (p-ERK/total ERK) for SCC1 and SCC47 cells treated with SP alone (E) or in the presence of NK1R antagonist (F). (G) Photomicrographs of Transwell migration assays of the indicated cells alone (control), treated with SP (SP), or treated with SP with the NK1R antagonist (SP + antagonist). Scale bar, 500 μm. (H) Quantification of migration assay [in (G)], n = 3 biological replicates, n = 4 technical replicates. Statistical test by one-way ANOVA with post hoc Tukey test. *P < 0.05; **P < 0.01; ***P < 0.001; ****P < 0.0001.
Fig. 6.
Fig. 6.. Pharmacologic blockade of neuronal function.
(A) Tumor growth curve of C57Bl/6 mice orally implanted with MOC7 (HPV) tumors and treated with vehicle or fosaprepitant. N = 10 mice per group. Statistical analysis by Student’s t test. **P < 0.01; ***P < 0.001. (B) Quantification of metastases in the draining lymph nodes of mice from experiment in (A). (C) Representative photomicrographs of draining lymph nodes from the indicated conditions from mice in experiment A. Brown, cytokeratin IHC staining. Scale bar, 500 μm. Representative examples of HGSOC (D and E) and HNSCC (HPV) (F and G) electrical activity of tumor slices before and after treatment with lidocaine. Gray bars, before lidocaine; black bars, after lidocaine. N = 7 cases of HGSOC and n = 2 cases of HNSCC were evaluated. Insets, immunofluorescent (D and E; green; scale bar, 10 μm) or immunohistochemical (F and G; brown; scale bar 20 μm) staining for β-III tubulin of each sample. Arrows highlight nerves.

References

    1. P. D. Vermeer, Exosomal induction of tumor innervation. Cancer Res. 79, 3529–3535 (2019). - PMC - PubMed
    1. H. D. Reavis, H. I. Chen, R. Drapkin, Tumor innervation: Cancer has some nerve. Trends Cancer 6, 1059–1067 (2020). - PMC - PubMed
    1. S. M. Gysler, R. Drapkin, Tumor innervation: Peripheral nerves take control of the tumor microenvironment. J. Clin. Invest. 131, e147276 (2021). - PMC - PubMed
    1. A. C. Restaino, P. D. Vermeer, Neural regulations of the tumor microenvironment. FASEB Bioadv. 4, 29–42 (2022). - PMC - PubMed
    1. C. Magnon, S. J. Hall, J. Lin, X. Xue, L. Gerber, S. J. Freedland, P. S. Frenette, Autonomic nerve development contributes to prostate cancer progression. Science 341, 1236361 (2013). - PubMed

MeSH terms