. 2023 May 10;15(695):eadf6724.
doi: 10.1126/scitranslmed.adf6724. Epub 2023 May 10.

Immune checkpoint B7-H3 is a therapeutic vulnerability in prostate cancer harboring PTEN and TP53 deficiencies

Affiliations

Immune checkpoint B7-H3 is a therapeutic vulnerability in prostate cancer harboring PTEN and TP53 deficiencies

Wei Shi et al. Sci Transl Med. .

Abstract

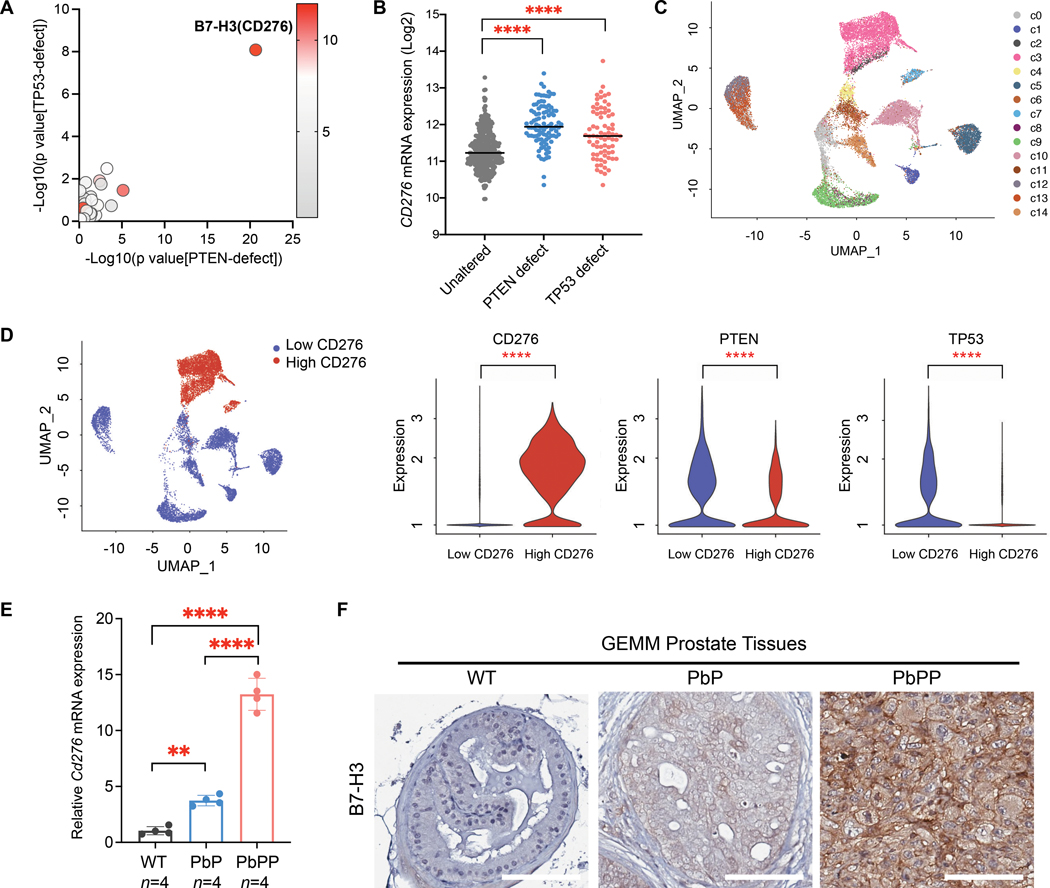
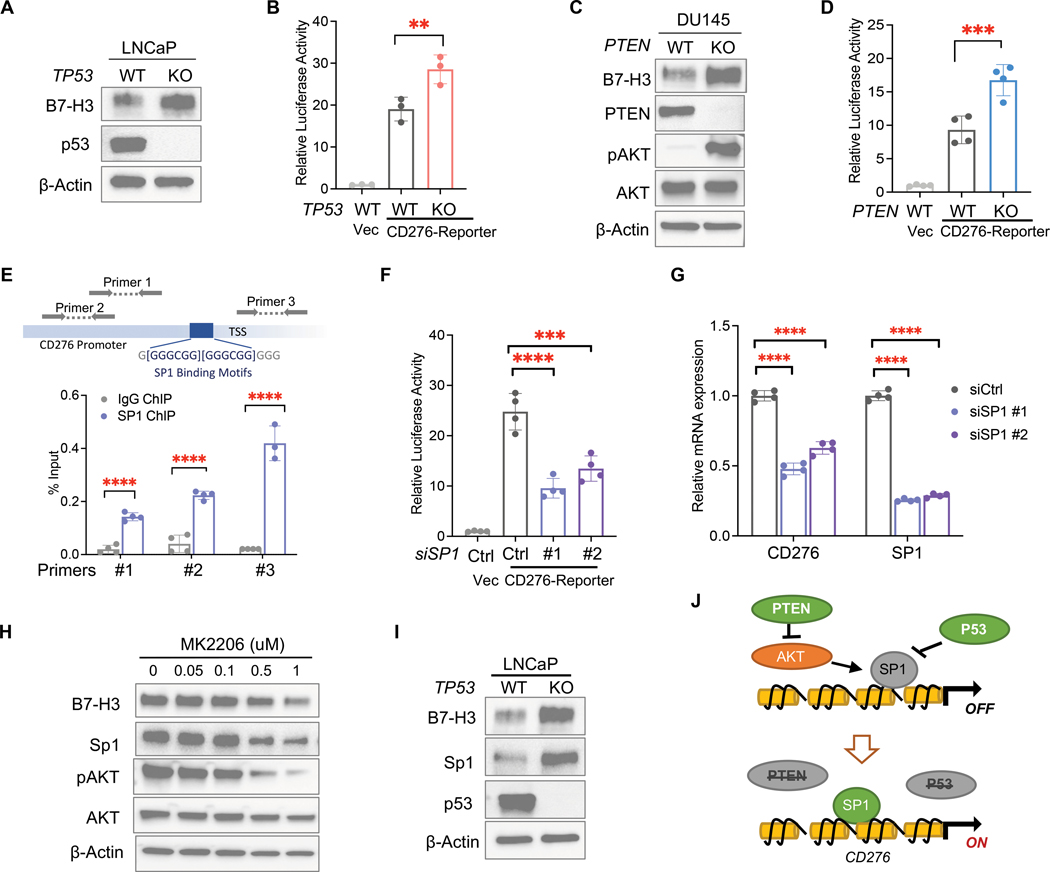
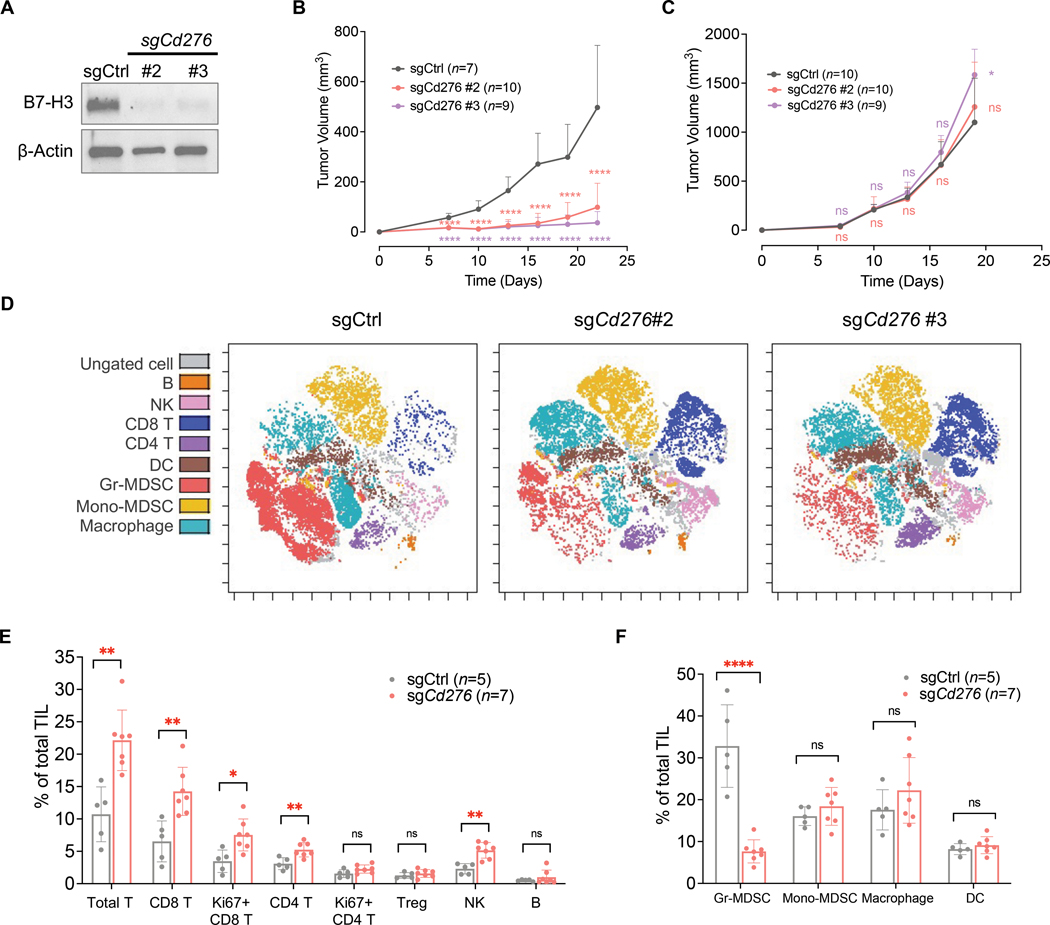
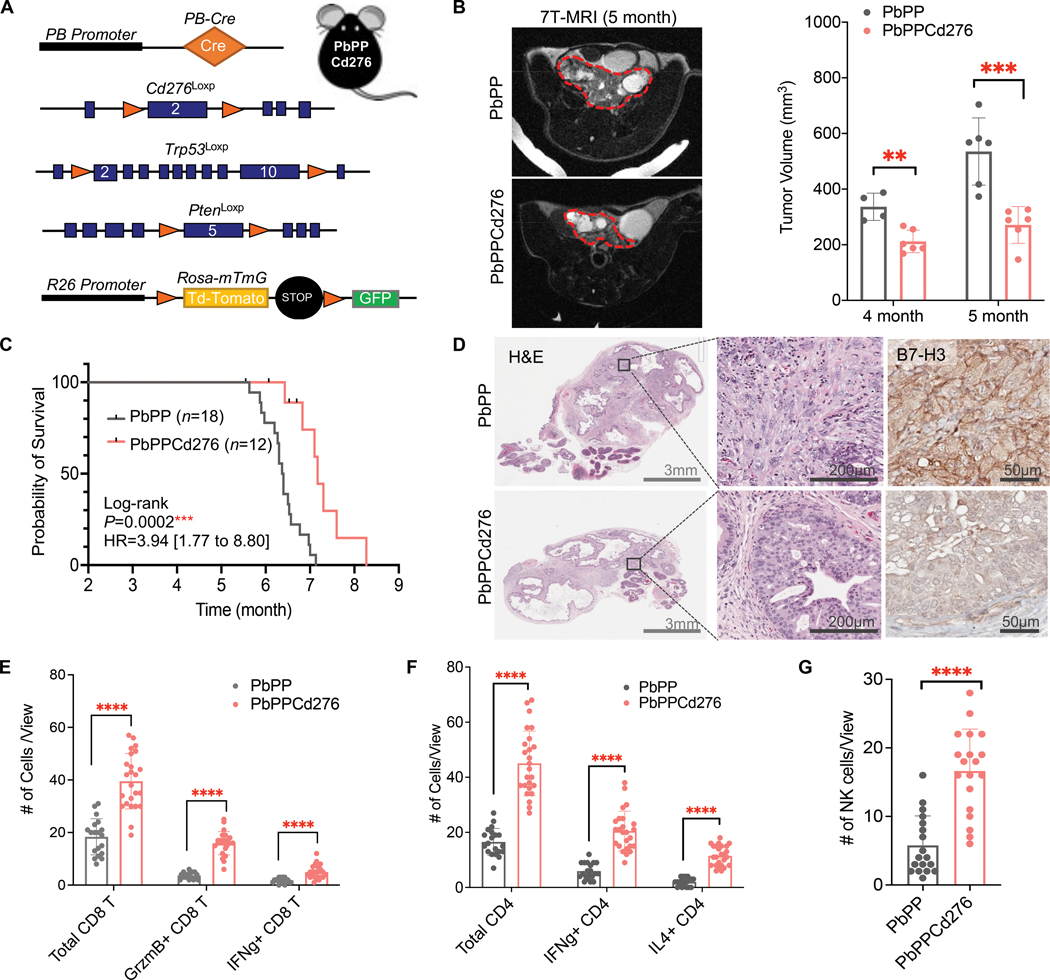
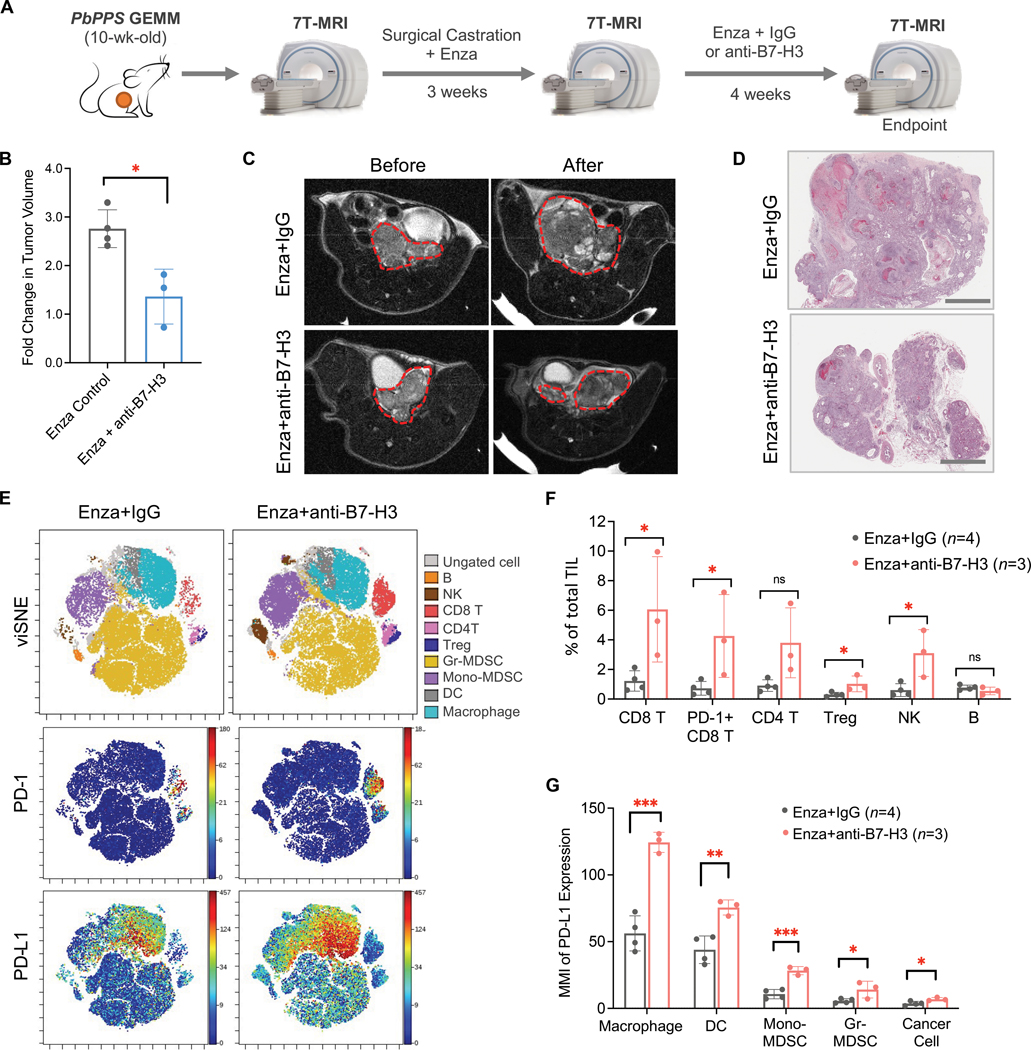
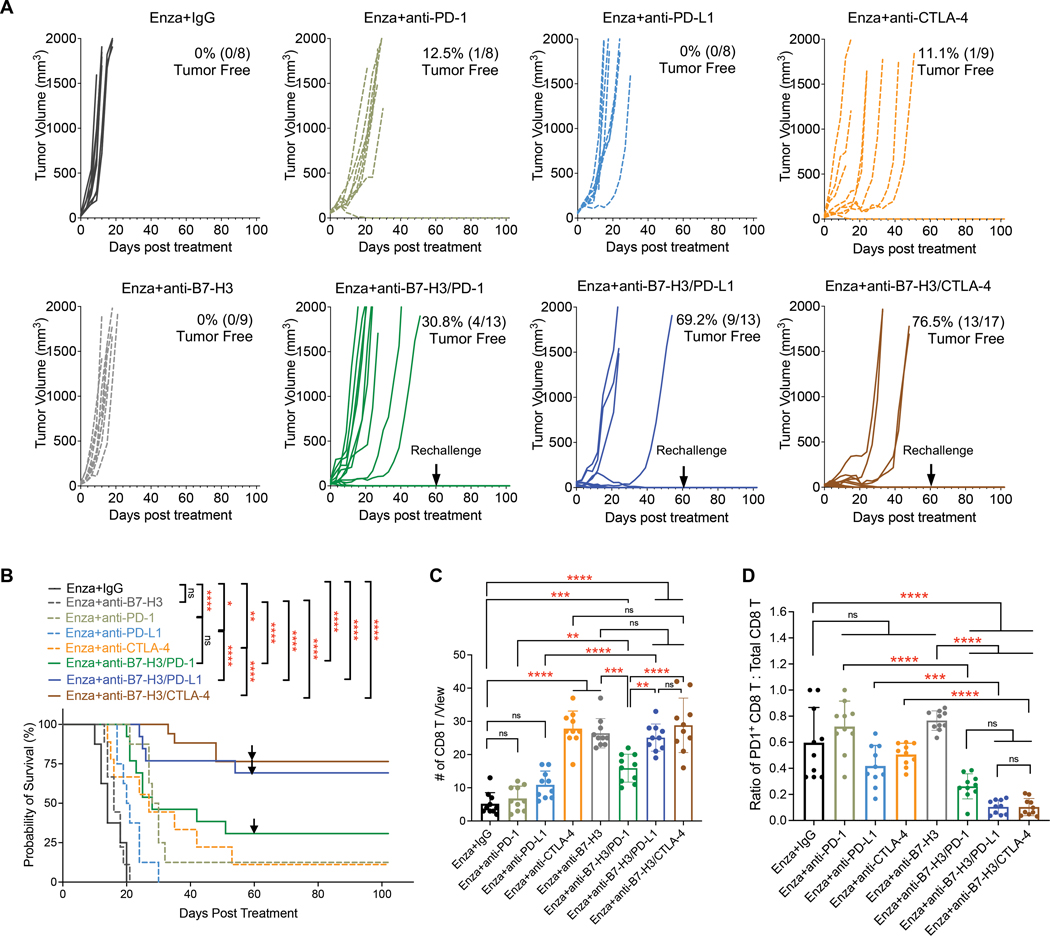
Checkpoint immunotherapy has yielded meaningful responses across many cancers but has shown modest efficacy in advanced prostate cancer. B7 homolog 3 protein (B7-H3/CD276) is an immune checkpoint molecule and has emerged as a promising therapeutic target. However, much remains to be understood regarding B7-H3's role in cancer progression, predictive biomarkers for B7-H3-targeted therapy, and combinatorial strategies. Our multi-omics analyses identified B7-H3 as one of the most abundant immune checkpoints in prostate tumors containing PTEN and TP53 genetic inactivation. Here, we sought in vivo genetic evidence for, and mechanistic understanding of, the role of B7-H3 in PTEN/TP53-deficient prostate cancer. We found that loss of PTEN and TP53 induced B7-H3 expression by activating transcriptional factor Sp1. Prostate-specific deletion of Cd276 resulted in delayed tumor progression and reversed the suppression of tumor-infiltrating T cells and NK cells in Pten/Trp53 genetically engineered mouse models. Furthermore, we tested the efficacy of the B7-H3 inhibitor in preclinical models of castration-resistant prostate cancer (CRPC). We demonstrated that enriched regulatory T cells and elevated programmed cell death ligand 1 (PD-L1) in myeloid cells hinder the therapeutic efficacy of B7-H3 inhibition in prostate tumors. Last, we showed that B7-H3 inhibition combined with blockade of PD-L1 or cytotoxic T lymphocyte-associated protein 4 (CTLA-4) achieved durable antitumor effects and had curative potential in a PTEN/TP53-deficient CRPC model. Given that B7-H3-targeted therapies have been evaluated in early clinical trials, our studies provide insights into the potential of biomarker-driven combinatorial immunotherapy targeting B7-H3 in prostate cancer, among other malignancies.


Conflict of interest statement

Competing Interests

A. Aparicio has performed consulting or advisory work for Sanofi Genzyme, Janssen Biotech, Inc., and Bristol-Myers Squibb. All other authors declare that they have no competing interests.

Figures

Figure 1.
Figure 1.. B7-H3(CD276) expression is elevated in tumors with PTEN and TP53 defects
(A) Correlation analyses of 53 immune checkpoints with genetic defects of PTEN or TP53 in human prostate tumors (TCGA). Differential expression of immune checkpoints in tumors with PTEN or TP53 defects were analyzed by Student’s t-test, and P values are presented on the X- or Y-axis, respectively. The color indicates the expression (Log2[RNA Seq V2 RSEM+1]) of immune checkpoints in tumors with PTEN or TP53 defects. (B) CD276 mRNA expression in prostate tumors containing PTEN or TP53 defects (TCGA dataset). One-way ANOVA with Tukey’s post hoc tests was performed using GraphPad Prism version 9.2.0..; ∗∗∗∗ P < 0.0001. (C) The CopyKat inferred copy number segmentation identified 14 luminal cell subclones in human prostate tumor samples (Single-cell transcriptional profiling data are from Chen et al., 2021 (41); n=12 patients). (D) The luminal cells were clustered by CD276 expression (left). PTEN and TP53 expression in CD276-low versus -high clusters are shown (right). Differential expression analysis was performed by the Wilcoxon rank-sum test. ∗∗∗∗ adjusted P < 0.0001. (E,F) B7-H3 expression in normal prostate (WT) and prostate tumors from PB-Cre; PtenL/L (PbP) and PB-Cre; PtenL/L; Trp53L/L (PbPP) mice, as determined by qPCR (E) and IHC (F). One-way ANOVA with Tukey’s post hoc tests were performed using GraphPad Prism version 9.2.0.; ∗∗∗∗ P < 0.0001. Scale bar, 100 µm.
Figure 2.
Figure 2.. Loss of PTEN and TP53 upregulates B7-H3(CD276) by activating Sp1
(A) Western blot analysis of B7-H3 in LNCaP cells (PTEN-null) with or without TP53 knockout. (B) Dual luciferase assay of vector (Vec) or pGL4 plasmid containing CD276 promoter (CD276-reporter) in LNCaP cells with or without TP53 knockout (n=3 per group). (C) Western blot analysis of B7-H3 in DU145 cells (TP53-deficient) with or without PTEN knockout. (D) Dual luciferase assay of vector or CD276-reporter in DU145 cells with or without PTEN knockout (n=4 per group). (E) Binding of Sp1 protein to the promoter region of the CD276 gene was determined using ChIP-qPCR (n=4 per group). Locations of primers in the CD276 gene promoter region are shown. TSS: transcription start site. (F,G) PTEN/p53-deficient LNCaP cells (PTEN-null; TP53 KO) were transfected with siRNA targeting SP1 or scrambled control, followed by dual luciferase assay of CD276-reporter (F) and qPCR of CD276 (G). Relative luciferase activities were normalized to vector control samples (n=4 per group). (H) Western blot analysis of B7-H3 and Sp1 in LNCaP cells treated with different doses of AKT inhibitor MK2206. (I) Western blot analysis of Sp1 and B7-H3 in LNCaP cells upon TP53 deletion. (J) Schematics of the mechanism by which PTEN-AKT and p53 pathways regulate B7-H3 expression. Data represent the mean ± SD. One-way ANOVA with Tukey’s post hoc tests (B, D, F, and G) and student’s t-tests (E) were performed using GraphPad Prism version 9.2.0.. ∗P < 0.05, ∗∗ P < 0.01, ∗∗∗ P < 0.001, ∗∗∗∗ P < 0.0001.
Figure 3.
Figure 3.. B7-H3 promotes PTEN/p53-deficient tumors and immunosuppression
(A) Cd276 was knocked out in the PTEN/p53-deficient syngeneic prostate cancer cell line DX1, which was derived from the PB-Cre; PtenL/L; Trp53L/L; Smad4L/L (PbPPS) GEMM model. B7-H3 protein expression was determined using Western blot analysis. (B) Tumor growth of control and B7-H3-depleted syngeneic tumors in immunocompetent C57BL/6 mice. (C) Growth of control and B7-H3-depleted tumors in immunodeficient NSG mice. Data represent the mean ± SD. One-way ANOVA with Tukey’s post hoc tests was performed using GraphPad Prism version 9.2.0.. ∗ P < 0.05, ∗∗∗∗ P < 0.0001. ns, not significant. (D, E, F) Immunoprofiling was performed in control and B7-H3-depleted syngeneic tumors derived from (B) using mass cytometry (CyTOF). Colored viSNE plots of CD45+ immune cells are presented (D). Quantification of tumor-infiltrating lymphocytes (E) and myeloid cells (F) is shown. TIL: Tumor Infiltrating Leukocytes. Data from sgCd276 #2 and #3 tumors were combined for statistical analysis. Data represent the mean ± SD. Student’s t-tests were performed using GraphPad Prism version 9.2.0. ∗ P < 0.05, ∗∗ P < 0.01, ∗∗∗∗ P < 0.0001. ns, not significant.
Figure 4.
Figure 4.. Prostate-specific Cd276 deletion GEMM model demonstrates B7-H3’s impact on prostate cancer progression
(A) GEMM model design: conditional knockout (KO) alleles of Cd276Loxp, PtenLoxp, and Trp53Loxp were crossed with prostate-specific PB-Cre and Rosa-mTmG to establish PB-Cre; PtenL/L; Trp53L/L; Cd276L/L (PbPPCd276) GEMM model. (B) Representative MRI images and tumor volume quantification of prostate tumors from PbPP and PbPPCd276 mice at four and five months of age (n ≥ 4 per group per age). Prostate tumor regions are circled with red dashed lines. (C) Kaplan–Meier survival curve of PbPP and PbPPCd276 mice. Statistical analysis by Log-rank (Mantel-Cox) test. (D) Histopathology analysis of prostate tumors from PbPP and PbPPCd276 mice at five months of age. H&E images at 1x (left) and 20x (middle) magnifications are presented. Depletion of B7-H3 was verified by IHC staining (right). Scale bars are indicated in each image. (E, F) Multiplex IHC staining and quantification of indicated CD8 T (E) and CD4 T (F) cells in prostate tumors from PbPP and PbPPCd276 mice ( n >10 individual views from 3–5 mice per group). Data represent the mean ± SD. (G) Immunofluorescence (IF) and quantification of NK (NK1.1+) cells in PbPP and PbPPCd276 tumors. Data represent the mean ± SD of >10 individual views. Student’s t-tests were performed using GraphPad Prism version 9.2.0. ∗P < 0.05, ∗∗ P < 0.01, ∗∗∗∗ P < 0.0001. ns, not significant.
Figure 5.
Figure 5.. Effects of B7-H3 inhibitor in preclinical models of PTEN/p53-deficient CRPC
(A) Schematics of treatment design using the CRPC GEMM model. PbPPS mice were surgically castrated, followed by treatment with enzalutamide (Enza) for three weeks. Tumor relapse was monitored by 7T-MRI. Mice were then treated with Enza in combination with B7-H3 inhibitor (MJ18, 300 μg/injection) for four weeks. Isotype IgG was used in the control group. (B,C,D) Fold changes in PbPPS CRPC tumor volume (B), representative MRI images (C), and histopathology analysis (D) after treatment. Prostate tumor regions are circled with red lines. n = 4 in Enza Control group and n = 3 in Enza+anti-B7-H3 group. Scale bars = 2mm. (E,F) Immunoprofiling of syngeneic tumors treated with Enza in combination with IgG or anti-B7-H3 using CyTOF. Colored viSNE plots of CD45+ immune cells and expression patterns of PD-1 and PD-L1 are shown (E). Quantification of tumor-infiltrating lymphocytes is presented (F). TIL: Tumor Infiltrating Leukocytes. (G) Expression of PD-L1 (Median Metal Intensity, MMI) in cancer cell and myeloid components after treatment. Data represent the mean ± SD. Student’s t-tests were performed using GraphPad Prism version 9.2.0. ∗ P < 0.05, ∗∗ P < 0.01, ∗∗∗ P < 0.001. ns, not significant.
Figure 6.
Figure 6.. B7-H3 inhibition combined with PD-L1 or CTLA-4 blockade achieves synergistic effects in PTEN/p53-deficient CRPC
(A) Growth of syngeneic CRPC tumors treated with Enza in combination with IgG, anti-B7-H3, anti-PD-1, anti-PD-L1, anti-CTLA-4, anti-B7-H3/PD-1, anti-B7-H3/PD-L1, and anti-B7-H3/CTLA-4. 1 × 106 DX1 cells were subcutaneously injected into male C57BL/6 mice. One week after injection, tumors formed and measured by calipers. Then, mice were treated with enzalutamide-admixed diet food and randomly assigned to different checkpoint inhibitor treatment groups. Monoclonal antibodies against B7-H3 (BE0124, 300 µg/injection), PD-1 (BE0273, 200 µg/injection), PD-L1 (BE0101, 200 µg/injection), and CTLA-4 (BE0131, 200 µg/injection) were administered i.p. as single agents or in combination every three days for six times in total. Isotype IgG was also used in control group. The numbers of tumor-free mice are shown. Black arrows showed the date of secondary tumor rechallenge in tumor-free mice. (B) Overall survival of mice treated with different combinations. The log-rank (Mantel-Cox) test was used for survival comparison (GraphPad Prism version 9.2.0.). Black arrows showed the date of secondary tumor rechallenge in tumor-free mice. (C,D) Multiplex IHC staining and quantification of total CD8 T (C) and the ratio of PD1+ CD8 T to total CD8 T (D) cells in tumors treated with single agents or combinations ( n = 10 individual views from two mice per group). Data represent the mean ± SD. One-way ANOVA with Tukey’s post hoc tests were performed using GraphPad Prism version 9.2.0.. ∗ P < 0.05, ∗∗ P < 0.01, ∗∗∗ P < 0.001, ∗∗∗∗ P < 0.0001. ns, not significant.

References

    1. Huggins C, Stevens RE Jr & Hodges CV, Studies on prostatic cancer II. The effects of castration on advanced carcinoma of the prostate gland. Arch. Surg 43, 209–223 (1941).
    1. Watson PA, Arora VK, Sawyers CL, Emerging mechanisms of resistance to androgen receptor inhibitors in prostate cancer. Nat Rev Cancer 15, 701–711 (2015). - PMC - PubMed
    1. Robinson D, Van Allen EM, Wu YM, Schultz N, Lonigro RJ, Mosquera JM, Montgomery B, Taplin ME, Pritchard CC, Attard G, Beltran H, Abida W, Bradley RK, Vinson J, Cao X, Vats P, Kunju LP, Hussain M, Feng FY, Tomlins SA, Cooney KA, Smith DC, Brennan C, Siddiqui J, Mehra R, Chen Y, Rathkopf DE, Morris MJ, Solomon SB, Durack JC, Reuter VE, Gopalan A, Gao J, Loda M, Lis RT, Bowden M, Balk SP, Gaviola G, Sougnez C, Gupta M, Yu EY, Mostaghel EA, Cheng HH, Mulcahy H, True LD, Plymate SR, Dvinge H, Ferraldeschi R, Flohr P, Miranda S, Zafeiriou Z, Tunariu N, Mateo J, Perez-Lopez R, Demichelis F, Robinson BD, Schiffman M, Nanus DM, Tagawa ST, Sigaras A, Eng KW, Elemento O, Sboner A, Heath EI, Scher HI, Pienta KJ, Kantoff P, de Bono JS, Rubin MA, Nelson PS, Garraway LA, Sawyers CL, Chinnaiyan AM, Integrative clinical genomics of advanced prostate cancer. Cell 161, 1215–1228 (2015). - PMC - PubMed
    1. Taylor BS, Schultz N, Hieronymus H, Gopalan A, Xiao Y, Carver BS, Arora VK, Kaushik P, Cerami E, Reva B, Antipin Y, Mitsiades N, Landers T, Dolgalev I, Major JE, Wilson M, Socci ND, Lash AE, Heguy A, Eastham JA, Scher HI, Reuter VE, Scardino PT, Sander C, Sawyers CL, Gerald WL, Integrative genomic profiling of human prostate cancer. Cancer cell 18, 11–22 (2010). - PMC - PubMed
    1. Aparicio AM, Shen L, Tapia EL, Lu JF, Chen HC, Zhang J, Wu G, Wang X, Troncoso P, Corn P, Thompson TC, Broom B, Baggerly K, Maity SN, Logothetis CJ, Combined Tumor Suppressor Defects Characterize Clinically Defined Aggressive Variant Prostate Cancers. Clin Cancer Res 22, 1520–1530 (2016). - PMC - PubMed

Publication types