. 2023 Jun 7;34(6):1105-1116.
doi: 10.1021/jasms.3c00050. Epub 2023 May 10.

Establishing Quality Control Procedures for Large-Scale Plasma Proteomics Analyses

Affiliations

Establishing Quality Control Procedures for Large-Scale Plasma Proteomics Analyses

Khiry L Patterson et al. J Am Soc Mass Spectrom. .

Abstract

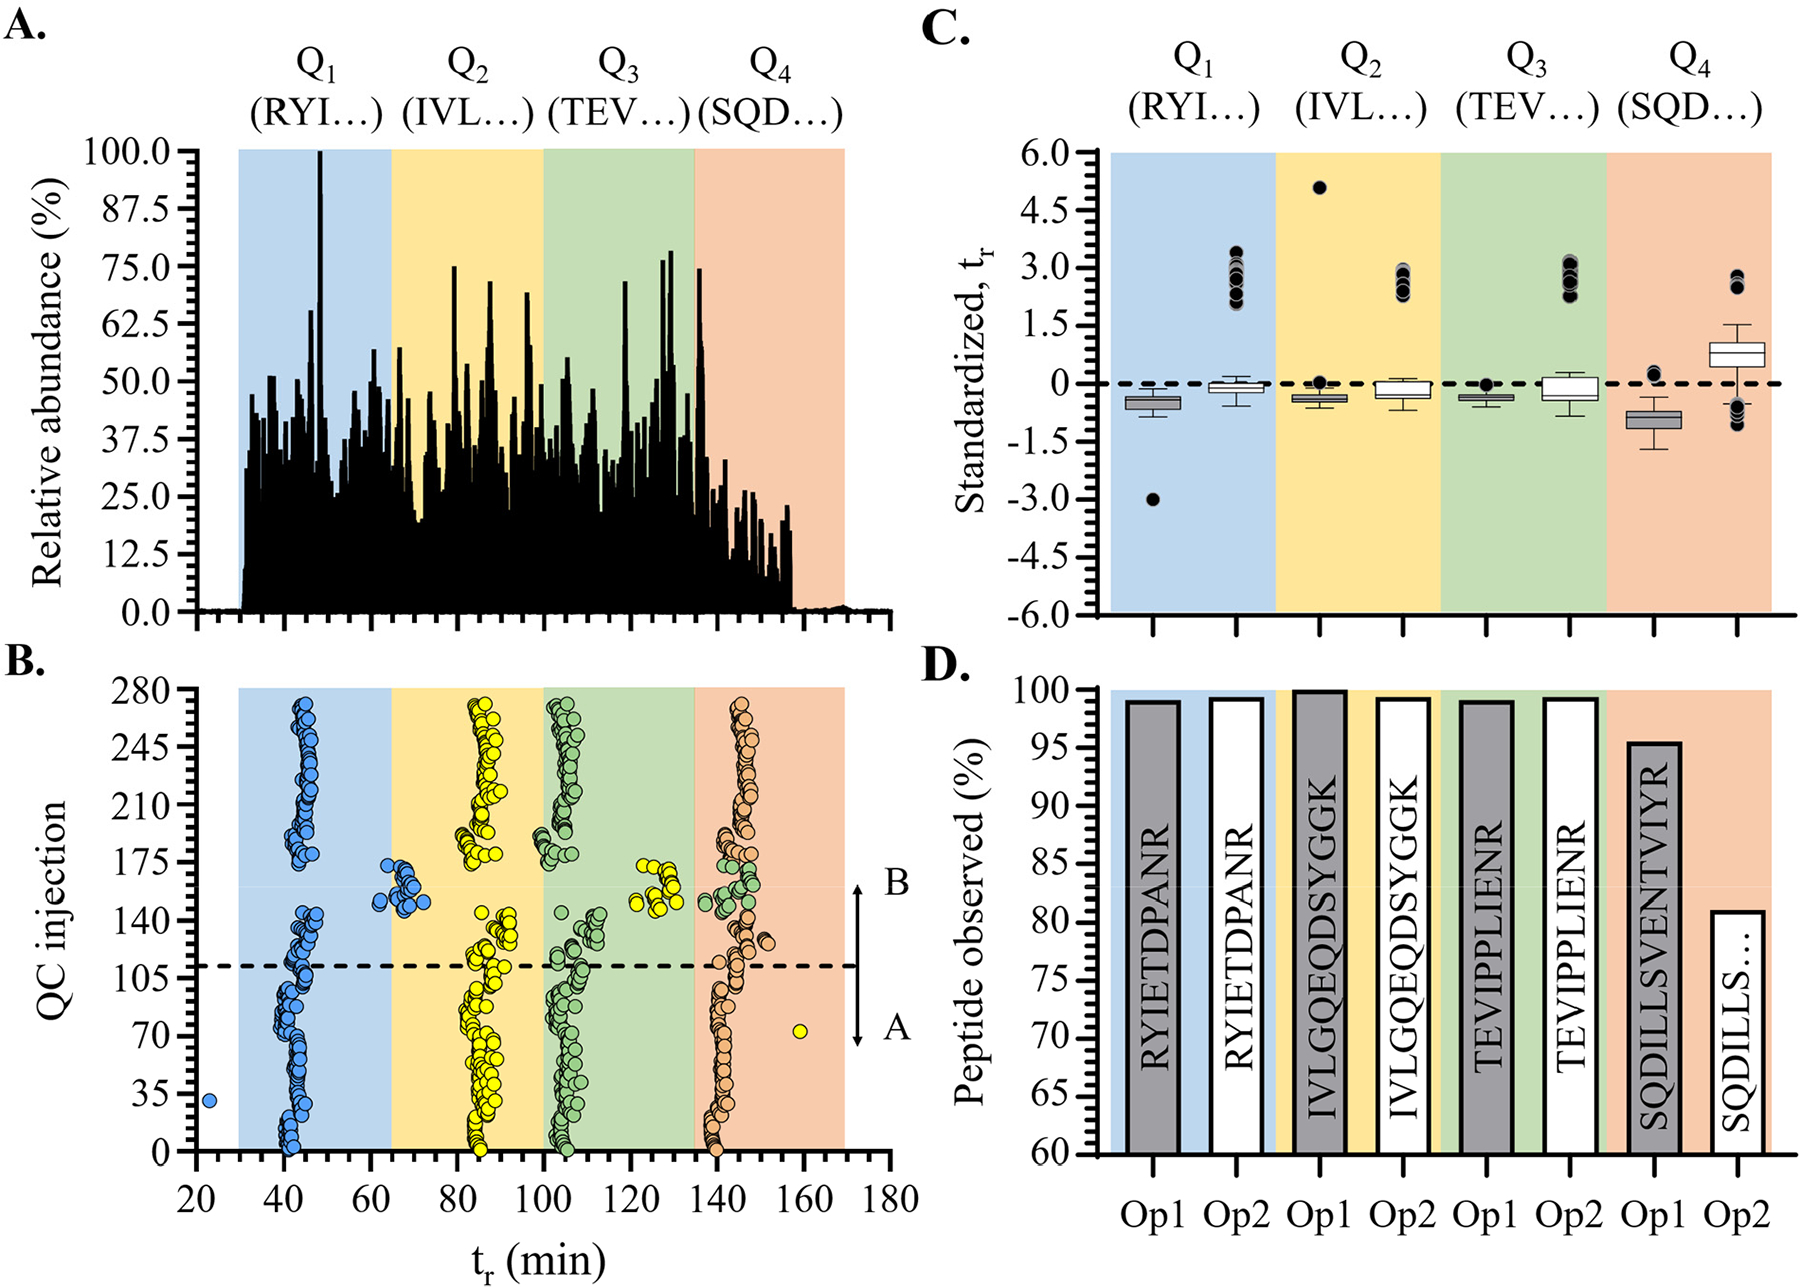
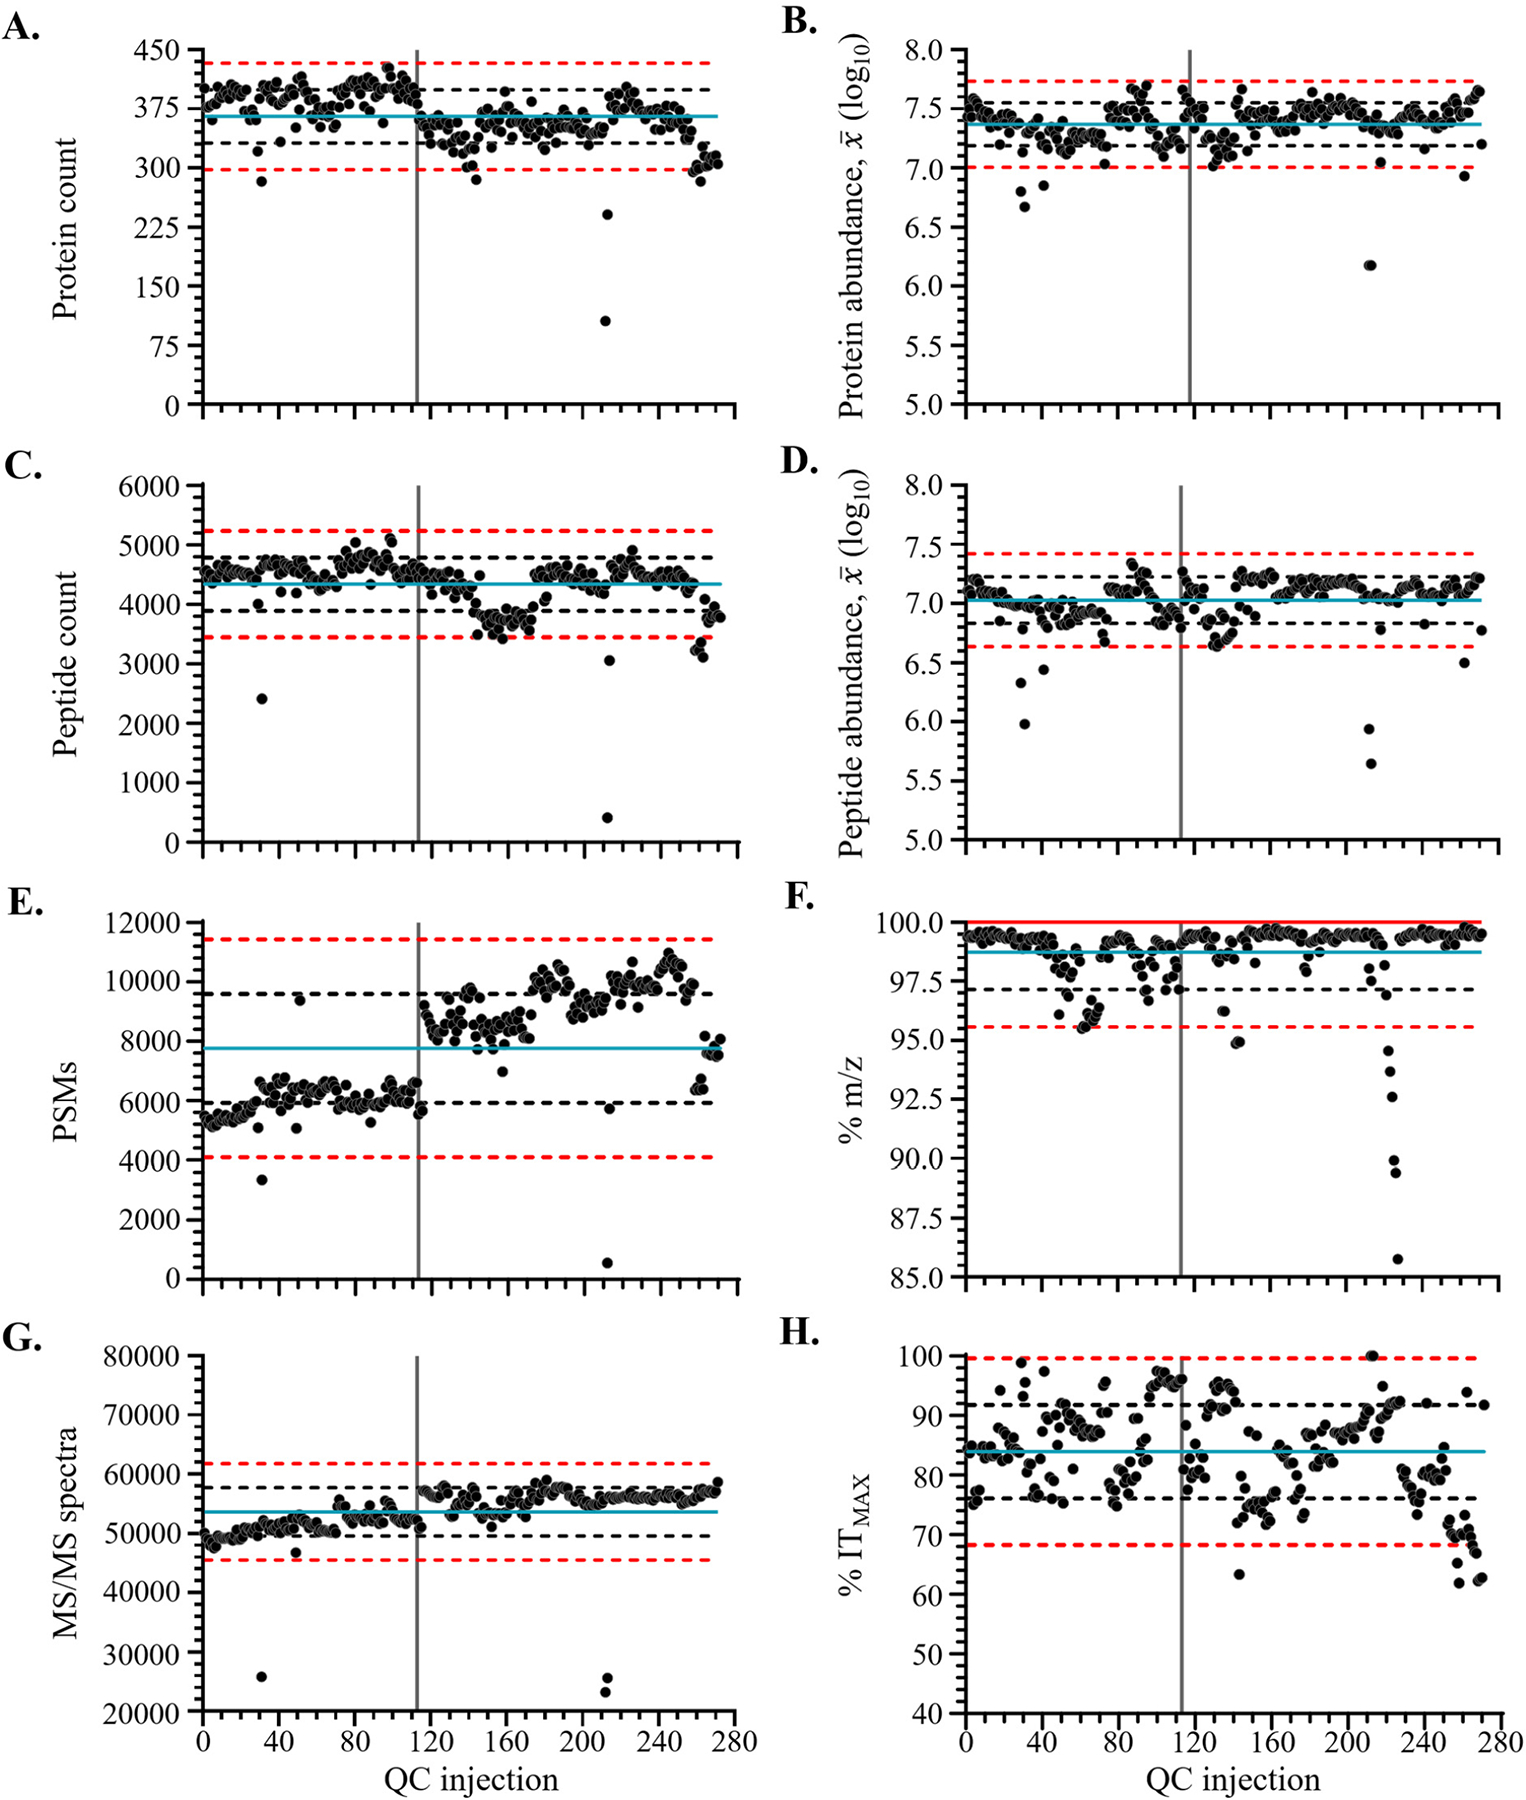
Proteomics research has been transformed due to high-throughput liquid chromatography (LC-MS/MS) tandem mass spectrometry instruments combined with highly sophisticated automated sample preparation and multiplexing workflows. However, scaling proteomics experiments to large sample cohorts (hundreds to thousands) requires thoughtful quality control (QC) protocols. Robust QC protocols can help with reproducibility, quantitative accuracy, and provide opportunities for more decisive troubleshooting. Our laboratory conducted a plasma proteomics study of a cohort of N = 335 patient samples using tandem mass tag (TMTpro) 16-plex batches. Over the course of a 10-month data acquisition period for this cohort we collected 271 pooled QC LC-MS/MS result files obtained from MS/MS analysis of a patient-derived pooled plasma sample, representative of the entire cohort population. This sample was tagged with TMTzero or TMTpro reagents and used to inform the daily performance of the LC-MS/MS instruments and to allow within and across sample batch normalization. Analytical variability of a number of instrumental and data analysis metrics including protein and peptide identifications, peptide spectral matches (PSMs), number of obtained MS/MS spectra, average peptide abundance, percent of peptides with a Δ m/z between ±0.003 Da, percent of MS/MS spectra obtained at the maximum injection time, and the retention time of selected tracking peptides were evaluated to help inform the design of a robust LC-MS/MS QC workflow for use in future cohort studies. This study also led to general tips for using selected metrics to inform real-time troubleshooting of LC-MS/MS performance issues with daily QC checks.

Keywords: liquid chromatography; mass spectrometry; plasma; proteins; proteomics; quality control.


Conflict of interest statement

The authors declare no competing financial interest.

Figures

Figure 1.
Figure 1.
Semiautomated plasma proteomics workflow highlighting incorporation of quality controls (QCs). A cohort of plasma samples (N = 335) was depleted offline and the unbound fraction was concentrated, quantified, digested, and desalted using an automated robotic liquid handler (Biomek i7). Equimolar aliquots of each sample were pooled together creating an Spool sample used to generate both a within batch QC sample (QCbatch) and daily instrument performance QC sample (QCpool). QCpool samples were generated from TMTzero labeled Spool aliquots. Patient samples (N = 15) and Spool aliquot (N = 1) were tagged with TMTpro–16plex reagents in a randomized fashion. This resulted in 23 batches total. The QCbatch channel was used for within batch and across batch normalization. TMTpro batches were fractionated into 24 fractions by high-pH reversed-phase fractionation and subjected to liquid chromatography tandem mass spectrometry (LC-MS/MS) analysis. The total LC-MS/MS acquisition time was 10 months and was conducted by two different operators (OpA and OpB). QCpool samples were not subjected to high-pH reversed-phase fractionation and injected daily onto the LC-MS/MS system. The daily injection order was (1) blank (LC-MS/MS grade water with 0.1% FA), (2) QCpool, (3) blank, (4) fraction i in duplicate, (5) fraction j in duplicate, and (6) fraction k in duplicate, where i, j, and k = 1–23, randomized. The injection order was repeated daily through competition of all 24 fractions in duplicate per batch. A total of 271 QC search result files (OpA = 112, OpB = 159) were used to evaluate overall LC-MS/MS performance. Created with BioRender.com.
Figure 2.
Figure 2.
(A) An example extracted chromatogram of base peak ions from QCpool injection #8. The chromatogram is divided into quadrants Q1 (30–65 min), Q2 (65–100 min), Q3 (100–135 min), Q4 (135–170 min). (B) A scatter plot of the observed retention time (tR, min) for the quadrant Q1 peptide RYIETDPANR, Q2 peptide IVLGQEQDSYGGK, Q3 peptide TEVIPPLIENR, and Q4 peptide SQDILLSVENTVIYR. (C) Box and whisker plots of the standardized tR for each tracking peptide for OpA is shaded gray and OpB is white. The standardized tR was calculated by dividing (x¯xi) by the corresponding tR standard deviation across operators per tracked peptide, where x¯ is the average tR across both operators and xi is the observed tR. (D) A bar graph of the percentage of data sets acquired from OpA (N = 112) and OpB (N = 159) where each individual tracking peptide was detected in the full MS scan. The total number of data sets each individual tracking peptide was detected for OpsA and B, respectively, were 111 and 158 (RYIETDPANR), 112 and 158 (IVLGQEQDSYGGK), 111 and 158 (TEVIPPLIENR), and 107 and 129 (SQDILLSVENTVIYR). Data collected under OpA and OpB are indicated by the gray and white bars, respectively.
Figure 3.
Figure 3.
Scatter plots of the selected metrics across QCpool injections (N = 271). These metrics included (A) identified protein count, (B) identified peptide count, (C) protein abundance (x¯), (D) peptide abundance (x¯), (E) peptide spectral match (PSMs) count, (F) the percentage of identified peptides with a Δm/z between ±0.003 Da (%m/z), (G) MS/MS spectra count, and (H) the percentage of peptides identified at the maximum MS/MS injection time (%ITmax). Operator B began acquisition at QC injection #114 indicated by a gray vertical line. The average value across both operators for each metric, ±1σ, and ±2σ are indicated by the solid blue, dashed black, and dashed red lines, respectively. For the metric %m/z, the maximum value limit indicated by the solid red line was less than +1σ and +2σ.
Figure 4.
Figure 4.
Principal component analysis (PCA) plots of selected quality control metrics. Each plot was generated by performing PCA analysis using the variable pair, protein count and (A) peptide count, (B) peptide abundance (x¯), (C) peptide spectral matches (PSMs), (D) the percentage of identified peptides with a Δm/z between ±0.003 Da (%m/z), (E) the number of MS/MS spectra obtained, and (F) the percentage of peptides identified at the maximum MS/MS injection time (%ITmax). QC data entries from OpA and OpB are colored blue and orange, respectively. Confidence ellipses (95%) are represented by the black dashed line.
Figure 5.
Figure 5.
Quality control workflow. An illustration of a 24 h LC-MS/MS workflow optimized for the following quality control sequence performed prior to queuing any sample injection: (1) blank, (2) QCpool, (3) blank. The QCpool raw file is then database searched and the liquid chromatography and mass spectrometry metrics extracted and applied to the QC assessment. N number of sample injections including additional number of replicates are queued only after a successful navigation through the pass/fail QC assessment workflow. Created with BioRender.com.

References

    1. Enroth S; Berggrund M; Lycke M; Broberg J; Lundberg M; Assarsson E; Olovsson M; Stalberg K; Sundfeldt K; Gyllensten U High throughput proteomics identifies a high-accuracy 11 plasma protein biomarker signature for ovarian cancer. Commun. Biol 2019, 2, 221. - PMC - PubMed
    1. Dubois C; Payen D; Simon S; Junot C; Fenaille F; Morel N; Becher F Top-Down and Bottom-Up Proteomics of Circulating S100A8/S100A9 in Plasma of Septic Shock Patients. J. Proteome Res 2020, 19 (2), 914–925. - PubMed
    1. Sharma NK; Ferreira BL; Tashima AK; Brunialti MKC; Torquato RJS; Bafi A; Assuncao M; Azevedo LCP; Salomao R Lipid metabolism impairment in patients with sepsis secondary to hospital acquired pneumonia, a proteomic analysis. Clin. Proteomics 2019, 16, 29. - PMC - PubMed
    1. Solimani F; Didona D; Li J; Bao L; Patel PM; Gasparini G; Kridin K; Cozzani E; Hertl M; Amber KT Characterizing the proteome of bullous pemphigoid blister fluid utilizing tandem mass tag labeling coupled with LC-MS/MS. Arch Dermatol Res. 2022, 314 (9), 921–928. - PubMed
    1. Sperk M; van Domselaar R; Rodriguez JE; Mikaeloff F; Sa Vinhas B; Saccon E; Sonnerborg A; Singh K; Gupta S; Vegvari A; Neogi U Utility of Proteomics in Emerging and Re-Emerging Infectious Diseases Caused by RNA Viruses. J. Proteome Res 2020, 19 (11), 4259–4274. - PMC - PubMed

LinkOut - more resources