

The potential for clinical application of automatic quantification of olfactory bulb volume in MRI scans using convolutional neural networks
- PMID: 37163913
- PMCID: PMC10193118
- DOI: 10.1016/j.nicl.2023.103411
The potential for clinical application of automatic quantification of olfactory bulb volume in MRI scans using convolutional neural networks
Abstract
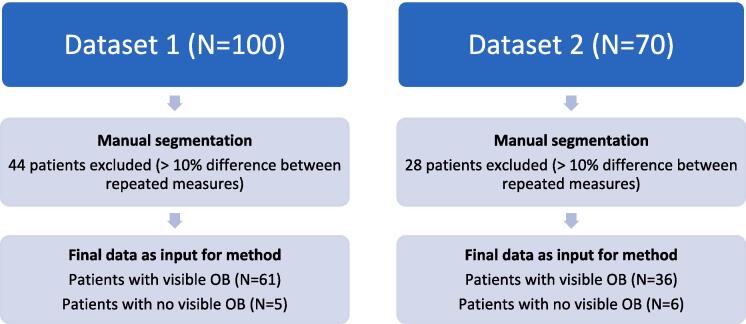
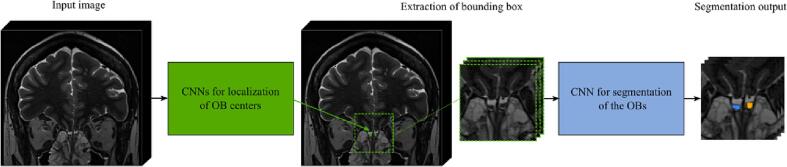
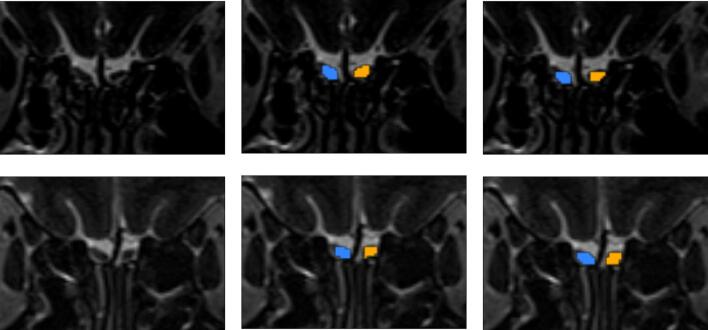
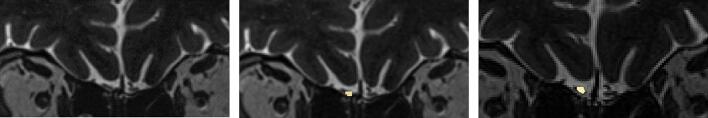
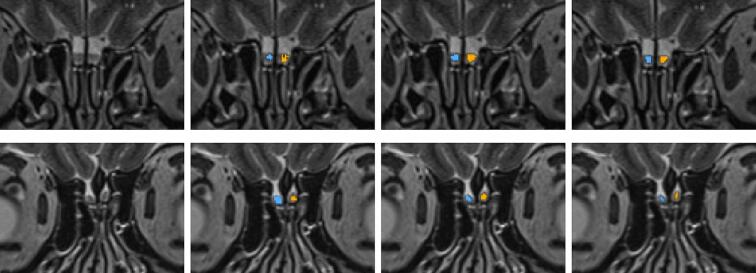
The olfactory bulbs (OBs) play a key role in olfactory processing; their volume is important for diagnosis, prognosis and treatment of patients with olfactory loss. Until now, measurements of OB volumes have been limited to quantification of manually segmented OBs, which is a cumbersome task and makes evaluation of OB volumes in large scale clinical studies infeasible. Hence, the aim of this study was to evaluate the potential of our previously developed automatic OB segmentation method for application in clinical practice and to relate the results to clinical outcome measures. To evaluate utilization potential of the automatic segmentation method, three data sets containing MR scans of patients with olfactory loss were included. Dataset 1 (N = 66) and 3 (N = 181) were collected at the Smell and Taste Center in Ede (NL) on a 3 T scanner; dataset 2 (N = 42) was collected at the Smell and Taste Clinic in Dresden (DE) on a 1.5 T scanner. To define the reference standard, manual annotation of the OBs was performed in Dataset 1 and 2. OBs were segmented with a method that employs two consecutive convolutional neural networks (CNNs) that the first localize the OBs in an MRI scan and subsequently segment them. In Dataset 1 and 2, the method accurately segmented the OBs, resulting in a Dice coefficient above 0.7 and average symmetrical surface distance below 0.3 mm. Volumes determined from manual and automatic segmentations showed a strong correlation (Dataset 1: r = 0.79, p < 0.001; Dataset 2: r = 0.72, p = 0.004). In addition, the method was able to recognize the absence of an OB. In Dataset 3, OB volumes computed from automatic segmentations obtained with our method were related to clinical outcome measures, i.e. duration and etiology of olfactory loss, and olfactory ability. We found that OB volume was significantly related to age of the patient, duration and etiology of olfactory loss, and olfactory ability (F(5, 172) = 11.348, p < 0.001, R2 = 0.248). In conclusion, the results demonstrate that automatic segmentation of the OBs and subsequent computation of their volumes in MRI scans can be performed accurately and can be applied in clinical and research population studies. Automatic evaluation may lead to more insight in the role of OB volume in diagnosis, prognosis and treatment of olfactory loss.
Keywords: Convolutional neural networks; Deep learning; Olfactory bulb volume; Olfactory loss; Segmentation.
Copyright © 2023 The Author(s). Published by Elsevier Inc. All rights reserved.
Conflict of interest statement
Declaration of Competing Interest The authors declare that they have no known competing financial interests or personal relationships that could have appeared to influence the work reported in this paper.
Figures

Similar articles
-
Automated olfactory bulb segmentation on high resolutional T2-weighted MRI.Neuroimage. 2021 Nov 15;242:118464. doi: 10.1016/j.neuroimage.2021.118464. Epub 2021 Aug 10. Neuroimage. 2021. PMID: 34389442 Free PMC article.
-
Automatic Segmentation of the Olfactory Bulb.Brain Sci. 2021 Aug 28;11(9):1141. doi: 10.3390/brainsci11091141. Brain Sci. 2021. PMID: 34573163 Free PMC article.
-
Deeply supervised 3D fully convolutional networks with group dilated convolution for automatic MRI prostate segmentation.Med Phys. 2019 Apr;46(4):1707-1718. doi: 10.1002/mp.13416. Epub 2019 Feb 19. Med Phys. 2019. PMID: 30702759 Free PMC article.
-
The olfactory bulb volume in patients with idiopathic Parkinson's disease.Eur J Neurol. 2015 Jul;22(7):1068-73. doi: 10.1111/ene.12709. Epub 2015 Apr 23. Eur J Neurol. 2015. PMID: 25912367
-
Brain segmentation in patients with perinatal arterial ischemic stroke.Neuroimage Clin. 2023;38:103381. doi: 10.1016/j.nicl.2023.103381. Epub 2023 Mar 17. Neuroimage Clin. 2023. PMID: 36965456 Free PMC article.
Cited by
-
Clinical significance of MRI-measured olfactory bulb height as an imaging biomarker of idiopathic Parkinson's disease.PLoS One. 2024 Oct 28;19(10):e0312728. doi: 10.1371/journal.pone.0312728. eCollection 2024. PLoS One. 2024. PMID: 39466765 Free PMC article.
-
Preliminary Findings on the Morphometric Characteristics of the Olfactory Bulb in the Cat.Animals (Basel). 2024 Dec 12;14(24):3590. doi: 10.3390/ani14243590. Animals (Basel). 2024. PMID: 39765495 Free PMC article.
-
Mechanisms, diagnosis, and treatment of olfactory dysfunction in rhinosinusitis.Eur J Med Res. 2025 Jun 11;30(1):474. doi: 10.1186/s40001-025-02740-y. Eur J Med Res. 2025. PMID: 40500803 Free PMC article. Review.
References
Publication types
MeSH terms
LinkOut - more resources
Full Text Sources
Miscellaneous
