. 2023 Jul 5;111(13):2065-2075.e5.
doi: 10.1016/j.neuron.2023.04.013. Epub 2023 May 9.

Reinstating olfactory bulb-derived limbic gamma oscillations alleviates depression-like behavioral deficits in rodents

Affiliations

Reinstating olfactory bulb-derived limbic gamma oscillations alleviates depression-like behavioral deficits in rodents

Qun Li et al. Neuron. .

Abstract

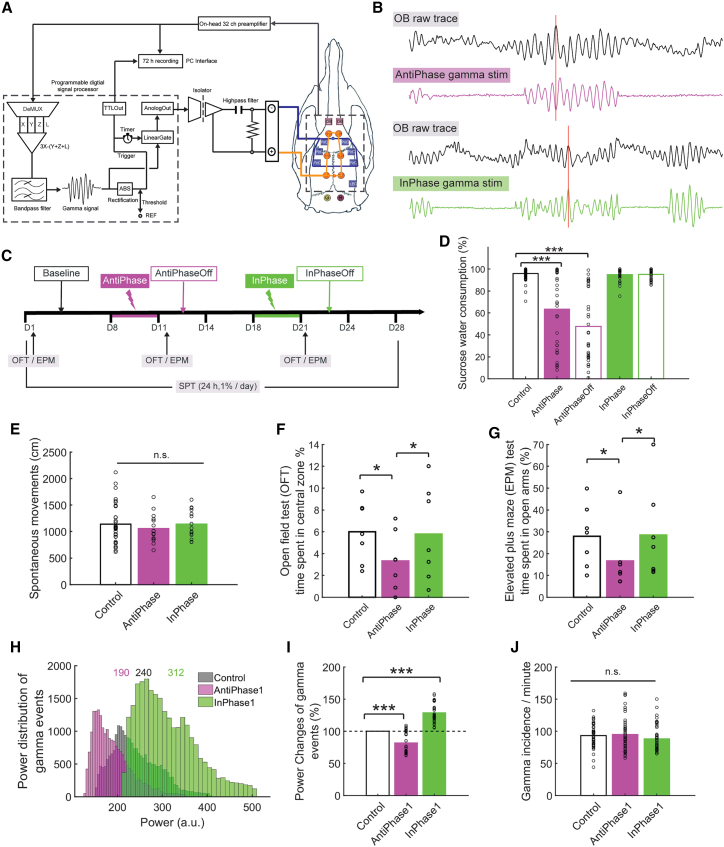
Although the etiology of major depressive disorder remains poorly understood, reduced gamma oscillations is an emerging biomarker. Olfactory bulbectomy, an established model of depression that reduces limbic gamma oscillations, suffers from non-specific effects of structural damage. Here, we show that transient functional suppression of olfactory bulb neurons or their piriform cortex efferents decreased gamma oscillation power in limbic areas and induced depression-like behaviors in rodents. Enhancing transmission of gamma oscillations from olfactory bulb to limbic structures by closed-loop electrical neuromodulation alleviated these behaviors. By contrast, silencing gamma transmission by anti-phase closed-loop stimulation strengthened depression-like behaviors in naive animals. These induced behaviors were neutralized by ketamine treatment that restored limbic gamma power. Taken together, our results reveal a causal link between limbic gamma oscillations and depression-like behaviors in rodents. Interfering with these endogenous rhythms can affect behaviors in rodent models of depression, suggesting that restoring gamma oscillations may alleviate depressive symptoms.

Keywords: OBx; closed loop; depression; electrical stimulation; gamma oscillation; miniSOG; olfactory bulb; optogenetics; rat.


Conflict of interest statement

Declaration of interests A.B. and A.J.N. are the owners of Amplipex LLC (Szeged, Hungary), a manufacturer of signal-multiplexed neuronal amplifiers. A.B. is a shareholder, chairman, and CEO; O.D. is the advisor and director; and G.B. is a shareholder of Neunos, Inc. (Boston, MA, USA), a company developing neurostimulator devices.

Figures

Figure 1
Figure 1
Chemogenetic inhibition of olfactory bulb neuronal activity reduces local gamma oscillations and induces depression-like behaviors (A) Major projections of the olfactory bulb (OB). (B) Top panel, represents LFPs (0.5 s) of OB and piriform cortex (PirC) from an awake rat, and LFPs in PirC after olfactory bulbectomy (OBx). Bottom panel, coherence and power spectrum corresponding to signals shown on the top panel. (C) Representative fluorescent images of the mouse olfactory bulb following injections of AAV5-hSyn-hM4Di-mCherry. (D) Schematics and timeline of the chemogenetic inhibition of OB gamma oscillations. (E) Effect of systemic administration of clozapine N-oxide (CNO) on OB gamma power of hM4Di and mCherry expressing mice, respectively (see Figure S2 for the same protocols carried out in the rats). (F) Schematics and timeline of the chemogenetic inhibition of OB for behavioral tests. (G) Effects of CNO on the total distance traveled in the open field test (OFT) for the hM4Di and mCherry expressing mice, respectively. The tests were performed before CNO administration (Pre), following 30 days of systemic CNO administration (1 month CNO) and following 30 days after the cessation of the CNO treatment (1 month break) (n = 7 animals/group). (H) Decreased time spent in the center zone during the OFT of the hM4Di group 1 month after CNO treatment (n = 7/group). Results of both mean value and statistical tests are reported in detail in Tables S1 and S2. n.s. indicates non-significant difference. ∗∗ and ∗∗∗ indicate differences of p < 0.01 and p < 0.001, respectively.
Figure 2
Figure 2
Suppressing OB to PirC synaptic transmission decreases gamma power in the PirC and deteriorates performance in the sucrose preference test (A) Schematics of the experiments and construct design for CALI (chromophore-assisted light inactivation) used for the specific inhibition of OB to the PirC synaptic transmission. (B) Fluorescent images showing mCherry expression in PirC targeting OB neurons and their axonal projections. (C) The suppression of gamma power in the PirC lasted for around 2 h after one-time illumination (450 nm light with 20 Hz for 9 min at 9 mW at the tip). Upper panels show gamma band spectrograms (30–80 Hz) before, 1 h after (1 h) and 4 h after the illumination (4 h). Bottom panel shows quantified gamma power changes in various conditions. (D) Power spectra of the OB LFPs before and during the first 4 h following illumination. (E) Schematics of the behavioral tests following the suppression of OB to PirC synaptic transmission using miniSOG. (F) Photostimulation of the PirC of miniSOG expressing rats (WD + 2 h SPT + L) decreased sucrose water consumption (120 trials from five rats/group). See performance of individual rats in Figure S5A. (G–J) Correlations between the disrupted sucrose preference performance and gamma power decrements in the PirC and the OB of the injected group (G and H) and the non-injected group (I and J) after photostimulation, respectively. Values are represented as mean ± SD. Each marker represents an individual animal. n.s. indicates not significant difference. ∗∗∗ indicates difference of p < 0.001. Abbreviations: OFT, open field test; EPM, elevated plus maze; WD, 22 h water deprivation; SPT, sucrose preference test; L, Illumination.
Figure 3
Figure 3
Real-time silencing of OB-derived gamma oscillations to the PirC phase-dependently induces anhedonia in naive rats (A) Schematics of closed-loop neuromodulation of the PirC with OB-derived gamma oscillations in real time. Orange circles represent miniature machine screws as cathodal (i.e., returning) electrodes. Squares indicate temporal cranial windows through which the recording and stimulating electrodes were introduced. Blue ones were for the PirC and lateral entorhinal cortex (LEC), while purple ones were for OB. Abbreviations: DeMUX, demultiplexing, artifacts were removed from the selected channel X (from OB) by subtracting averaged signals in the left (Y) and right (Z) PirC, and lateral entorhinal cortex/ventral hippocampus (L). (B) Representative LFP raw traces of OB and two derivatives for different phase stimulation (anti-phase, in-phase). Detected OB gamma oscillations were fed to the PirC with anti-phase and in-phase, respectively. Red vertical lines indicate positive peaks of original gamma oscillations in the OB. “Upward” signal represent neuronal activity (following the EEG polarity conventions) and cathodal current on the OB and stimulus traces, respectively. (C) The schema of the experiment. Each stimulation was carried out for 3 days continuously, followed by an additional 3 days without stimulation (OFF days). (D) Anti-phase stimulation significantly decreased sucrose water preference in the naive rats, and the effects lasted for 1–4 days even after termination of the stimulus. See also the individual trials in Figures S7B and S7C. In-phase stimulation did not decrease sucrose water consumption. (E) No significant side-effects of the e-stim on spontaneous movements in the homecage was observed (5 trials from four rats/group). (F and G) Anti-phase stimulation decreased the time spent in the central zone of the OFT (F) and the time spent in the open arms of the EPM test (G) in the naive rats, whereas in-phase stimulation did not alter them (n = 7 rats/group). (H) Power distribution of gamma events in the PirC on the day before the first stimulation (Base), during the first day after anti-phase stimulation ended (AntiPhase1) and during the first day after in-phase stimulation ended (InPhase1). The numbers represent medians of the distributions. See also individual five trials in the Figure S8. (I) Anti-phase stimulation significantly decreased power of gamma events in the PirC whereas in-phase stimulation increased it. (J) No significant differences of incidence of gamma events between Base, AntiPhase1 and InPhase1 in the awake state. See also time course of the gamma power changes in the PirC during in Figures S9A and S9D, gamma power changes in multiple limbic brain areas with in-phase and anti-phase stimulation in Figures S9B, S9C, S9E, and S9F and correlation map of gamma power changes in multiple limbic brain areas in Figure S9G. Each circle represents a single trial, bars indicate the population mean. n.s. indicates no significant difference. and ∗∗∗ indicate difference of p < 0.05 and p < 0.001, respectively.
Figure 4
Figure 4
Ketamine alleviates depression-like behaviors by restoring limbic gamma oscillations (A) Schematics of the experiment. (B) Ketamine improves the decreased sucrose preference following closed-loop anti-phase PirC e-stim (n = 7 rats/group). (C–F) Ketamine alleviates the anxiety-like behaviors in the EPM test induced by the closed-loop anti-phase PirC e-stim. (G) Increased PirC gamma power following ketamine administration. For gamma power changes in various other limbic brain areas following ketamine administration see Figure S10. Circles indicate individual trials. n.s. indicates not significant difference. , ∗∗, and ∗∗∗ indicate difference of p < 0.05, p < 0.01, and p < 0.001, respectively.
Figure 5
Figure 5
Reinstating OB-derived gamma oscillations to the PirC phase-dependently alleviates depression-like behaviors (A) Schematics of the experiment. (B) LPS decreased the sucrose preference in both groups by systemic administration of lipopolysaccharide (LPS). In-phase stimulation recovered the decreased SPT performance in the post stimulation days. See also performances of individual rats during the two in-phase stimulation sessions in Figure S11 (n = 6 rats/group). (C–I) In-phase stimulation alleviated the depression-like behaviors in the OFT (C–E) and the anxiety-like behaviors in the EPM test (F–I) induced by the LPS administration. Note that anti-phase stimulation failed to reproduce these behavioral benefits. Values are presented as mean ± SD. Circles indicate individual trials. n.s. indicates not significant difference. , ∗∗, and ∗∗∗ indicate difference of p < 0.05, p < 0.01, and p < 0.001, respectively.

References

    1. Belmaker R.H., Agam G. Major depressive disorder. N. Engl. J. Med. 2008;358:55–68. doi: 10.1056/NEJMra073096. - DOI - PubMed
    1. Santomauro D.F., Herrera A.M.M., Shadid J., Zheng P., Ashbaugh C., Pigott D.M., Abbafati C., Adolph C., Amlag J.O., Aravkin A.Y. Global prevalence and burden of depressive and anxiety disorders in 204 countries and territories in 2020 due to the COVID-19 pandemic. Lancet. 2021;398:1700–1712. - PMC - PubMed
    1. Braun C., Bschor T., Franklin J., Baethge C. Suicides and suicide attempts during long-term treatment with antidepressants: a meta-analysis of 29 placebo-controlled studies including 6,934 patients with major depressive disorder. Psychother. Psychosom. 2016;85:171–179. - PubMed
    1. Ioannidis J.P. Effectiveness of antidepressants: an evidence myth constructed from a thousand randomized trials? Philos. Ethics Humanit. Med. 2008;3:14. - PMC - PubMed
    1. Sharma T., Guski L.S., Freund N., Gøtzsche P.C. Suicidality and aggression during antidepressant treatment: systematic review and meta-analyses based on clinical study reports. BMJ. 2016;352:i65. - PMC - PubMed

Publication types

LinkOut - more resources