. 2023 May 25;186(11):2392-2409.e21.
doi: 10.1016/j.cell.2023.04.007. Epub 2023 Apr 13.

The T-cell-directed vaccine BNT162b4 encoding conserved non-spike antigens protects animals from severe SARS-CoV-2 infection

Affiliations

The T-cell-directed vaccine BNT162b4 encoding conserved non-spike antigens protects animals from severe SARS-CoV-2 infection

Christina M Arieta et al. Cell. .

Abstract

T cell responses play an important role in protection against beta-coronavirus infections, including SARS-CoV-2, where they associate with decreased COVID-19 disease severity and duration. To enhance T cell immunity across epitopes infrequently altered in SARS-CoV-2 variants, we designed BNT162b4, an mRNA vaccine component that is intended to be combined with BNT162b2, the spike-protein-encoding vaccine. BNT162b4 encodes variant-conserved, immunogenic segments of the SARS-CoV-2 nucleocapsid, membrane, and ORF1ab proteins, targeting diverse HLA alleles. BNT162b4 elicits polyfunctional CD4+ and CD8+ T cell responses to diverse epitopes in animal models, alone or when co-administered with BNT162b2 while preserving spike-specific immunity. Importantly, we demonstrate that BNT162b4 protects hamsters from severe disease and reduces viral titers following challenge with viral variants. These data suggest that a combination of BNT162b2 and BNT162b4 could reduce COVID-19 disease severity and duration caused by circulating or future variants. BNT162b4 is currently being clinically evaluated in combination with the BA.4/BA.5 Omicron-updated bivalent BNT162b2 (NCT05541861).

Keywords: COVID-19; HLA ligandomics; SARS-CoV-2; T cell responses; immune protection; mRNA T cell vaccine; vaccine design; viral variants.


Conflict of interest statement

Declaration of interests U.S. and Ö.T. are management board members and employees at BioNTech SE. R.B.G., Board of Directors, Alkermes plc, Infinity Pharmaceuticals, and Zai Laboratory, and Scientific Advisory Board, Leap Therapeutics; consultant Third Rock Ventures, stockholder and employee of BioNTech US. C.M.A., Y.J.X., D.A.R., H.D., D.H., S.M., K.M., B.K., T.E.S., A.L., A.Z., S.A.K., C.I.C.C., S.H., A.P.H., T.Z., Y.L.-L., K.W., A.B.V., J.R.S., S.F., K.T., K.W., T.A.A., Ö.T., U.S., R.B.G., and A.P. are either current or past employees of BioNTech SE or BioNTech US, are stockholders, and/or are inventors on patents and patent applications related to RNA technology and COVID-19 vaccines.

Figures

None
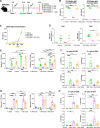
Graphical abstract
Figure 1
Figure 1
Antigen selection and design of BNT162b4 (A) Schematic of BNT162b4 containing highly immunogenic segments of the SARS-CoV-2 N (green) and M proteins (blue), and short segments containing minimal epitopes from the ORF1ab NSPs 1–4 (lime-green). (B) Epitope counts reported in contemporaneous literature circa September 2020 and December 2022. See STAR Methods section for references. (C–G) Predicted epitope presentation from Poran et al., 2020.. (H) Regions of ORF1ab NSP1 reported as immunogenic in contemporaneous literature circa September 2020. For plots (C)–(H), lines represent the number of unique peptide-HLA pairs at each residue along the viral protein, and the shaded regions represent the number of unique peptide-HLA pairs contained entirely within the segment included in BNT162b4. (I) Schematic summarizing non-synonymous mutations in the S protein (top) and along BNT162b4 (bottom) from past and currently circulating variants. Amino acid substitutions are indicated along BNT162b4. Length of proteins are to scale. SP, signal peptide; S1-NTD, N-terminal domain of S1 subunit of the S protein; RBD, receptor-binding domain; S1-CTD, C-terminal domain of S1 subunit of the S protein; S2, S2 subunit of the S protein; TM, transmembrane domain. Lists of variant mutations are retrieved from: WHO, CoVariants, Cov-lineages, or BV-BRC. See also Figure S1.
Figure S1
Figure S1
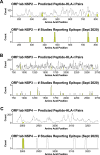
Antigen selection and design of BNT162b4, related to Figure 1 Segments of (A) ORF1ab NSP2, (B) NSP3, and (C) NSP4 selected for inclusion in BNT162b4 based on predicted HLA-I epitope density (top; Poran et al., 202048) and regions of each antigen cited as immunogenic in the literature circa September 2020 (bottom). Lines represent the number of unique peptide-HLA pairs at each point along the viral protein, and the shaded regions represent the number of unique peptide-HLA pairs contained entirely within the selected segment. The x axis numbering is based on the full length ORF1ab polyprotein with numbers indicating amino acid position.
Figure 2
Figure 2
BNT162b4 is a source of HLA-presented epitopes as directly measured by mass spectrometry (A) 19 unique BNT162b4-derived epitopes were detected by targeted mass spectrometry, with at least one epitope coming from each encoded SARS-CoV-2 antigen. (B and C) (B) Isotopically encoded peptides were used to generate chromatographs with each color representing a unique fragment ion specific to the indicated peptide (arrows indicate apex of chromatographic peak), and (C) head-to-toe plots that confirm matching retention time, matching fragmentation pattern, and specificity to only BNT162b4 transfected samples (shown is epitope #18: ORF1ab PTDNYITTY on A01:01). Epitope sequence and allele restriction can be found in Table 1. Additional chromatographs, head-to-toe plots, and complete DDA results can be found in the raw data repository (see data and code availability).
Figure S2
Figure S2
BNT162b4 is a source of HLA-presented epitopes as directly measured by mass spectrometry, related to Figure 2 (A) Chromatographic traces for immunodominant ORF1ab epitopes PTDYNYITTY and TTDPSFLGRY, which were observed to be presented on all alleles tested (except A11:01) in this study. Each color represents a unique fragment ion specific to the indicated peptide. Arrows indicate apex of chromatographic peak. (B) Retention time comparison of epitope peptides with nesting sequences. (C) BNT162b4 overlaid with MS-observed epitopes and Kyte-Doolittle hydropathy scoring. Scores range from −4.5 (more hydrophilic) to 4.5 (more hydrophobic).
Figure 3
Figure 3
T-cell immunogenicity of BNT162b4 (A) Schematic of immunogenicity experiment (n = 6 animals/group). (B) IFN-ɣ ELISpot data from peptide-pulsed splenocytes at day 14 after a prime immunization only, in triplicate. The N protein pool contained 39 peptides, the M pool contained 22 peptides, and the ORF1ab pool contained 19 peptides. (C) IFN-ɣ ELISpot data from peptide-pulsed splenocytes at day 35 after two doses of BNT162b2, triplicate. (D) Flow phenotyping and intracellular staining on CD8+ T cells and CD4+ T cells in day 35 splenocytes pulsed with M peptide pools. (E) Flow phenotyping and intracellular staining on CD8+ T cells and CD4+ T cells inday 35 splenocytes pulsed with N peptide pools. Statistical significance was assessed by one-way ANOVA with Dunnett’s multiple comparison post-test. Multiplicity-adjusted p values are shown. p ≤ 0.05, ∗∗p ≤ 0.01, ∗∗∗p ≤ 0.001, ∗∗∗∗p < 0.0001. Error bars indicate standard error of the mean (SEM). See also Figures S3 and S4.
Figure S3
Figure S3
Cytokine secretion profile of BNT162b4-immunized HLA-A2.1 Tg animals, related to Figure 3 (A) Th1 and Th2 cytokine levels in supernatants from M protein peptide-pulsed splenocytes analyzed via electrochemiluminescence immunoassay (ECLIA). (B) Th1 and Th2 cytokine levels in supernatants from N protein peptide-pulsed splenocytes analyzed via electrochemiluminescence immunoassay (ECLIA). Statistical significance was assessed by one-way ANOVA with Dunnett’s multiple comparison post-test. Multiplicity-adjusted p values are shown. p ≤ 0.05, ∗∗p ≤ 0.01, ∗∗∗p ≤ 0.001, ∗∗∗∗p < 0.0001. Error bars indicate standard error of the mean (SEM).
Figure S4
Figure S4
Immunogenicity of BNT162b4 in K18-hACE2 C57BL/6 mouse model, related to Figure 3 (A) Schematic of the immunogenicity experiment (n = 7–8 animals per group). (B) IFN-ɣ ELISpot data from peptide-pulsed splenocytes at day 35 after two doses of BNT162b2, performed in triplicate. (C) Flow phenotyping and intracellular staining on CD8+ and CD4+ T cells of day 35 splenocytes pulsed with M peptide pools, performed in triplicate. (D) Flow phenotyping and intracellular staining on CD8+ and CD4+ T cells of day 35 splenocytes pulsed with N peptide pools. (E) Th1 and Th2 cytokine levels in supernatants from M protein peptide-pulsed splenocytes analyzed via electrochemiluminescence immunoassay (ECLIA). (F) Th1 and Th2 cytokine levels in supernatants from N protein peptide-pulsed splenocytes analyzed via ECLIA. Statistical significance was assessed by one-way ANOVA with Dunnett’s multiple comparison post-test. Multiplicity-adjusted p values are shown. p ≤ 0.05, ∗∗p ≤ 0.01, ∗∗∗p ≤ 0.001, ∗∗∗∗p < 0.0001. Error bars indicate standard error of the mean (SEM).
Figure S5
Figure S5
Immunogenicity of BNT162b4 combined with BNT162b2 in BALB/c mouse model, related to Figure 3 (A) Schematic of the combination immunogenicity experiment (n = 8 animals per group). (B) S protein S1-specific IgG titers from immunized animals, all dilutions performed in duplicate. (C) Kinetics of S1-specific IgG development. (D) Neutralizing antibody titers of immunized animals at day 14 and day 35. (E) IFN-ɣ ELISpot from peptide-pulsed splenocytes either pulsed with an N-terminal S protein peptide pool (right) or a C-terminal S protein peptide pool (left), performed in triplicate. (F) Polyfunctional CD8+ (left) or CD4+ (right) T cells reactive against either an S protein N-terminal (top) or C-terminal (bottom) peptide pool. (G) IFN-ɣ ELISpot from peptide-pulsed splenocytes either pulsed with an N peptide pool (left) or an M peptide pool (right). (H) Polyfunctional CD8+ (left) or CD4+ (right) T cells reactive against either an N (top) or M (bottom) peptide pool. Statistical significance was assessed by one-way ANOVA with Dunnett’s multiple comparison post-test. Multiplicity-adjusted p values are shown. p ≤ 0.05, ∗∗p ≤ 0.01, ∗∗∗p ≤ 0.001, ∗∗∗∗p < 0.0001. LLOD: lower limit of detection. Error bars indicate standard error of the mean (SEM).
Figure 4
Figure 4
Impact of pre-existing BNT162b2 immunogenicity on vaccination with BNT162b4 combined with BNT162b2 (A) Schematic of in vivo experiment to assess impact of pre-existing S-specific immune responses (n = 4–8 mice/group). (B) S protein S1-specific IgG titers at day 56 after vaccination, all dilutions performed in duplicate. (C) S protein S1-IgG kinetics throughout treatment. (D) 50% pseudovirus neutralization (pVN50) geometric mean titers (GMTs) against SARS-CoV-2 wild type strain in sera collected 14 days post-dose 3, showing lower limit of detection (LLOD). (E) IFN-ɣ ELISpot T cell responses with peptide-pulsed splenocytes using an S protein peptide pool, triplicate. (F) Polyfunctional CD8+ and CD4+ T cells from splenocytes peptide-pulsed using an S protein peptide pool. (G) IFN-ɣ ELISpot T cell responses from splenocytes peptide-pulsed with BNT162b4-related peptide pools, triplicate. Statistical significance was assessed by one-way ANOVA with Dunnett’s multiple comparison post-test. Multiplicity-adjusted p values are shown. p ≤ 0.05, ∗∗p ≤ 0.01, ∗∗∗p ≤ 0.001, ∗∗∗∗p < 0.0001. Error bars indicate standard error of the mean (SEM). See also Figures S5 and S6.
Figure S6
Figure S6
Impact of pre-existing BNT162b2 immunity on vaccination with BNT162b4 co-administered with BNT162b2 in K18-hACE2 mice, related to Figure 4 (A) Schematic of the in vivo experiment to assess impact of pre-existing BNT162b2 immune responses (n = 6 animals per group). (B) S protein S1-specific IgG titers at day 56 after treatment, all dilutions performed in duplicate. (C) S protein S1-IgG kinetics throughout treatment. (D) Neutralizing titers of immunized animals at day 56 using a pVNT assay. (E) IFN-ɣ ELISpot T-cell responses with peptide-pulsed splenocytes using an S protein peptide pool, performed in triplicate. (F) Multimer staining for S-specific T cells in peripheral blood. (G) IFN-ɣ ELISpot T-cell responses from splenocytes peptide-pulsed with BNT162b4-related peptide pools. (H) Memory phenotype of S-specific T cells in the draining lymph nodes. The vehicle group was gated on total CD8+ T cells. Statistical significance was assessed by one-way ANOVA with Dunnett’s multiple comparison post-test. Multiplicity-adjusted p values are shown. p ≤ 0.05, ∗∗p ≤ 0.01, ∗∗∗p ≤ 0.001, ∗∗∗∗p < 0.0001. Error bars indicate standard error of the mean (SEM).
Figure 5
Figure 5
Impact of BNT162b4 on the S-specific TCR repertoire and T cell phenotype (A) Schematic of single-cell RNA sequencing experiment to generate GEX, CITE, and VDJ libraries of S-specific T cells of immunized animals (n = 4 animals/group). (B) Representative plot of flow sorting gating for S-specific T cells for multimodal scRNA-seq using MHC tetramers. (C) Clonotype network of largest clones (≥5 cells) from animals immunized with either three doses of BNT162b2 or 2 doses of BNT162b2 followed by a dose of combined BNT162b2 and BNT162b4. Each circle represents a unique CDR3 clone (both alpha/beta considered); circle size represents the number of cells with the corresponding TCR clone; connected circles represent clonotype clusters with similar CDR3 sequences. (D) Number of unique T cells in each treatment group belonging to clones containing 1, 2, 3, or ≥4 cells. (E) UMAP representation of single-cell transcriptomes from sorted T cells, colored by either cluster assignment (top) or experimental group (bottom). (F) Normalized and scaled cell surface expression of CITE-seq analysis of selected memory and activation markers. (G) Heatmap of top differentially expressed (sorted by t test score) genes by cluster. Color scale indicates mean expression in the group. (H) Cluster composition of cells from each treatment group. (I) Gene set enrichment analysis of differentially enriched gene sets comparing immunized animals to control animals and between groups immunized with BNT162b2 alone versus a combination of BNT162b2 and BNT162b4. Color scale indicates normalized enrichment score (NES).
Figure 6
Figure 6
BNT162b4 confers protective immunity in a golden Syrian hamster model (A) Schematic of in vivo efficacy model in golden Syrian hamsters (n = 10 animals/group). (B) Body weight change post challenge with WT SARS-CoV-2 in immunized animals. (C) TCID50 viral titers from lung homogenates and nasal turbinates homogenates, day 2 post-infection, measurements in quadruplicate. (D) Body weight change post challenge with Delta SARS-CoV-2 strain in immunized animals following the experimental schematic in (A). (E) TCID50 viral titers from lung homogenates and nasal turbinates homogenates, day 2 post-infection from half of each cohort challenged with the Delta SARS-CoV-2 strain. (F) Body weight change post challenge with Omicron BA.1 SARS-CoV-2 strain in immunized animals following the experimental schematic in (A). (G) TCID50 viral titers from lung homogenates and nasal turbinates homogenates, day 2 post-infection from half of the cohort challenged with the Omicron BA.1 SARS-CoV-2 strain, measurements in quadruplicate. Statistical significance was assessed by one-way ANOVA with Dunnett’s multiple comparison post-test. Multiplicity-adjusted p values are shown. p ≤ 0.05, ∗∗p ≤ 0.01, ∗∗∗p ≤ 0.001, ∗∗∗∗p < 0.0001. LLOD, lower limit of detection. Error bars indicate standard error of the mean (SEM). See also Figure S7.
Figure S7
Figure S7
Lung pathology of golden Syrian hamsters post challenge with WT SARS-CoV-2, related to Figure 6 H&E staining from lungs of WT SARS-CoV2-infected animals 7 days post-infection: 1.3× magnification (A) and 10× magnification (B). SARS-CoV-2-related microscopic findings are characterized by dark staining consolidated areas; any areas perceived as dark in Groups 2 and 5 are considered artificial airway collapse due to poor formalin inflation. Histopathological score of lung tissue from infected animals 7 days post-infection for (C) inflammation, (D) hyperplasia, and (E) edema. Score was determined based on the percentage of findings in each area for each animal based on the following scoring: 0 – no pathological change; 1 – minimal <10% affected area; 2 – mild 10–25% area, 3 – moderate 25–50% area, 4 – marked 50–95% area. Statistical significance was assessed by one-way ANOVA with Dunnett’s multiple comparison post-test. Multiplicity-adjusted p values are shown. p ≤ 0.05, ∗∗p ≤ 0.01, ∗∗∗p ≤ 0.001, ∗∗∗∗p < 0.0001. Error bars indicate standard error of the mean (SEM).

Similar articles

Cited by

References

    1. Cao Y., Jian F., Wang J., Yu Y., Song W., Yisimayi A., Wang J., An R., Chen X., Zhang N., et al. Imprinted SARS-CoV-2 humoral immunity induces convergent Omicron RBD evolution. Nature. 2023;614:521–529. doi: 10.1038/s41586-022-05644-7. - DOI - PMC - PubMed
    1. Cao Y., Wang J., Jian F., Xiao T., Song W., Yisimayi A., Huang W., Li Q., Wang P., An R., et al. Omicron escapes the majority of existing SARS-CoV-2 neutralizing antibodies. Nature. 2022;602:657–663. doi: 10.1038/s41586-021-04385-3. - DOI - PMC - PubMed
    1. Jian F., Yu Y., Song W., Yisimayi A., Yu L., Gao Y., Zhang N., Wang Y., Shao F., Hao X., et al. Further humoral immunity evasion of emerging SARS-CoV-2 BA.4 and BA.5 subvariants. Lancet Infect. Dis. 2022;22:1535–1537. doi: 10.1016/S1473-3099(22)00642-9. - DOI - PMC - PubMed
    1. Kurhade C., Zou J., Xia H., Cai H., Yang Q., Cutler M., Cooper D., Muik A., Jansen K.U., Xie X., et al. Neutralization of Omicron BA.1, BA.2, and BA.3 SARS-CoV-2 by 3 doses of BNT162b2 vaccine. Nat. Commun. 2022;13:3602. doi: 10.1038/s41467-022-30681-1. - DOI - PMC - PubMed
    1. Muik, A., Lui, B.G., Diao, H., Fu, Y., Bacher, M., Toker, A., Grosser, J., Ozhelvaci, O., Grikscheit, K., Hoehl, S., et al. (2022). Progressive Loss of Conserved Spike Protein Neutralizing Antibody Sites in Omicron Sublineages Is Balanced by Preserved T-Cell Recognition Epitopes. bioRxiv, 2022.2012.2015.520569. 10.1101/2022.12.15.520569

Supplementary concepts

Associated data