Phage display sequencing reveals that genetic, environmental, and intrinsic factors influence variation of human antibody epitope repertoire
- PMID: 37164013
- PMCID: PMC12166656
- DOI: 10.1016/j.immuni.2023.04.003
Phage display sequencing reveals that genetic, environmental, and intrinsic factors influence variation of human antibody epitope repertoire
Abstract
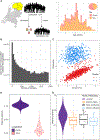
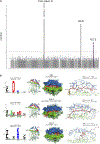
Phage-displayed immunoprecipitation sequencing (PhIP-seq) has enabled high-throughput profiling of human antibody repertoires. However, a comprehensive overview of environmental and genetic determinants shaping human adaptive immunity is lacking. In this study, we investigated the effects of genetic, environmental, and intrinsic factors on the variation in human antibody repertoires. We characterized serological antibody repertoires against 344,000 peptides using PhIP-seq libraries from a wide range of microbial and environmental antigens in 1,443 participants from a population cohort. We detected individual-specificity, temporal consistency, and co-housing similarities in antibody repertoires. Genetic analyses showed the involvement of the HLA, IGHV, and FUT2 gene regions in antibody-bound peptide reactivity. Furthermore, we uncovered associations between phenotypic factors (including age, cell counts, sex, smoking behavior, and allergies, among others) and particular antibody-bound peptides. Our results indicate that human antibody epitope repertoires are shaped by both genetics and environmental exposures and highlight specific signatures of distinct phenotypes and genotypes.
Keywords: PhIP-seq; antibody repertoire; environment; genetics; lifestyle.
Copyright © 2023 Elsevier Inc. All rights reserved.
Conflict of interest statement
Declaration of interests R.K.W. acted as consultant for Takeda, received unrestricted research grants from Takeda, Johnson & Johnson, Tramedico, and Ferring, and received speaker fees from MSD, Abbvie, and Janssen Pharmaceuticals.
Figures


Similar articles
-
Phage Immunoprecipitation Sequencing (PhIP-Seq) for Analyzing Antibody Epitope Repertoires Against Food Antigens.Methods Mol Biol. 2024;2717:101-122. doi: 10.1007/978-1-0716-3453-0_7. Methods Mol Biol. 2024. PMID: 37737980
-
Phage-display immunoprecipitation sequencing of the antibody epitope repertoire in inflammatory bowel disease reveals distinct antibody signatures.Immunity. 2023 Jun 13;56(6):1393-1409.e6. doi: 10.1016/j.immuni.2023.04.017. Epub 2023 May 9. Immunity. 2023. PMID: 37164015
-
PhIP-Seq characterization of serum antibodies using oligonucleotide-encoded peptidomes.Nat Protoc. 2018 Sep;13(9):1958-1978. doi: 10.1038/s41596-018-0025-6. Nat Protoc. 2018. PMID: 30190553 Free PMC article.
-
Phage Immunoprecipitation and Sequencing-a Versatile Technique for Mapping the Antibody Reactome.Mol Cell Proteomics. 2024 Sep;23(9):100831. doi: 10.1016/j.mcpro.2024.100831. Epub 2024 Aug 19. Mol Cell Proteomics. 2024. PMID: 39168282 Free PMC article. Review.
-
Phage ImmunoPrecipitation Sequencing (PhIP-Seq): The Promise of High Throughput Serology.Pathogens. 2022 May 11;11(5):568. doi: 10.3390/pathogens11050568. Pathogens. 2022. PMID: 35631089 Free PMC article. Review.
Cited by
-
Exploring Immunome and Microbiome Interplay in Reproductive Health: Current Knowledge, Challenges, and Novel Diagnostic Tools.Semin Reprod Med. 2023 Sep;41(5):172-189. doi: 10.1055/s-0043-1778017. Epub 2024 Jan 23. Semin Reprod Med. 2023. PMID: 38262441 Free PMC article. Review.
-
Identification of immunogenic commensal antigens using phage display.Nat Protoc. 2025 Jun 17. doi: 10.1038/s41596-025-01193-1. Online ahead of print. Nat Protoc. 2025. PMID: 40528087 Review.
-
Decoding the etiology of immune-mediated inflammatory diseases statistically.Front Immunol. 2025 Jun 17;16:1610662. doi: 10.3389/fimmu.2025.1610662. eCollection 2025. Front Immunol. 2025. PMID: 40599790 Free PMC article. Review.
-
Antigen-level resolution of commensal-specific B cell responses can be enabled by phage display screening coupled with B cell tetramers.Immunity. 2024 Jun 11;57(6):1428-1441.e8. doi: 10.1016/j.immuni.2024.04.014. Epub 2024 May 8. Immunity. 2024. PMID: 38723638 Free PMC article.
-
T and B cell responses against Epstein-Barr virus in primary sclerosing cholangitis.Nat Med. 2025 Jul;31(7):2306-2316. doi: 10.1038/s41591-025-03692-w. Epub 2025 Jun 11. Nat Med. 2025. PMID: 40500415 Free PMC article.
References
Publication types
MeSH terms
Substances
Grants and funding
LinkOut - more resources
Full Text Sources
Research Materials
Miscellaneous

