

Development and internal-external validation of statistical and machine learning models for breast cancer prognostication: cohort study
- PMID: 37164379
- PMCID: PMC10170264
- DOI: 10.1136/bmj-2022-073800
Development and internal-external validation of statistical and machine learning models for breast cancer prognostication: cohort study
Abstract
Objective: To develop a clinically useful model that estimates the 10 year risk of breast cancer related mortality in women (self-reported female sex) with breast cancer of any stage, comparing results from regression and machine learning approaches.
Design: Population based cohort study.
Setting: QResearch primary care database in England, with individual level linkage to the national cancer registry, Hospital Episodes Statistics, and national mortality registers.
Participants: 141 765 women aged 20 years and older with a diagnosis of invasive breast cancer between 1 January 2000 and 31 December 2020.
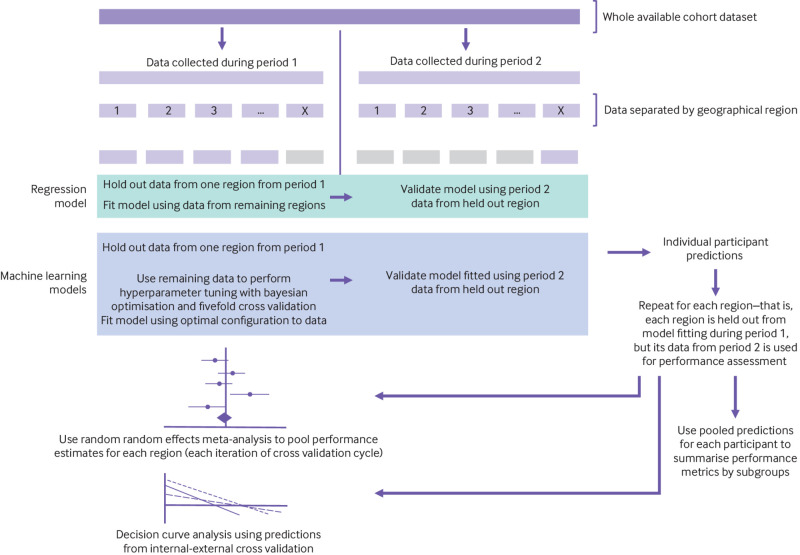
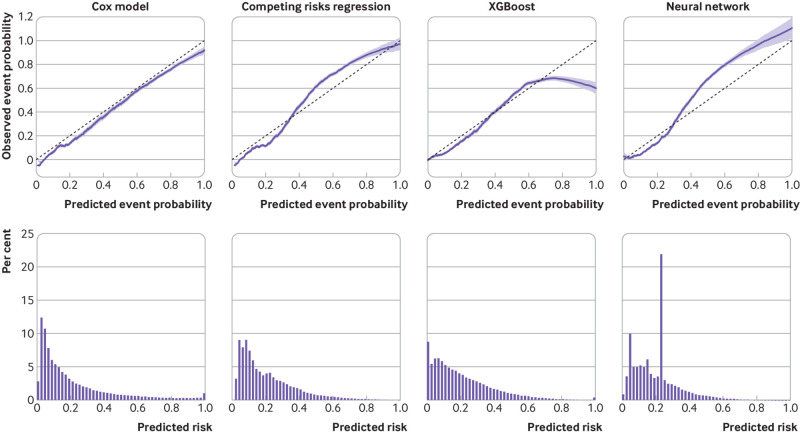
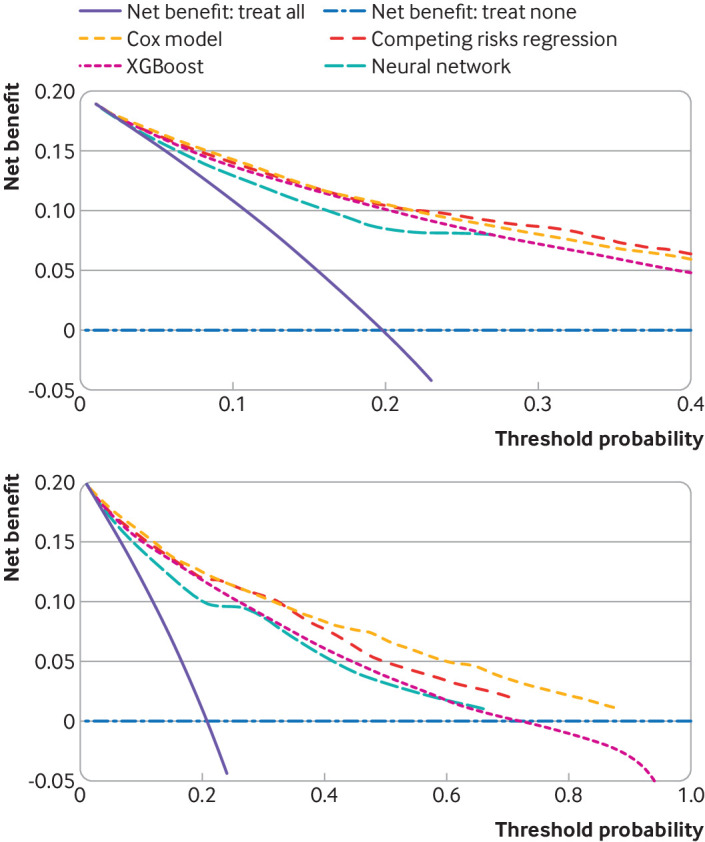
Main outcome measures: Four model building strategies comprising two regression (Cox proportional hazards and competing risks regression) and two machine learning (XGBoost and an artificial neural network) approaches. Internal-external cross validation was used for model evaluation. Random effects meta-analysis that pooled estimates of discrimination and calibration metrics, calibration plots, and decision curve analysis were used to assess model performance, transportability, and clinical utility.
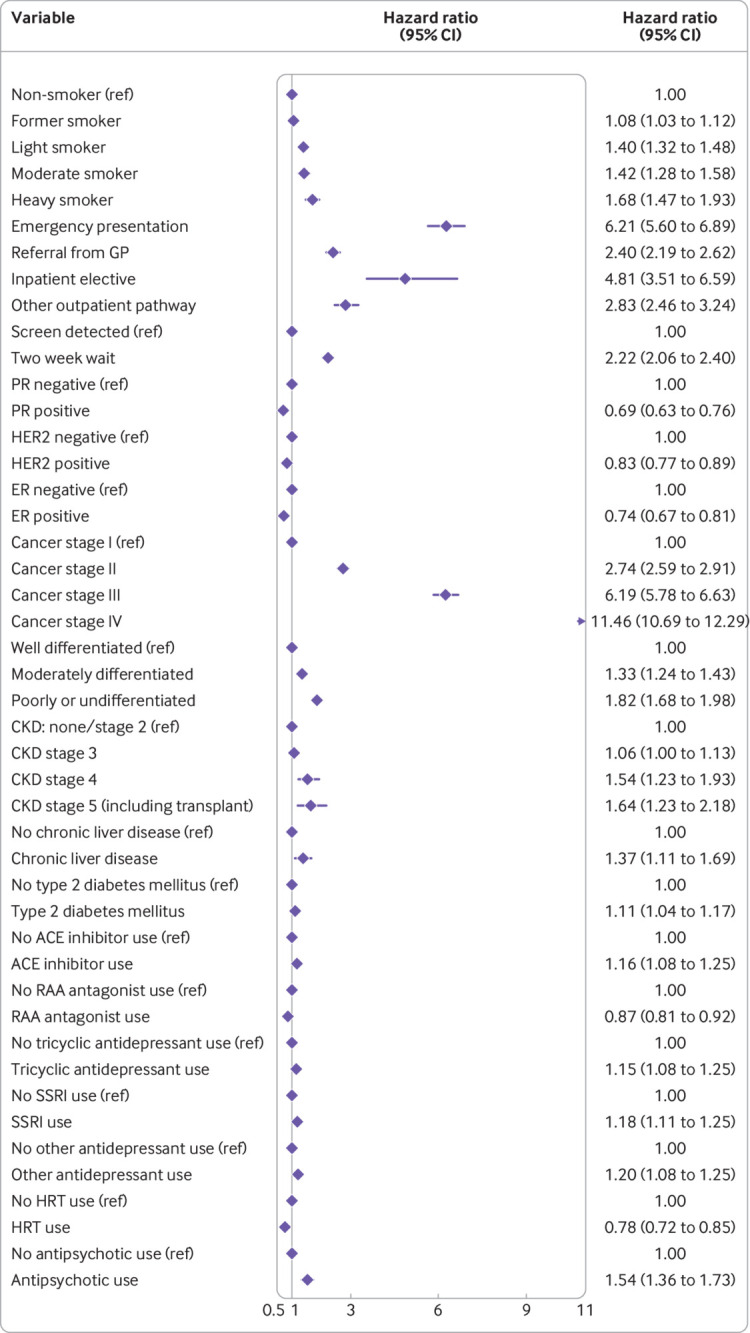
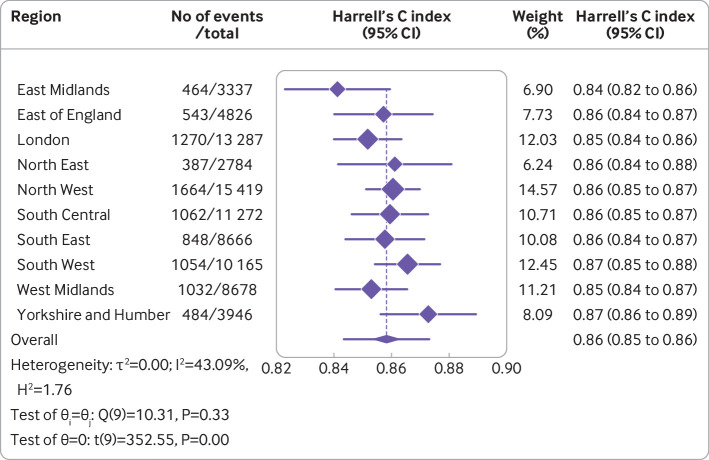
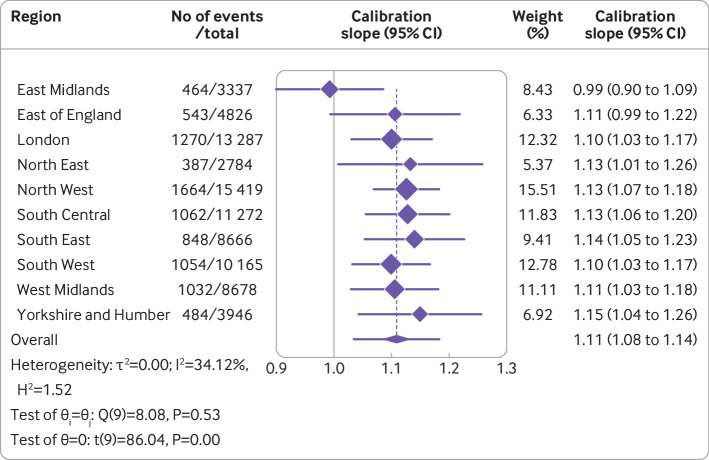
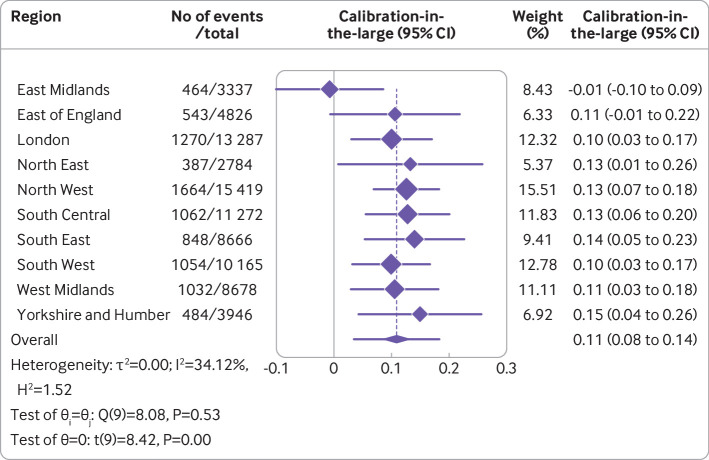
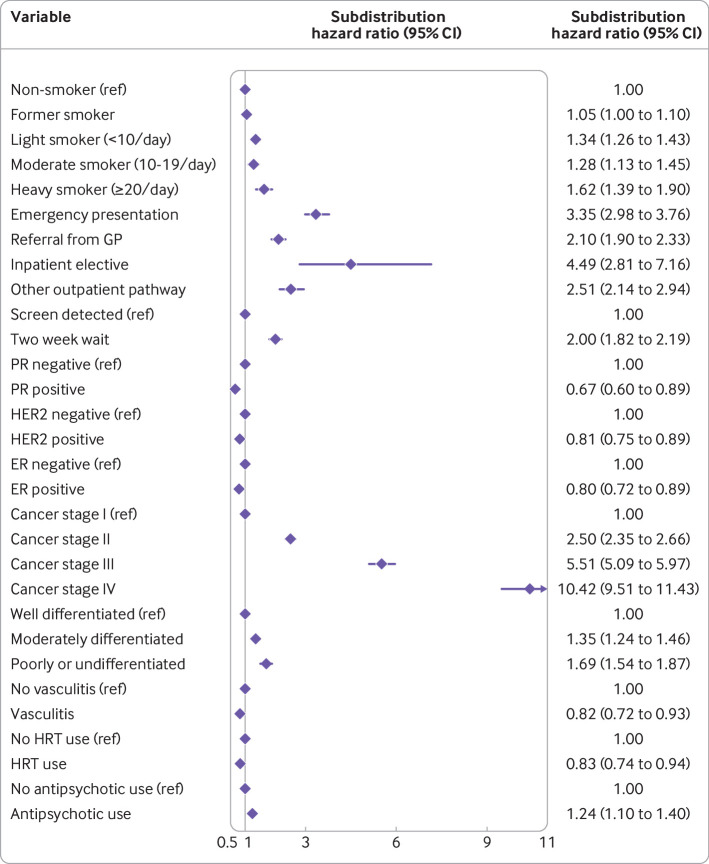
Results: During a median 4.16 years (interquartile range 1.76-8.26) of follow-up, 21 688 breast cancer related deaths and 11 454 deaths from other causes occurred. Restricting to 10 years maximum follow-up from breast cancer diagnosis, 20 367 breast cancer related deaths occurred during a total of 688 564.81 person years. The crude breast cancer mortality rate was 295.79 per 10 000 person years (95% confidence interval 291.75 to 299.88). Predictors varied for each regression model, but both Cox and competing risks models included age at diagnosis, body mass index, smoking status, route to diagnosis, hormone receptor status, cancer stage, and grade of breast cancer. The Cox model's random effects meta-analysis pooled estimate for Harrell's C index was the highest of any model at 0.858 (95% confidence interval 0.853 to 0.864, and 95% prediction interval 0.843 to 0.873). It appeared acceptably calibrated on calibration plots. The competing risks regression model had good discrimination: pooled Harrell's C index 0.849 (0.839 to 0.859, and 0.821 to 0.876, and evidence of systematic miscalibration on summary metrics was lacking. The machine learning models had acceptable discrimination overall (Harrell's C index: XGBoost 0.821 (0.813 to 0.828, and 0.805 to 0.837); neural network 0.847 (0.835 to 0.858, and 0.816 to 0.878)), but had more complex patterns of miscalibration and more variable regional and stage specific performance. Decision curve analysis suggested that the Cox and competing risks regression models tested may have higher clinical utility than the two machine learning approaches.
Conclusion: In women with breast cancer of any stage, using the predictors available in this dataset, regression based methods had better and more consistent performance compared with machine learning approaches and may be worthy of further evaluation for potential clinical use, such as for stratified follow-up.
© Author(s) (or their employer(s)) 2019. Re-use permitted under CC BY. No commercial re-use. See rights and permissions. Published by BMJ.
Conflict of interest statement
Competing interests: All authors have completed the ICMJE uniform disclosure form at www.icmje.org/disclosure-of-interest/ and declare: JHC is an unpaid director of QResearch (a not-for-profit organisation that is a partnership between the University of Oxford and EMIS Health that supply the QResearch database) and is a founder and shareholder of ClinRisk and was its medical director until 31 May 2019 (ClinRisk produces open and closed source software to implement clinical risk algorithms including two breast cancer risk models implemented in the National Health Service into clinical computer systems.
Figures
References
-
- National Cancer Research Intitute. Publishing strategic priorities in breast cancer research 2022 (accessed 23 Jun 2022). https://www.ncri.org.uk/priorities-in-breast-cancer-research/
Publication types
MeSH terms
Grants and funding
LinkOut - more resources
Full Text Sources
Medical