. 2023 Apr;33(4):496-510.
doi: 10.1101/gr.277334.122. Epub 2023 May 10.

Gaps and complex structurally variant loci in phased genome assemblies

Collaborators, Affiliations

Gaps and complex structurally variant loci in phased genome assemblies

David Porubsky et al. Genome Res. 2023 Apr.

Abstract

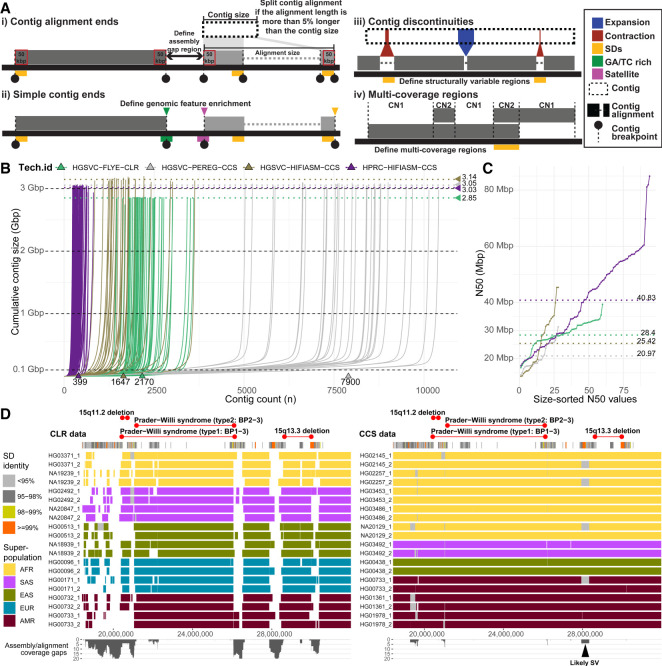
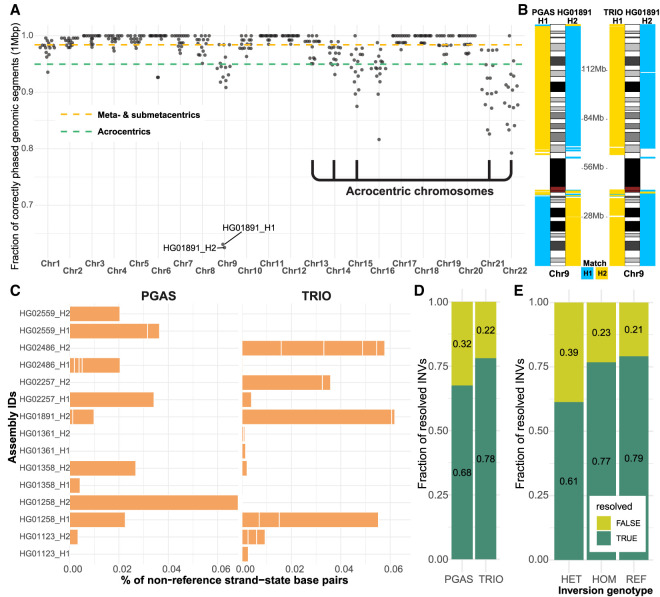
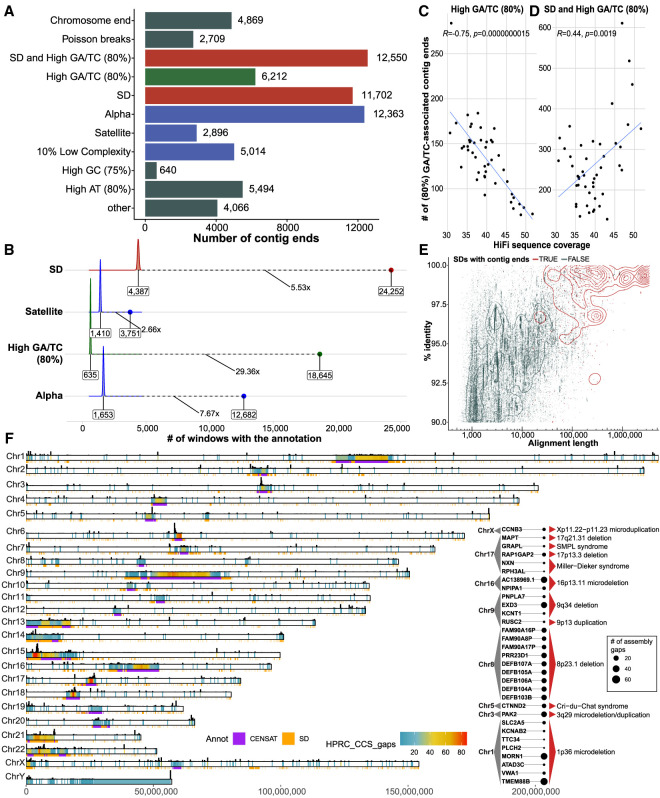
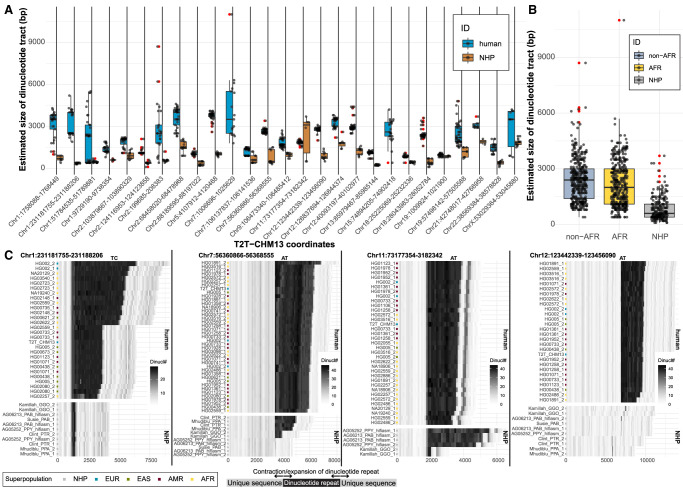
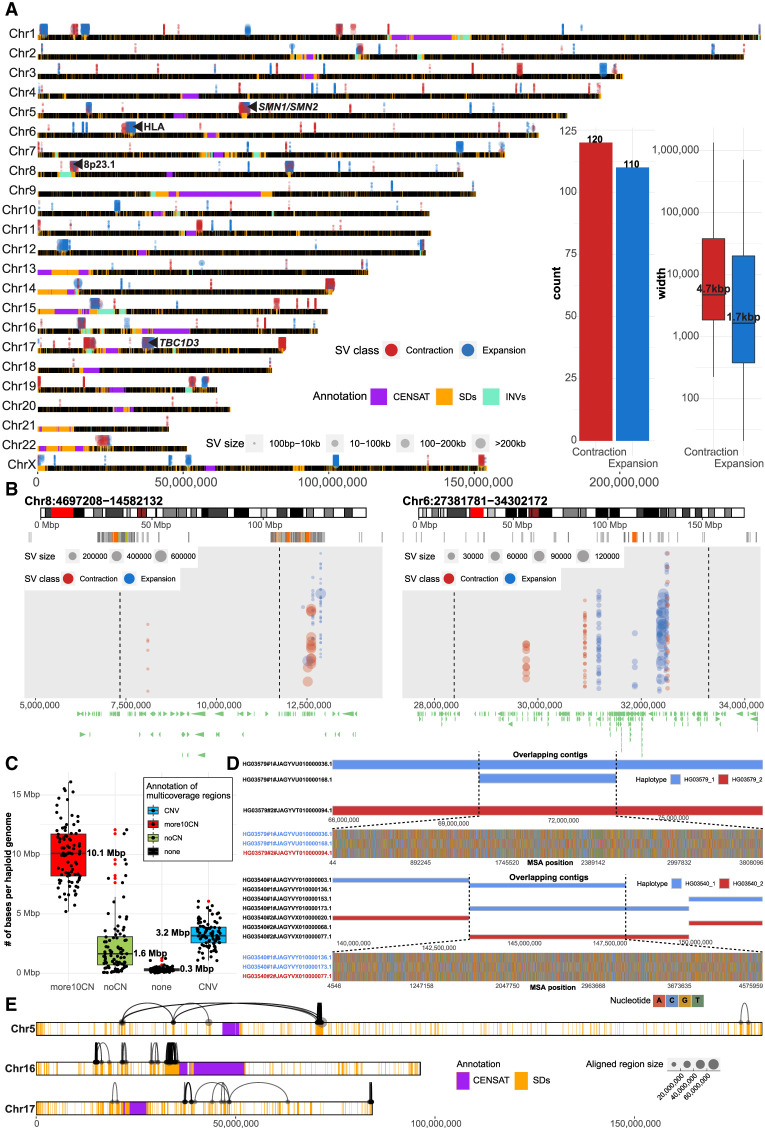
There has been tremendous progress in phased genome assembly production by combining long-read data with parental information or linked-read data. Nevertheless, a typical phased genome assembly generated by trio-hifiasm still generates more than 140 gaps. We perform a detailed analysis of gaps, assembly breaks, and misorientations from 182 haploid assemblies obtained from a diversity panel of 77 unique human samples. Although trio-based approaches using HiFi are the current gold standard, chromosome-wide phasing accuracy is comparable when using Strand-seq instead of parental data. Importantly, the majority of assembly gaps cluster near the largest and most identical repeats (including segmental duplications [35.4%], satellite DNA [22.3%], or regions enriched in GA/AT-rich DNA [27.4%]). Consequently, 1513 protein-coding genes overlap assembly gaps in at least one haplotype, and 231 are recurrently disrupted or missing from five or more haplotypes. Furthermore, we estimate that 6-7 Mbp of DNA are misorientated per haplotype irrespective of whether trio-free or trio-based approaches are used. Of these misorientations, 81% correspond to bona fide large inversion polymorphisms in the human species, most of which are flanked by large segmental duplications. We also identify large-scale alignment discontinuities consistent with 11.9 Mbp of deletions and 161.4 Mbp of insertions per haploid genome. Although 99% of this variation corresponds to satellite DNA, we identify 230 regions of euchromatic DNA with frequent expansions and contractions, nearly half of which overlap with 197 protein-coding genes. Such variable and incompletely assembled regions are important targets for future algorithmic development and pangenome representation.


Figures

Figure 1.
Figure 1.
Comparison and evaluation of phased assemblies. (A) Assembly metrics evaluated in this study. (i) Contig alignment ends are defined as terminal contig alignments such that the total alignment size does not exceed the actual contig size by >5%. When this requirement is not met, multiple contig end alignments will be reported. (ii) Simple contig ends are defined as the first and last alignments of each contig to the reference (T2T-CHM13 v1.1) with at least 25 kbp aligned. (iii) Contig discontinuities are defined as alignment gaps between subsequent pieces of a single contig <1 Mbp. (iv) Detection of regions with coverage more than 1n as is expected for a haploid genome. (B) A cumulative contig size distribution colored by assembly technology. Each line represents a single haploid assembly (HGSVC-FLYE-CLR, n = 60; HGSVC-PEREG-CCS, n = 28; HGSVC-HIFIASM-CCS, n = 28; HPRC-HIFIASM-CCS, n = 94). Median total assembly length per assembly technology is highlighted as horizontal dotted lines. (C) Contig N50 values colored by assembly technology as in B. Each dot represents a single haploid assembly. Median N50 value per assembly technology is highlighted as horizontal dotted lines. (D) Track definition from top to bottom: Regions corresponding to known genomic disorders between 15q11.2–15q13.3. Below is the annotation of SDs in this region colored by sequence identity. Main track shows the visualization of contig alignments for 10 random samples from trio-free CLR assemblies (left) in comparison to trio-based HPRC assemblies (right). Contig alignments are colored by sample superpopulation (AFR, African; SAS, Southeast Asian; EAS, East Asian; EUR, European; AMR, American). White spaces between contig alignments represent boundaries between subsequent contig. Spaces filled with gray color represent unaligned portions of a single contig with respect to the reference (T2T-CHM13) and likely represent a structural variation (black arrowhead). The last track summarizes the extent of assembly gaps (between contigs; white space) and contig gaps (within contigs; gray rectangles) as coverage plot.
Figure 2.
Figure 2.
Phasing accuracy and inversion analysis of trio-based and trio-free assemblies. (A) Phasing accuracy of PGAS (trio-free) assemblies with respect to trio-based phasing. (B) Haplotype assignment of 1-Mbp-sized blocks (left from ideogram, H1; right from ideogram, H2) to either haplotype 1 or 2 (blue, H1; yellow, H2) using single-nucleotide polymorphisms phased using trio information (1000 Genomes Project panel) with respect to the reference (GRCh38). (C) A barplot reporting the percentage of base pairs in an opposite (reverse) orientation in contrast to the expected (direct) orientation based on Strand-seq analysis of assembly directionality, shown separately for trio-free (PGAS, n = 15; left) and trio-based (TRIO, n = 23; right) assemblies. (D) Fraction of tested inversion sites that are fully informative (TRUE; dark green). (E) Fraction of tested inversion sites that are fully informative (TRUE; dark green) as a function of inversion genotype. (HET) Heterozygous, (HOM) homozygous inverted, (REF) homozygous reference.
Figure 3.
Figure 3.
Sequence properties at defined contig ends. (A) The number of simple contig ends that are within or near (at most 10 kbp) a particular sequence annotation. Annotations are nonredundant and are prioritized in the order shown; for example, if a contig end is near the end of a chromosome and in an SD, it will only be annotated as a chromosome end. Note that chromosome ends are contig ends within the last 100 kbp of contigs. Poisson ends are contig ends that happen in only one haplotype (nonrecurrent and therefore likely to be random). SD and high GA/TC mean that the end is within 10 kbp of an SD and within 10 kbp of a 1-kbp window with at least 80% GA/TC content. (B) The fold enrichment in the number of contigs ends within 10 kbp of a sequence annotation compared with a distribution of randomly placed contig end simulations (10,000 permutations). Shown in text is the median of the random distribution (left), the fold enrichment (middle), and the observed value (right). In this analysis contig ends may exist in multiple categories; for example, if a contig end is near both an SD and a satellite sequence, it will appear in both simulations. (C) The effect of HiFi coverage on number of GA/TC breaks is negatively correlated when considered independently; however, when combined with SDs, the trend is inverted, as shown in D. (E) All SDs in T2T-CHM13 displayed by their length and percentage of identity (blue) versus the SDs that intersect contig ends (red). (F) Genome-wide distribution of gaps defined in between contig alignment ends (Methods) across all HPRC assemblies (n = 94). Color range reflects the number of assembly gaps overlapping each other in any given genomic region. On the top of each chromosomal bar, there is a density of simple contig ends. The height of each bar reflects the number of simple contig ends counted in 200-kbp-long genomic bins. Inset: List of protein-coding genes (n = 31) overlapping assembly breaks and reported microdeletion and microduplication syndromes.
Figure 4.
Figure 4.
Sequence variation in low-complexity regions. (A) Size distribution comparison of dinucleotide tracts (y-axis) between human (blue) and nonhuman primates (NHPs; brown) for 27 selected regions (Methods). Outliers are highlighted as red dots. (B) A summary of size distribution of dinucleotide tracts (y-axis) between human samples of African (AFR; yellow) and non-African (non-AFR; light blue) origin and NHPs (gray) across all complete assemblies from 27 selected regions. (C) Difference in dinucleotide frequency (TC, AT) between humans and NHP in four genomic regions. Shades of gray color reflect the number of detected dinucleotides (defined at the top of each plot) in 100-bp-long DNA sequence chunks. Assembly names (y-axis) from NHP contain sample IDs and species-specific ID: (PTR) Pan troglodytes, (GGO) Gorilla gorilla, (PPA) Pan paniscus, (MMU) Macaca mulatta, (PAB) Pongo abelii, (PPY) Pongo pygmaeus. Numbers 1 and 2 represent parental homolog IDs of given sample assembly.
Figure 5.
Figure 5.
Tracking contig alignment discontinuities and multicoverage regions. (A) Genome-wide distribution of frequent (n = 230) contig alignment discontinuities (1 kbp to 1 Mbp in size). Each gap is represented in each separate assembly (HPRC, 94; HGSVC, 28) by a colored dot (blue, expansion [INS]; red, contraction [DEL]), and the size of each dot represents the size of the event in contig coordinates. A region is defined as an INS (blue) if there is a gap in a contig alignment (in reference T2T-CHM13, v1.1 coordinates) that is smaller than the sequence within a contig itself delineated by the left and right alignments flanking the gap. In contrast, a DEL (red) is defined as a gap in a contig alignment (in reference T2T-CHM13, v1.1 coordinates) that is larger than the sequence within a contig itself delineated by the left and right alignments around the gap. Putative expansions and contractions above the horizontal chromosomal lines were detected in HPRC assemblies, and those below the lines in HGSVC assemblies. Centromeric satellite regions are highlighted by gray rectangles and regions of segmental duplications (SDs) as orange rectangles on top of each chromosomal line (black). (B) Example regions (left, defensin locus, 8p23.1; right, HLA locus) with frequent expansions and contractions. Each region is highlighted as a red rectangle on chromosome-specific ideogram (top track). Below, there is an SD annotation for a given region represented as a set of rectangles colored by sequence identity. Expansions and contractions of each contig alignment with respect to the reference (T2T-CHM13, v1.1) are depicted as blue and red dots, respectively. The size of each dot represents the size of an event. (C) Assignment of total number base pairs covered by multiple contig alignments, in each haploid genome (n = 88), into four categories based on agreement with short-read-based CNV profiles (for detailed description of categories, see Methods). (D) Example regions in samples HG03579 and HG03540, where overlapping contigs associate with loss of heterozygosity. Top track shows contig alignments in a given region separately for haplotype 1 (blue; paternal) and haplotype 2 (red; maternal). Overlapping contig alignments are stacked on top of each other. The bottom track shows all variable positions detected in a multiple sequence alignment (MSA) over the region where contigs overlap (dashed lines). Here, one of the paternal contigs is nearly identical to a maternal contig at the region where contigs overlap. (E) Chromosomes 5, 16, and 17 are depicted as horizontal bars with the locations of SDs and centromeric regions highlighted as orange and purple rectangles, respectively. Contig alignment ends divided into multiple pieces are visualized as links between subsequent pieces of a single contig aligned to the reference (T2T-CHM13 v1.1). The length of the aligned pieces of a contig are defined by the size of each dot.

References

    1. The 1000 Genomes Project Consortium. 2015. A global reference for human genetic variation. Nature 526: 68–74. 10.1038/nature15393 - DOI - PMC - PubMed
    1. Altemose N, Logsdon GA, Bzikadze AV, Sidhwani P, Langley SA, Caldas GV, Hoyt SJ, Uralsky L, Ryabov FD, Shew CJ, et al. 2022. Complete genomic and epigenetic maps of human centromeres. Science 376: eabl4178. 10.1126/science.abl4178 - DOI - PMC - PubMed
    1. Byrska-Bishop M, Evani US, Zhao X, Basile AO, Abel HJ, Regier AA, Corvelo A, Clarke WE, Musunuri R, Nagulapalli K, et al. 2022. High-coverage whole-genome sequencing of the expanded 1000 Genomes Project cohort including 602 trios. Cell 185: 3426–3440.e19. 10.1016/j.cell.2022.08.004 - DOI - PMC - PubMed
    1. Chaisson MJP, Sanders AD, Zhao X, Malhotra A, Porubsky D, Rausch T, Gardner EJ, Rodriguez OL, Guo L, Collins RL, et al. 2019. Multi-platform discovery of haplotype-resolved structural variation in human genomes. Nat Commun 10: 1784. 10.1038/s41467-018-08148-z - DOI - PMC - PubMed
    1. Cheng H, Concepcion GT, Feng X, Zhang H, Li H. 2021. Haplotype-resolved de novo assembly using phased assembly graphs with hifiasm. Nat Methods 18: 170–175. 10.1038/s41592-020-01056-5 - DOI - PMC - PubMed

Publication types