

Exposure-response relationships for personal exposure to fine particulate matter (PM2·5), carbon monoxide, and black carbon and birthweight: an observational analysis of the multicountry Household Air Pollution Intervention Network (HAPIN) trial
- PMID: 37164515
- PMCID: PMC10186177
- DOI: 10.1016/S2542-5196(23)00052-9
Exposure-response relationships for personal exposure to fine particulate matter (PM2·5), carbon monoxide, and black carbon and birthweight: an observational analysis of the multicountry Household Air Pollution Intervention Network (HAPIN) trial
Abstract
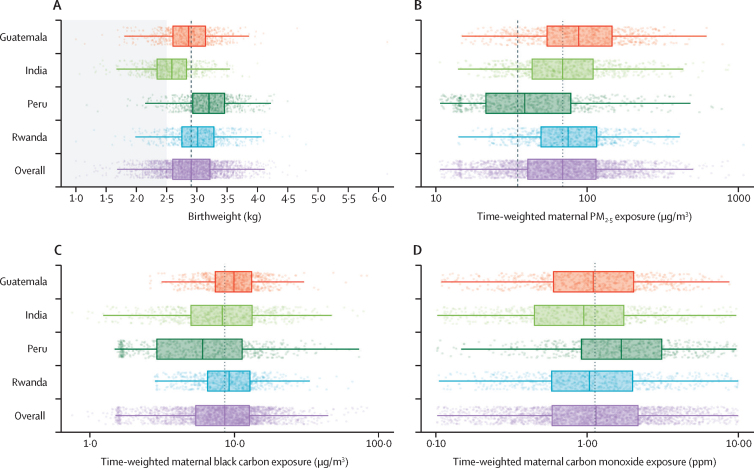
Background: Household air pollution (HAP) from solid fuel use is associated with adverse birth outcomes, but data for exposure-response relationships are scarce. We examined associations between HAP exposures and birthweight in rural Guatemala, India, Peru, and Rwanda during the Household Air Pollution Intervention Network (HAPIN) trial.
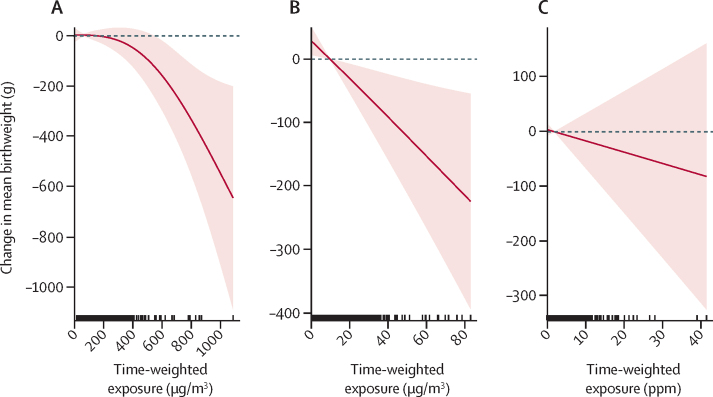
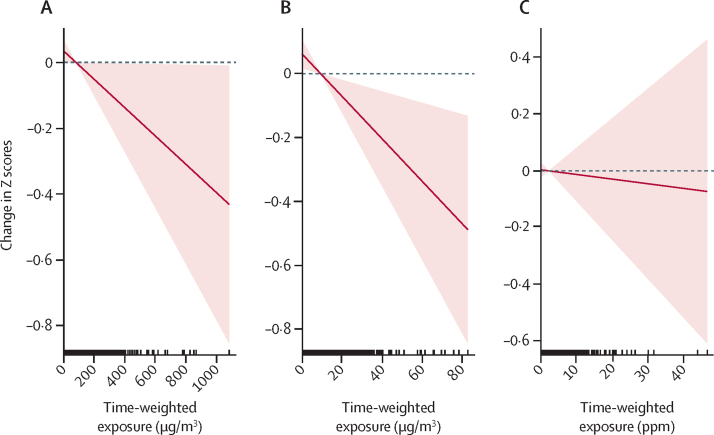
Methods: The HAPIN trial recruited pregnant women (9-<20 weeks of gestation) in rural Guatemala, India, Peru, and Rwanda and randomly allocated them to receive a liquefied petroleum gas stove or not (ie, and continue to use biomass fuel). The primary outcomes were birthweight, length-for-age, severe pneumonia, and maternal systolic blood pressure. In this exposure-response subanalysis, we measured 24-h personal exposures to PM2·5, carbon monoxide, and black carbon once pre-intervention (baseline) and twice post-intervention (at 24-28 weeks and 32-36 weeks of gestation), as well as birthweight within 24 h of birth. We examined the relationship between the average prenatal exposure and birthweight or weight-for-gestational age Z scores using multivariate-regression models, controlling for the mother's age, nulliparity, diet diversity, food insecurity, BMI, the mother's education, neonate sex, haemoglobin, second-hand smoke, and geographical indicator for randomisation strata.
Findings: Between March, 2018, and February, 2020, 3200 pregnant women were recruited. An interquartile increase in the average prenatal exposure to PM2·5 (74·5 μg/m3) was associated with a reduction in birthweight and gestational age Z scores (birthweight: -14·8 g [95% CI -28·7 to -0·8]; gestational age Z scores: -0·03 [-0·06 to 0·00]), as was an interquartile increase in black carbon (7·3 μg/m3; -21·9 g [-37·7 to -6·1]; -0·05 [-0·08 to -0·01]). Carbon monoxide exposure was not associated with these outcomes (1·7; -3·1 [-12·1 to 5·8]; -0·003 [-0·023 to 0·017]).
Interpretation: Continuing efforts are needed to reduce HAP exposure alongside other drivers of low birthweight in low-income and middle-income countries.
Funding: US National Institutes of Health (1UM1HL134590) and the Bill & Melinda Gates Foundation (OPP1131279).
Copyright © 2023 The Author(s). Published by Elsevier Ltd. This is an Open Access article under the CC BY 4.0 license. Published by Elsevier Ltd.. All rights reserved.
Conflict of interest statement
Declaration of interests We declare no competing interests.
Figures
References
-
- Bennitt FB, Wozniak SS, Causey K, Burkart K, Brauer M. Estimating disease burden attributable to household air pollution: new methods within the Global Burden of Disease Study. Lancet Glob Health. 2021;9:S18.
-
- Smith KR, Bruce N, Balakrishnan K, et al. Millions dead: how do we know and what does it mean? Methods used in the comparative risk assessment of household air pollution. Annu Rev Public Health. 2014;35:185–206. - PubMed
-
- Pope DP, Mishra V, Thompson L, et al. Risk of low birth weight and stillbirth associated with indoor air pollution from solid fuel use in developing countries. Epidemiol Rev. 2010;32:70–81. - PubMed
Publication types
MeSH terms
Substances
Grants and funding
LinkOut - more resources
Full Text Sources
Medical
