Review
. 2023 Jul;46(7):508-524.
doi: 10.1016/j.tins.2023.04.001. Epub 2023 May 8.

Why is everyone talking about brain state?

Affiliations
Review

Why is everyone talking about brain state?

Abigail S Greene et al. Trends Neurosci. 2023 Jul.

Abstract

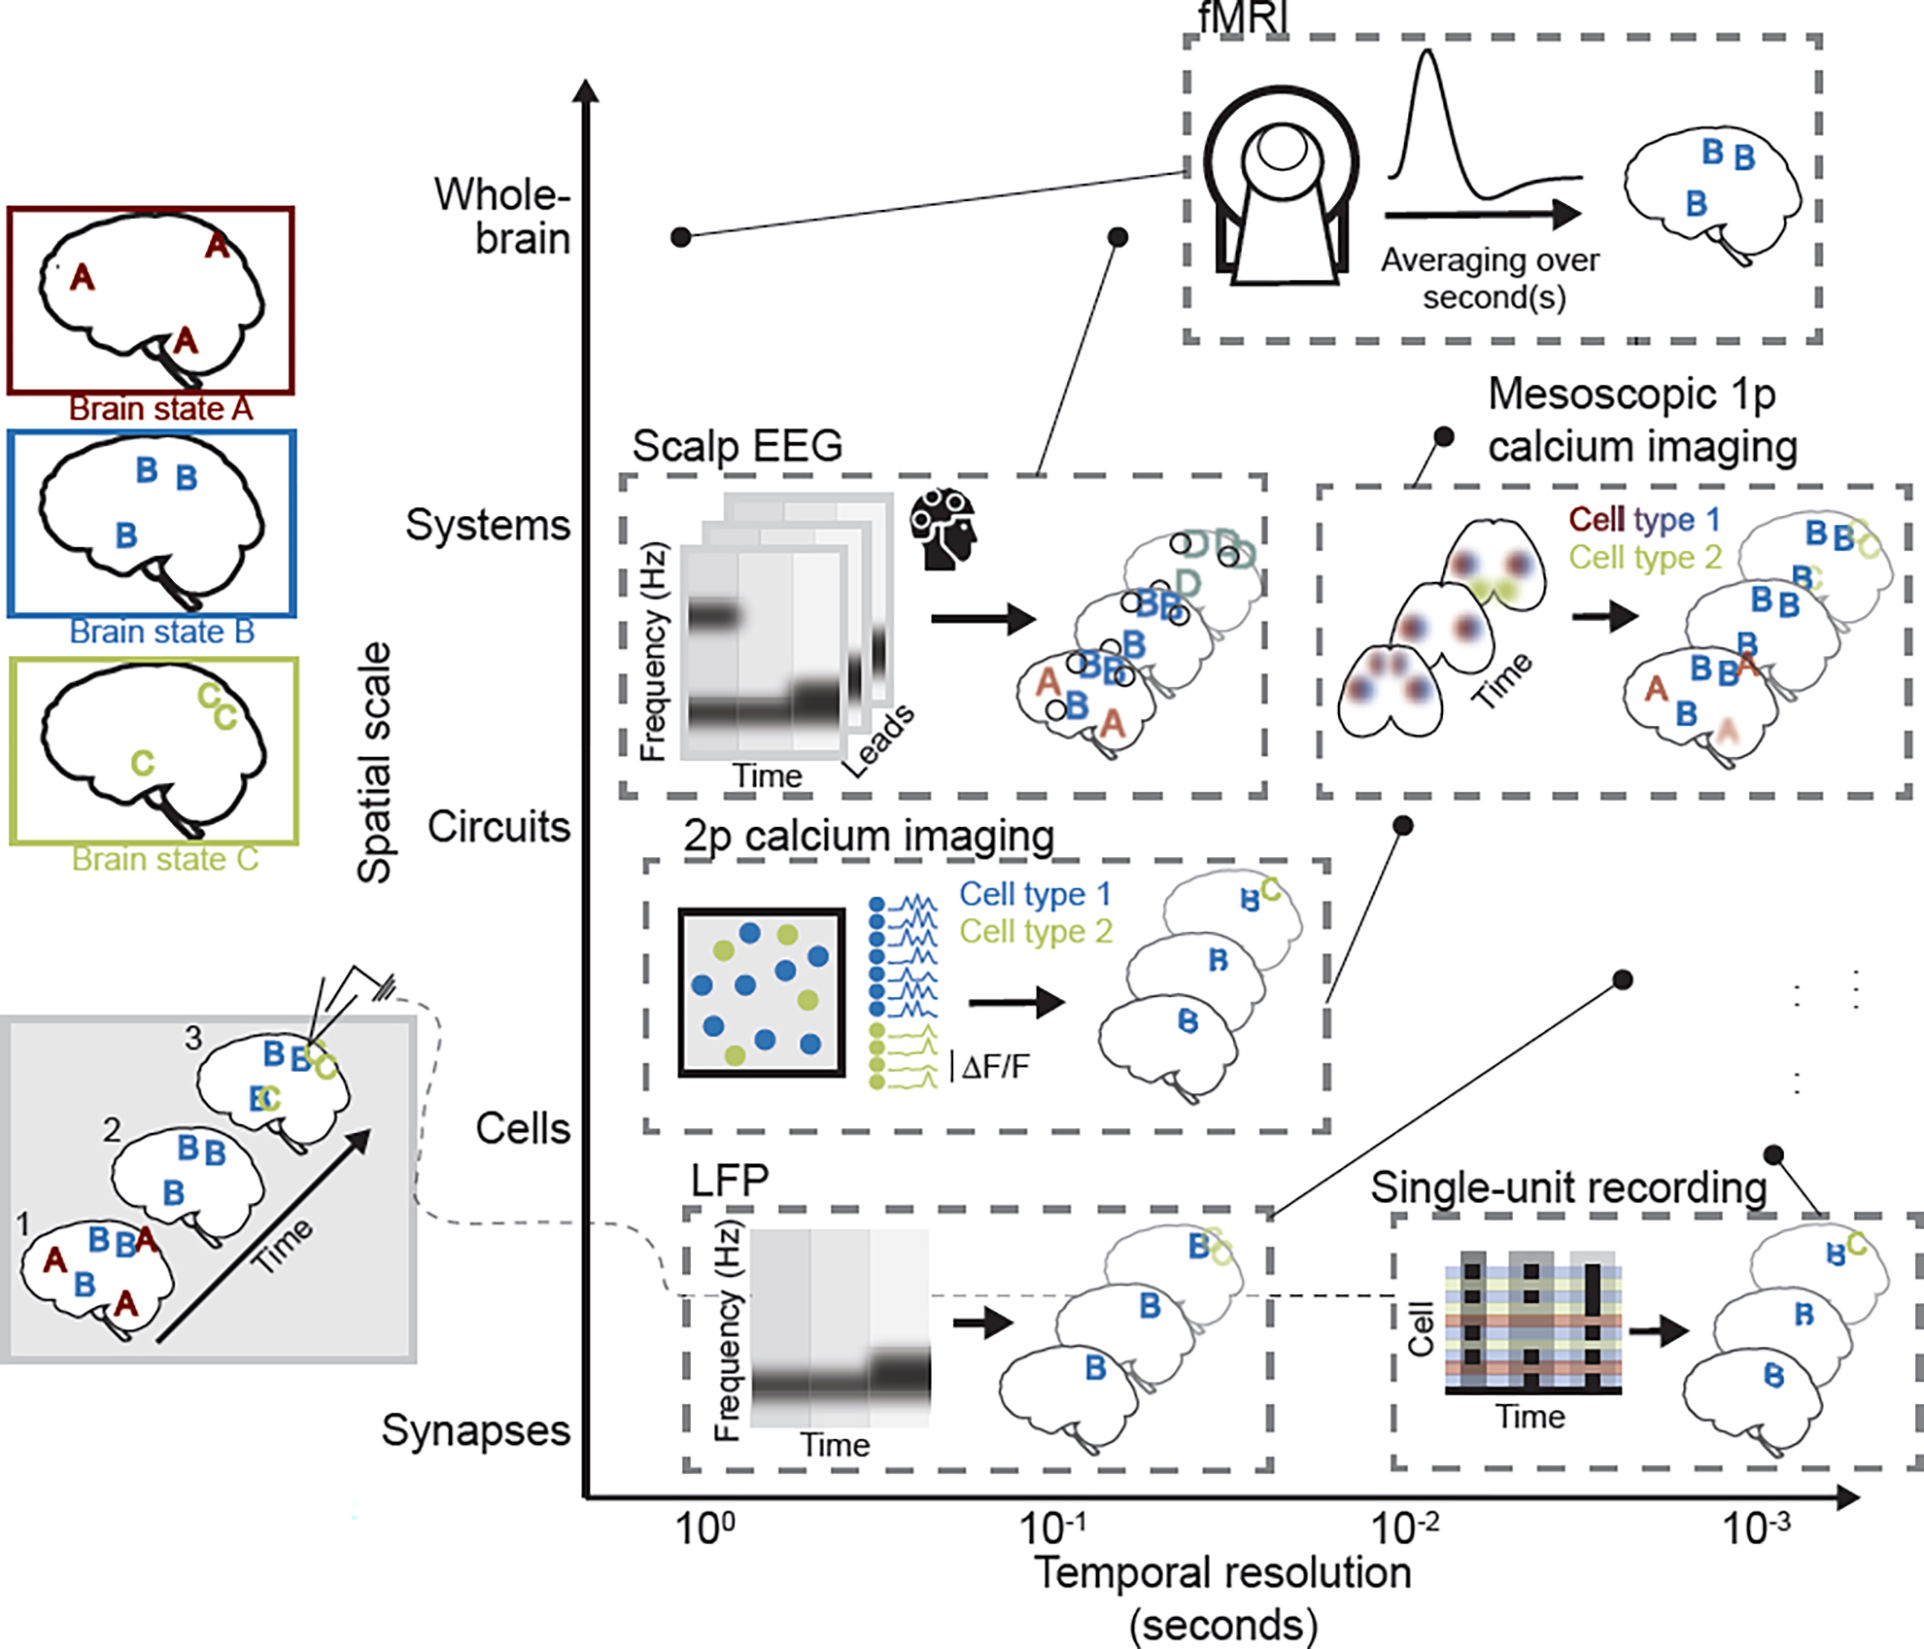
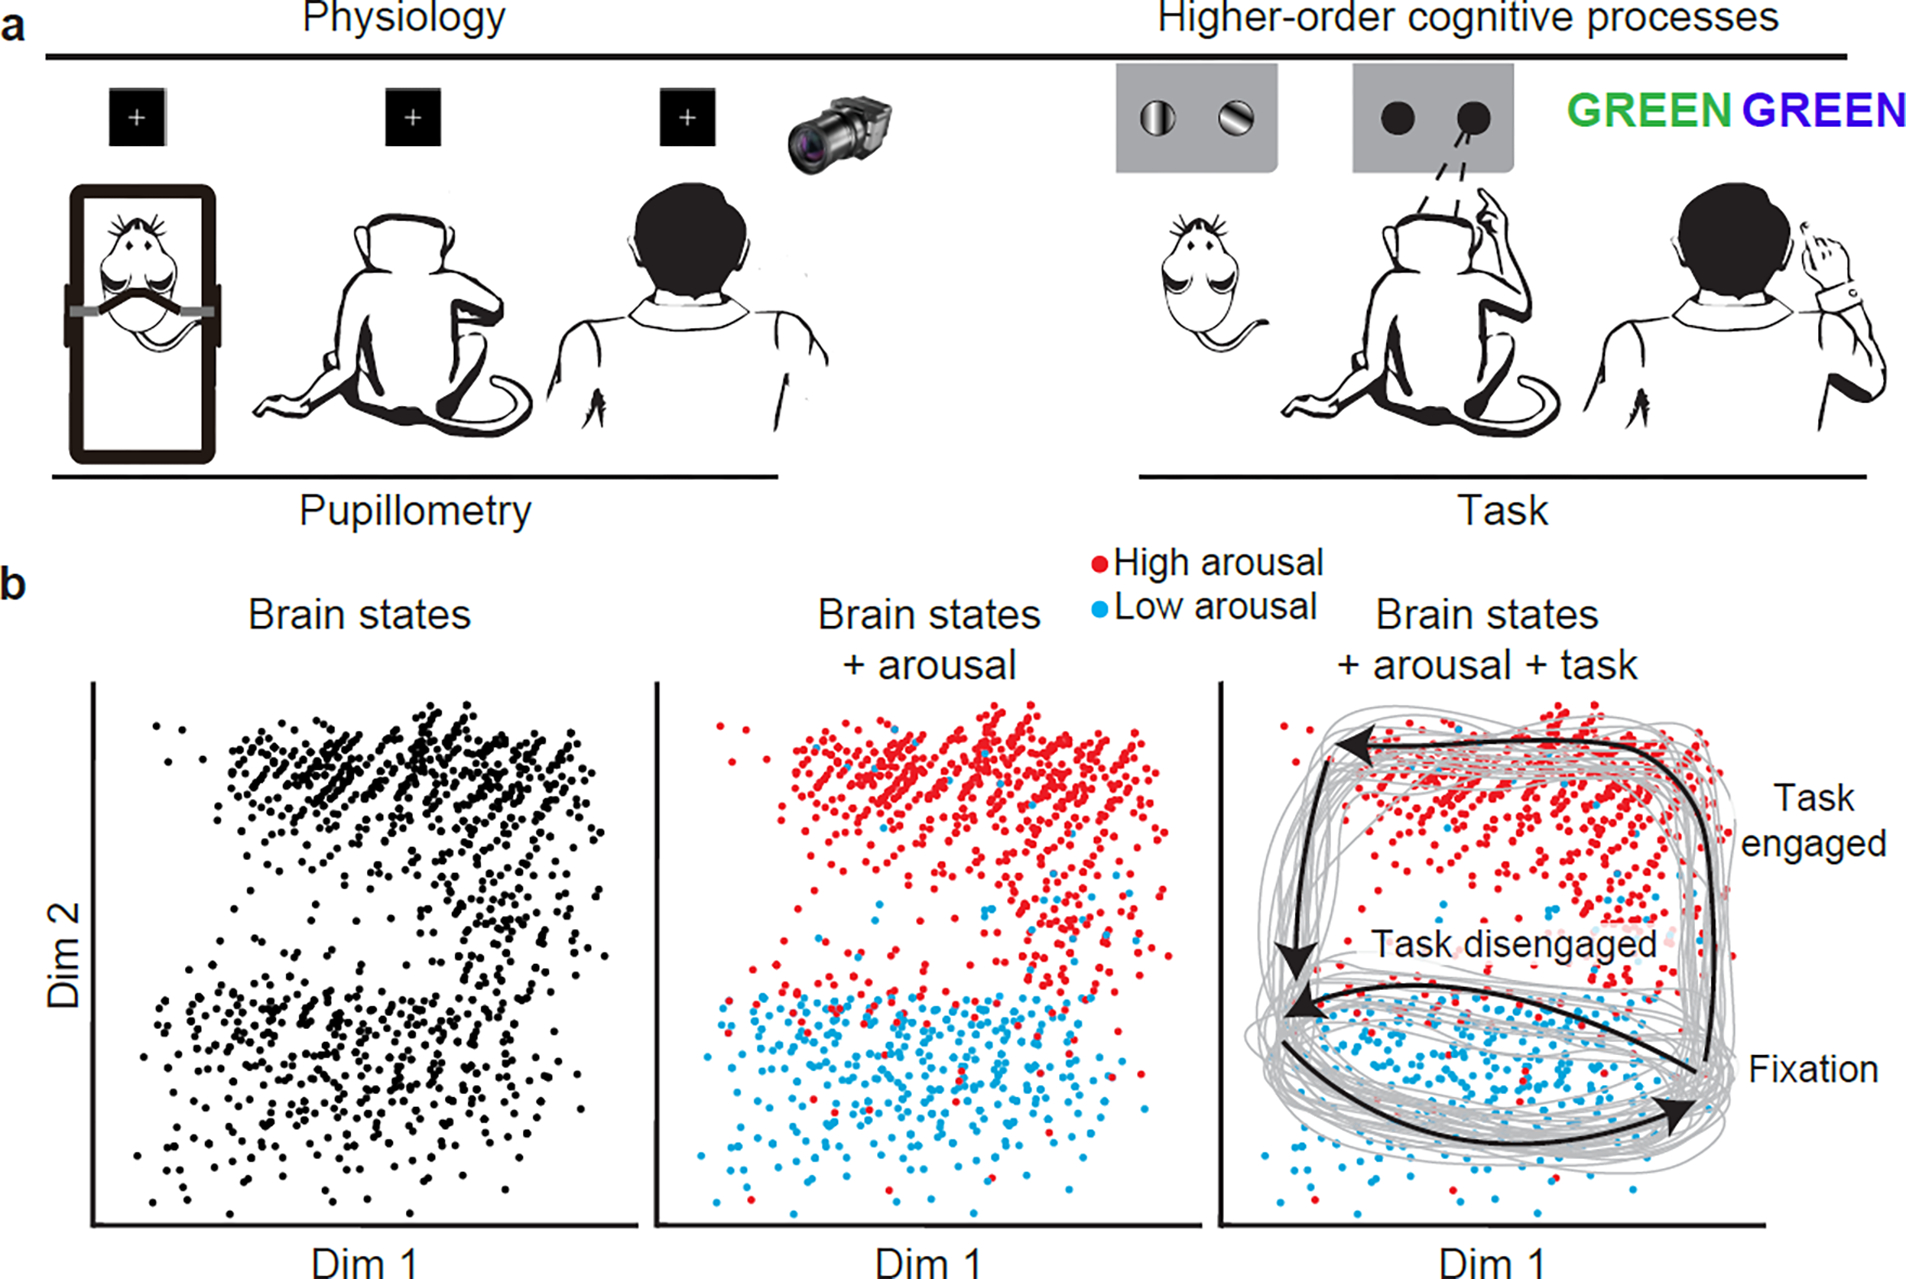
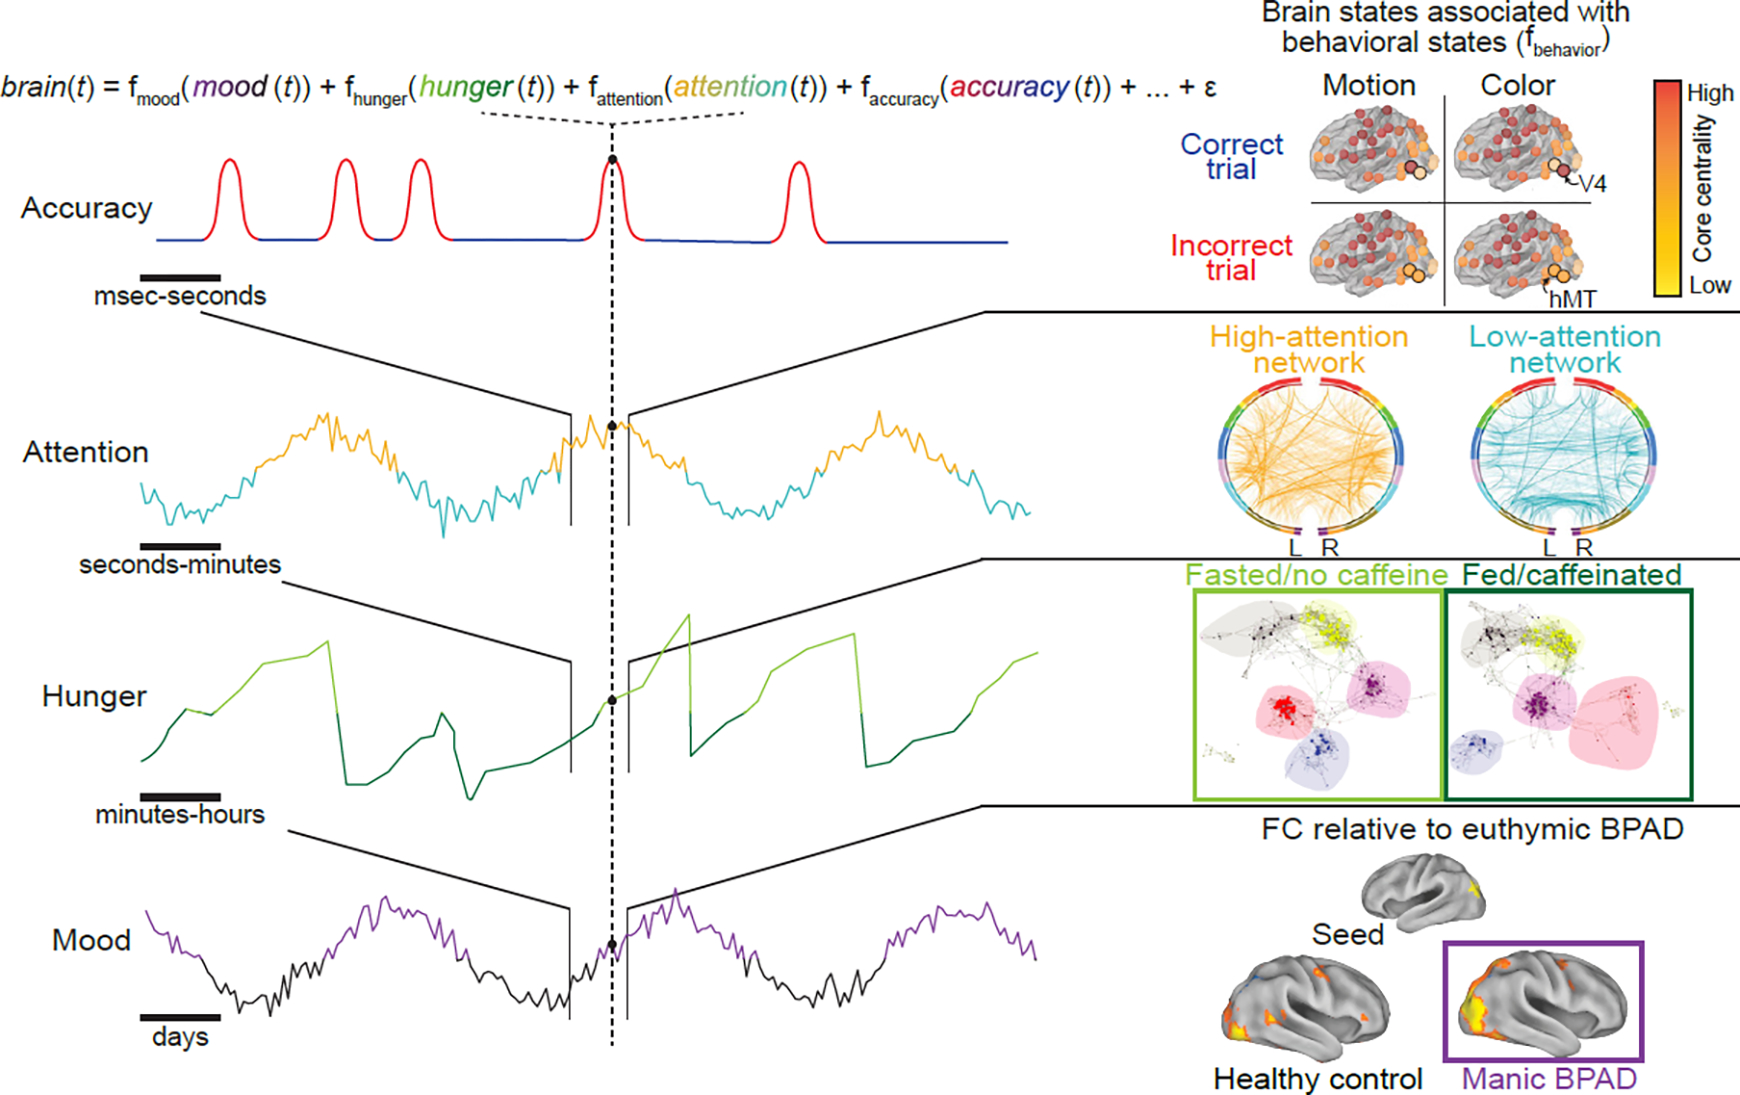
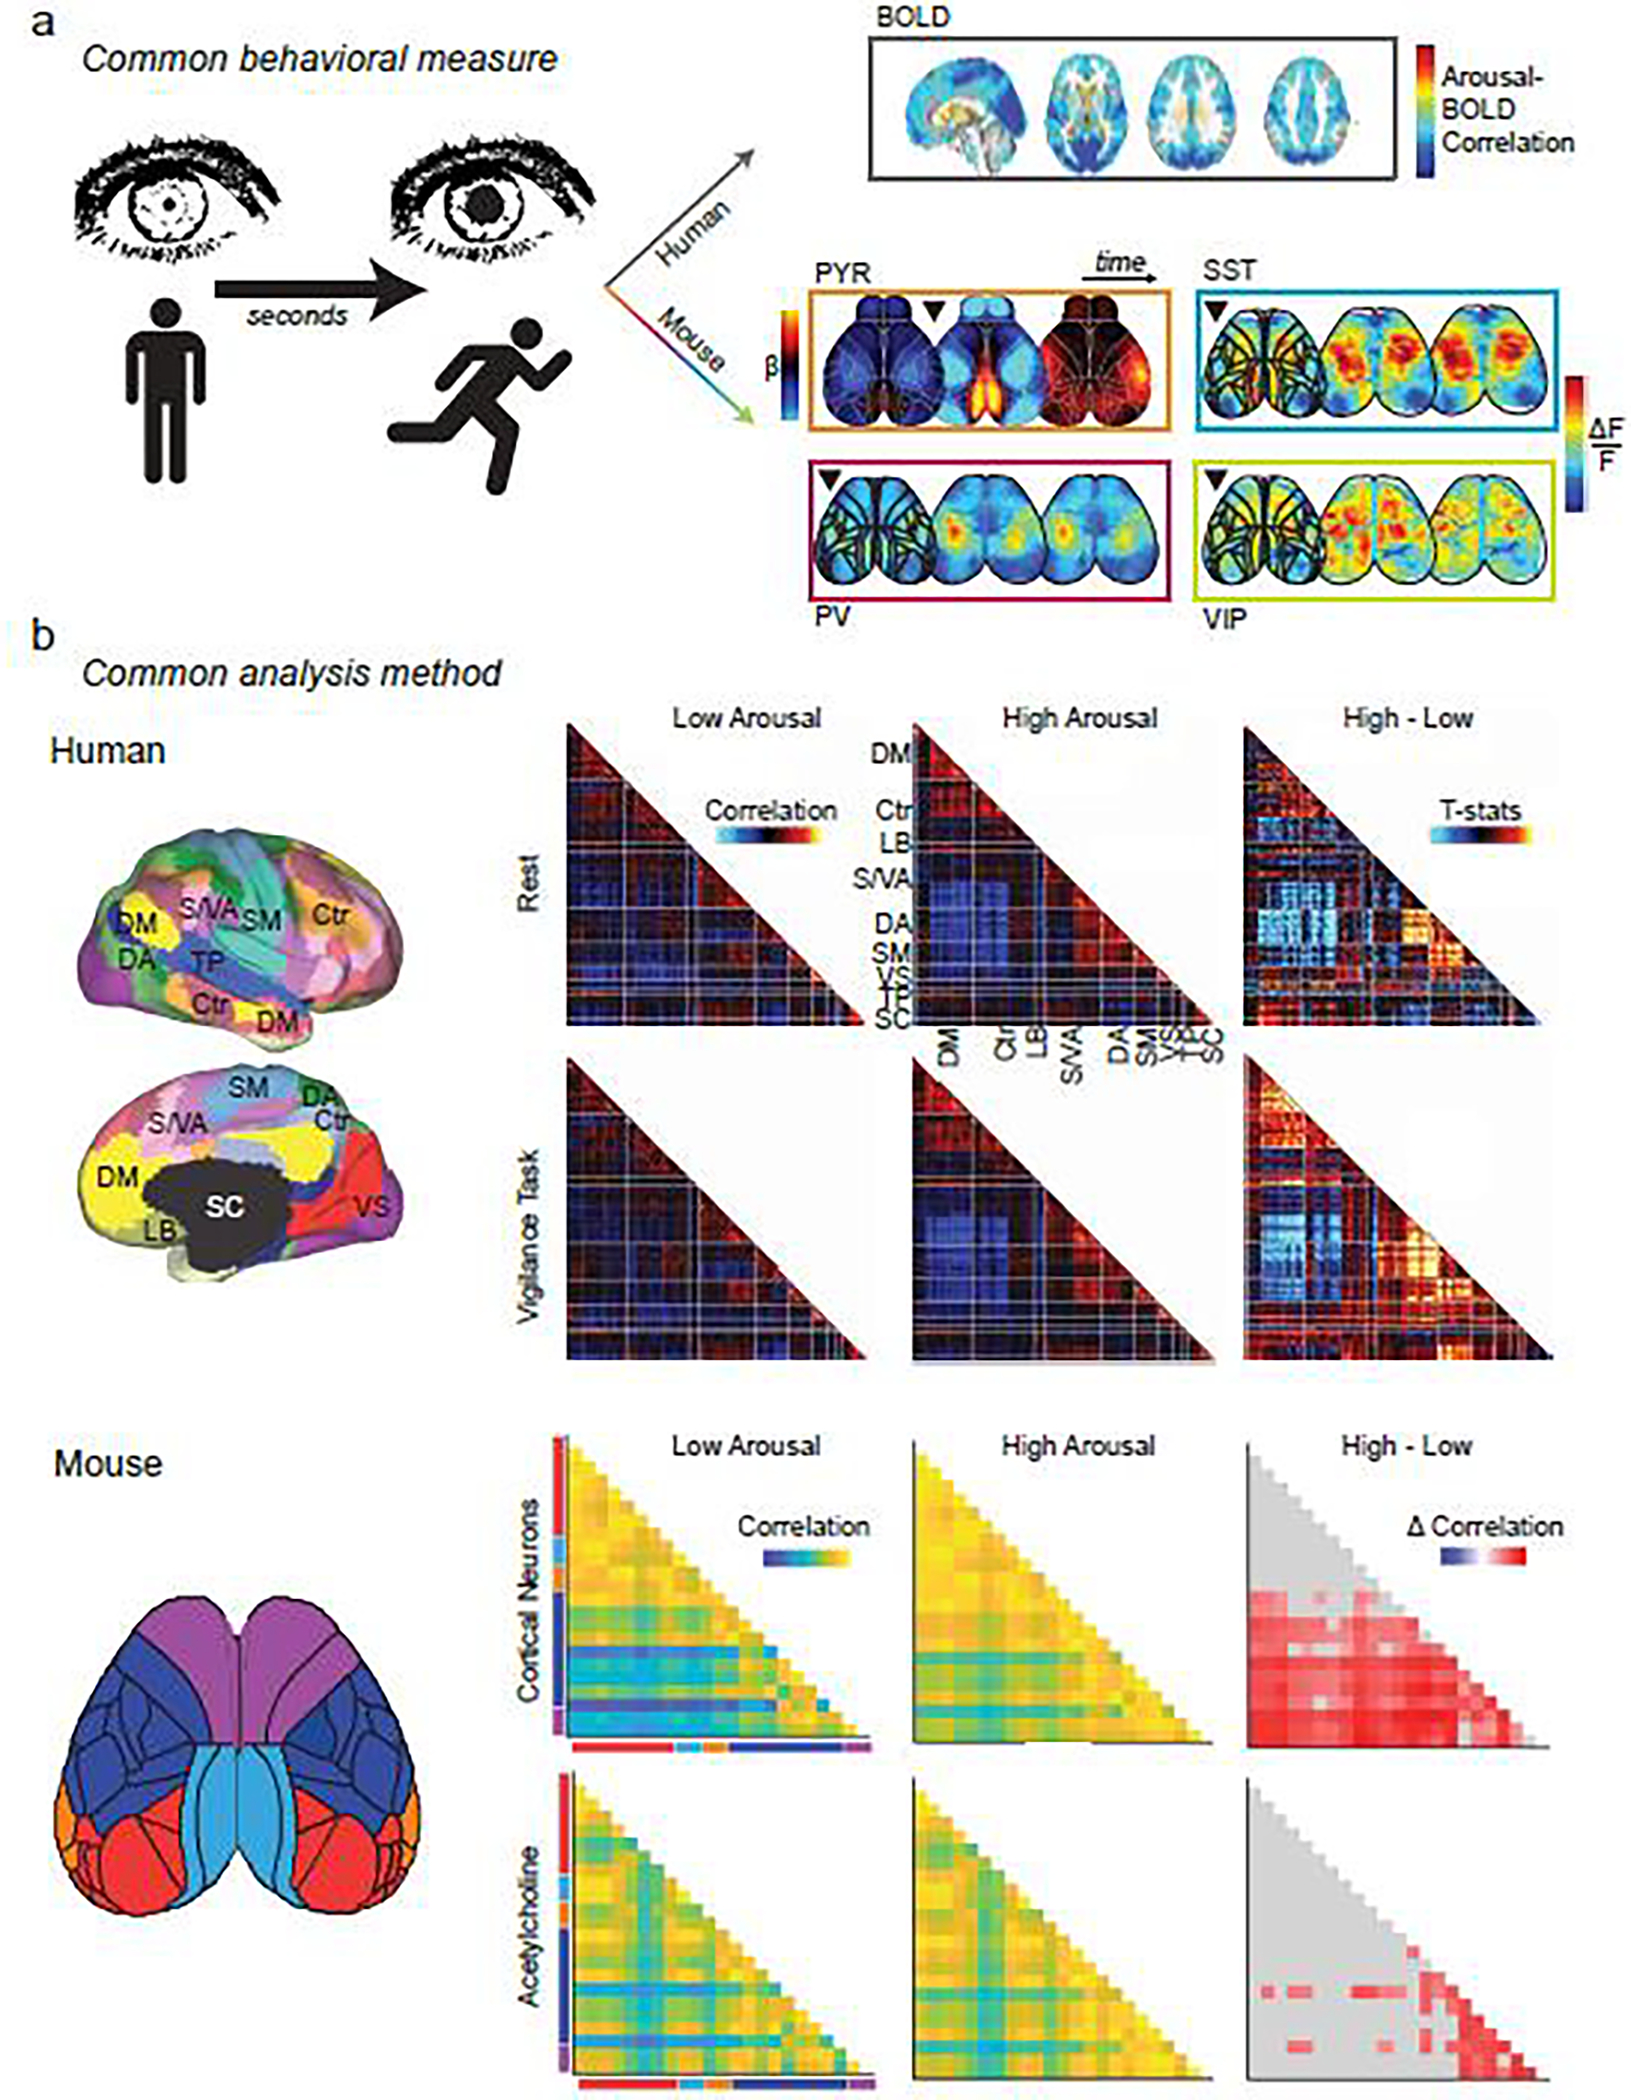
The rapid and coordinated propagation of neural activity across the brain provides the foundation for complex behavior and cognition. Technical advances across neuroscience subfields have advanced understanding of these dynamics, but points of convergence are often obscured by semantic differences, creating silos of subfield-specific findings. In this review we describe how a parsimonious conceptualization of brain state as the fundamental building block of whole-brain activity offers a common framework to relate findings across scales and species. We present examples of the diverse techniques commonly used to study brain states associated with physiology and higher-order cognitive processes, and discuss how integration across them will enable a more comprehensive and mechanistic characterization of the neural dynamics that are crucial to survival but are disrupted in disease.

Keywords: arousal; integrative neuroscience; multiscale analysis; neural dynamics; spontaneous activity.


Conflict of interest statement

Declaration of interests The authors declare no competing interests.

Figures

Figure 1.
Figure 1.. Systems and cognitive neuroscience techniques each offer partial, but complementary, insight into brain states.
In this example, three schematic brain states, A, B, and C, are depicted (upper left). Each brain state is defined by a stereotyped pattern of whole-brain activity, and brain states can occur in isolation (timepoint 2; bottom left) or in combination (timepoints 1 and 3). Commonly used techniques are schematized and placed (see corresponding point) according to their approximate, relative temporal resolution and spatial scale (i.e., field of view size), as typically implemented. Single-unit recording: Schematized raster plot represents cell spiking at three time points. Limited field of view is represented by focal patterns, and cell response heterogeneity that may obscure patterns is represented by incomplete “B” and “C”. The identity of the cells is typically unknown. Two-photon (2p) calcium imaging suffers from many of the same limitations (represented by focal, partial brain state patterns and heterogeneous calcium signal at the individual cell level), but can offer insight into cell-type specificity of brain state expression (represented by colored cells, each of which preferentially responds during the brain state of that color). Local field potentials (LFPs) capture regional fluctuations in activity with high temporal resolution, and can be used, for instance, to assess changes in frequency of extracellular oscillations across brain states. Mesoscopic single-photon (1p) calcium imaging has slightly lower temporal resolution, but captures cell type-specific patterns of brain activity across the cortical mantle, yielding more complete representations of brain states (though with limited resolution of activity in deep structures, represented by blurred pattern elements). Scalp electroencephalography (EEG), like LFPs, captures brain state-associated differences in power across frequency bands, but suffers from imprecise source localization (represented by enlarged, blurred, and conflated pattern elements – i.e., pattern D that merges brain states B and C). Functional magnetic resonance imaging (fMRI), like EEG, offers whole-brain coverage in humans, but has low temporal resolution, such that brain state patterns will be effectively averaged over seconds. In this example, the only resolved brain state will thus be brain state B, which persists across all time points.
Figure 2.
Figure 2.. Using physiological states and cognitive paradigms to characterize corresponding brain states.
a, In this article, we discuss brain states that correspond to physiological states and cognitive paradigms. The former offers an opportunity to study spontaneous fluctuations in brain activity, but the lack of clearly defined behavioral state boundaries complicates interpretation of these changes (though studies have demonstrated the potential to segment behavioral sequences from spontaneous activity, e.g. [156]). Cognitive paradigms can offer clearer behavioral state boundaries. b, As represented in simulated neural data embedded via dimensionality reduction in a two-dimensional state space, clusters of similar time points are clearly visible, but cannot be labeled (left panel). With a distinct and supporting modality, such as pupillometry to index arousal (middle panel), one can observe the influence of physiology on whole-brain activity, identifying time points at which patterns correspond to high and low arousal. Further interpretation of these brain states is made possible by knowledge about the structure of the cognitive paradigm during which data were collected (right panel), revealing stereotyped trajectories through state space on high- and low-engagement trials, with low-arousal activity patterns more common on low-engagement trials, perhaps tracking decreased task performance. These boundaries likely do not fully explain the brain’s traversal through state space (task-defined states can also be affected by other factors), underscoring the need to study brain states at multiple temporal scales (Fig. 3). Nevertheless, each approach offers distinct and complementary insight into the nature and functional implications of neural dynamics. Dim, dimension.
Figure 3.
Figure 3.. Behavioral states evolve at varied temporal scales and interact at each time point.
Left: four examples of behavioral (i.e., physiological and cognitive) state domains—mood, hunger, attention, and task performance—are depicted by simulated time courses. Each behavioral state unfolds on a different temporal scale, and brain activity at each moment in time reflects the combination of the behavioral states occurring and interacting at that time and the brain states underlying them. Right: examples of previous work studying patterns of brain activity (brain states) that correspond to each of these physiological and cognitive states in isolation. Top: Network reconfiguration tracks task performance, such that core centrality of task-relevant regions (area V4 on color discrimination trials and area hMT on motion discrimination trials) increases during preparation for trials on which participants respond correctly. Schematized depiction of results from[85]. Second from top: Functional connectivity patterns that predict low and high attention across two, independent datasets. Colored bars represent “lobes” (e.g., blue, temporal). Adapted from[86]. Second from bottom: Changes in whole-brain network organization, as measured using fMRI-based functional connectivity, in fed and fasted states. Each point represents a brain region, colored by network assignment (e.g., blue, visual network), with hub regions enlarged. Adapted from[157]. Bottom: differences in seed-based functional connectivity (FC) between bipolar mania and bipolar euthymia, and between healthy control and bipolar euthymia. Adapted from[158]. BPAD, bipolar affective disorder.
Figure 4.
Figure 4.. Using brain state to unify the study of neural dynamics.
Common behavioral measures link the study of brain states across species: a, Changes in arousal measures (i.e. pupil size, movement) occur on the order of seconds. Top right: the slow dynamics of BOLD fluctuations on this time scale yield persistent (but whole-brain) patterns related to changes in arousal. Adapted from [159]. Bottom right: faster dynamics (each image represents changes over ~300 msec) can be captured with cell-type specificity using mesoscopic calcium imaging in mice. Adapted from [37] (PYR) and [66] (PV, SST, VIP). Black triangle represents onset of increased arousal. By matching behavioral states across species, more invasive, higher resolution techniques in animal models can be leveraged to reveal mechanistic insights into the complex behavioral and cognitive processes that can uniquely be studied in humans. Shared analytic methods also provide a tool to bridge disciplines: b, Whole-brain activity patterns can be divided into parcels within functionally defined regions (left) and pairwise correlations of parcels’ time courses yield functional connectivity (FC) matrices, whether from fMRI data in humans (left top) or from mesoscopic functional imaging data in mice (left bottom). FC can be calculated across physiological states (low versus high arousal) from data acquired during a given cognitive state (e.g. rest versus task) or from measures of neuronal activity or acetylcholine release. These FC matrices can be used to reveal common features of low- and high-arousal brain state patterns and yield mechanistic insight into how these states may be generated. For example, tasks amplify arousal-related FC increases in somato-motor networks in humans (right top and upper middle matrices). Adapted from [160]. Increases in arousal also cause correlated acetylcholine release and synchronize neuronal activity in analogous networks in mice (right lower middle and bottom matrices). Adapted from [27]. Human network labels: DM, default mode; Ctr: control; LB: limbic; S/VA: salience/ventral attention; DA: dorsal attention; SM: somato-motor; VS: visual; TP: temporo-parietal; SC: subcortical. Mouse network labels: red: visual; light blue: retrosplenial; orange: auditory; dark blue: somatosensory; purple: motor.

References

    1. McGinley MJ et al. (2015) Cortical Membrane Potential Signature of Optimal States for Sensory Signal Detection. Neuron 87, 179–192 - PMC - PubMed
    1. Gonzalez-Castillo J and Bandettini PA (2018) Task-based dynamic functional connectivity: Recent findings and open questions. NeuroImage 180, 526–533 - PMC - PubMed
    1. Poulet JFA and Crochet S (2018) The Cortical States of Wakefulness. Front. Syst. Neurosci. 12 - PMC - PubMed
    1. McCormick DA et al. (2020) Neuromodulation of Brain State and Behavior. Annual Review of Neuroscience 43, 391–415 - PMC - PubMed
    1. Flavell SW et al. (2022) The emergence and influence of internal states. Neuron 110, 2545–2570 - PMC - PubMed

Publication types