. 2023 May 10;14(1):2692.
doi: 10.1038/s41467-023-38360-5.

Spatially resolved multi-omics highlights cell-specific metabolic remodeling and interactions in gastric cancer

Affiliations

Spatially resolved multi-omics highlights cell-specific metabolic remodeling and interactions in gastric cancer

Chenglong Sun et al. Nat Commun. .

Abstract

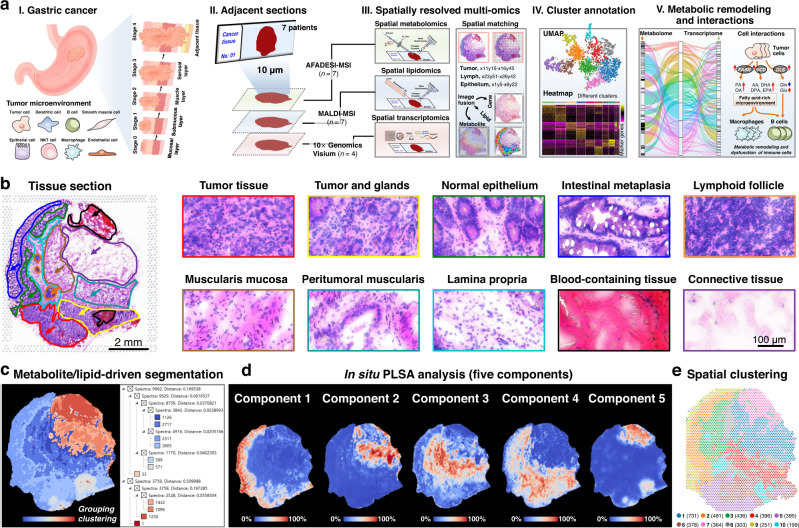
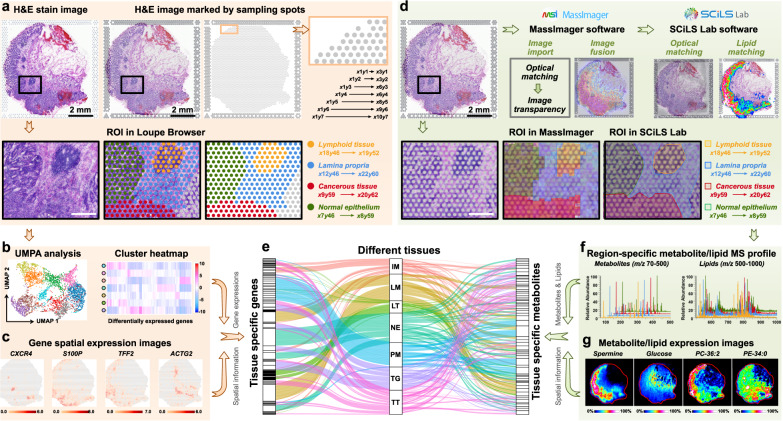
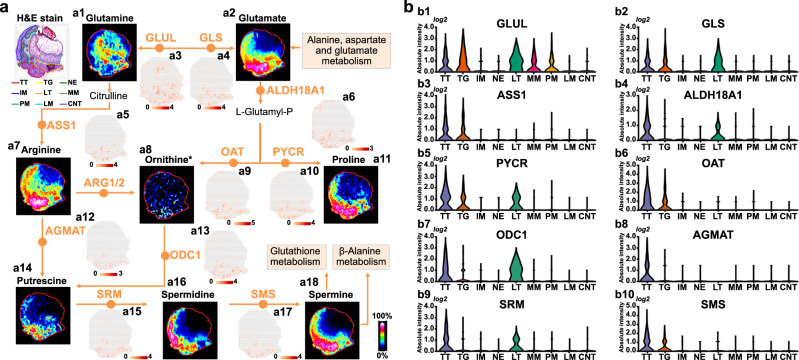
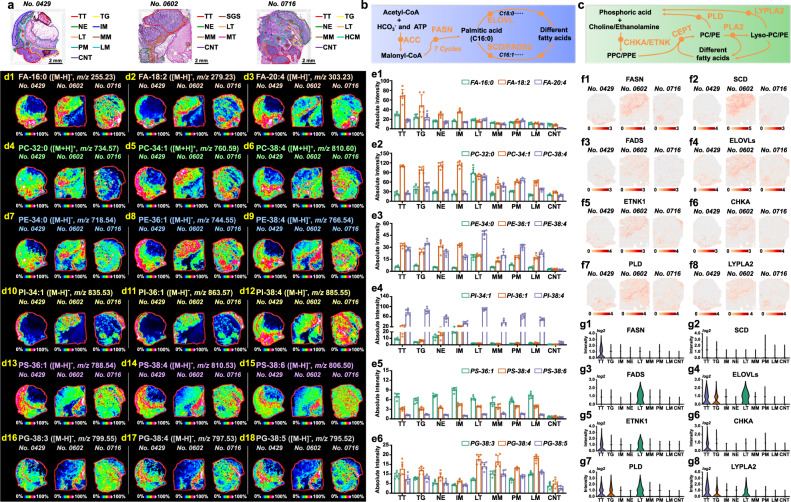
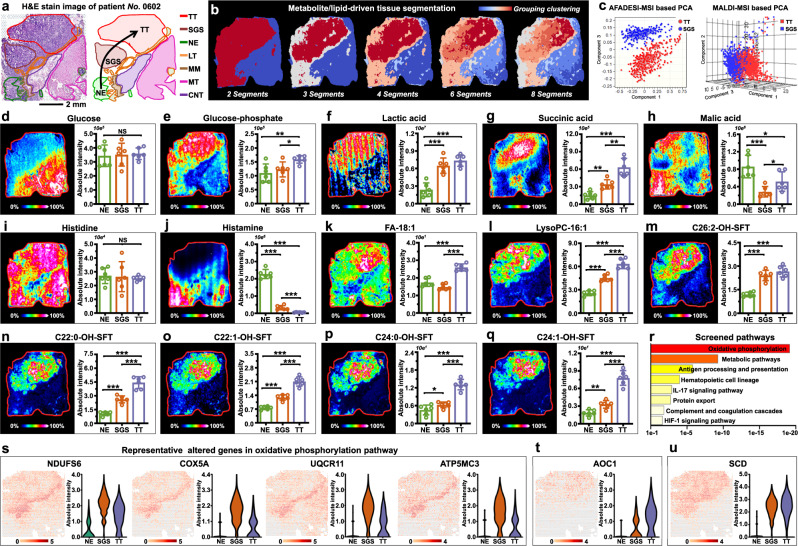
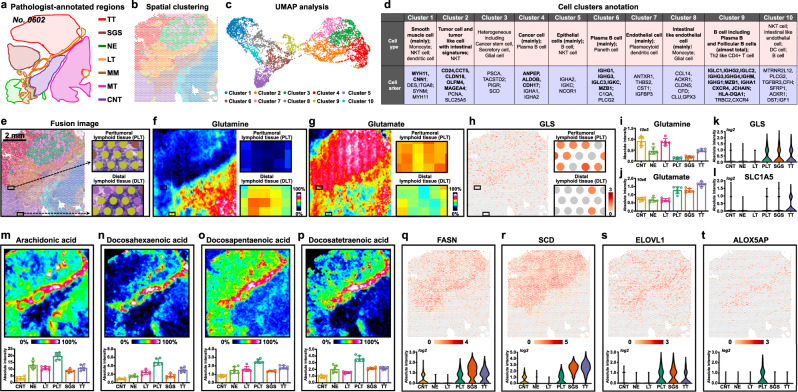
Mapping tumor metabolic remodeling and their spatial crosstalk with surrounding non-tumor cells can fundamentally improve our understanding of tumor biology, facilitates the designing of advanced therapeutic strategies. Here, we present an integration of mass spectrometry imaging-based spatial metabolomics and lipidomics with microarray-based spatial transcriptomics to hierarchically visualize the intratumor metabolic heterogeneity and cell metabolic interactions in same gastric cancer sample. Tumor-associated metabolic reprogramming is imaged at metabolic-transcriptional levels, and maker metabolites, lipids, genes are connected in metabolic pathways and colocalized in the heterogeneous cancer tissues. Integrated data from spatial multi-omics approaches coherently identify cell types and distributions within the complex tumor microenvironment, and an immune cell-dominated "tumor-normal interface" region where tumor cells contact adjacent tissues are characterized with distinct transcriptional signatures and significant immunometabolic alterations. Our approach for mapping tissue molecular architecture provides highly integrated picture of intratumor heterogeneity, and transform the understanding of cancer metabolism at systemic level.


Conflict of interest statement

The authors declare no competing interests.

Figures

Fig. 1
Fig. 1. Spatially resolved multi-omics reveals intratumor heterogeneity of gastric cancer.
a Strategy of integrated spatially resolved multi-omics for highlighting tumor metabolic remodeling and interactions. b H&E stain image of gastric cancer tissue section from patient “No.0429” and ×40 magnified H&E stain image of different gastric cancer tissue regions, scale bar = 2 mm for whole tissue section, scale bar = 100 μm for magnified images. The experiment was repeated three times. c Metabolite and lipid-driven tissue section segmentation based on the MALDI-MSI data. d Metabolite and lipid-driven in situ PLSA analysis. e Visium array spots colored by graph-based clustering algorithm.
Fig. 2
Fig. 2. The extraction of gene, lipid, and metabolite profiles in different tumor micro-regions.
a The process of extracting gene expression profiles in different tumor micro-regions of gastric cancer according to H&E stain image, scale bar = 2 mm for upper panels, scale bar = 500 μm for lower panels. The H&E stain experiment was repeated three times. b UMAP analysis and cluster heatmap of specifically expressed genes in different tumor micro-regions. c Spatial expression images of representative genes in gastric cancer tissue section (intensity in colour scale is log2 transformed). d The process of extracting metabolite and lipid profiles according to sampling spots-labeled H&E stain image, scale bar = 2 mm for upper panels, scale bar = 500 μm for lower panels. The H&E stain experiment was repeated three times. e Sankey diagram showing the distribution of marker genes and metabolites in different tissues. Each rectangle in the left represents a gene, each rectangle in the right represents a metabolite or lipid, each rectangle in the middle represents a tissue type, and the connection degree of each variable is showed based on the size of the rectangle. f Extracted region-specific metabolite and lipid profile. g MS images of representative metabolites and lipids in gastric cancer tissue section (intensity in colour scale is relative value). IM Intestinal metaplasia, LM Lamina propria, LT Lymphoid tissue, NE Normal epithelium, PM Peritumoral muscularis, TG Tumor and gland tissue, TT Tumor tissue.
Fig. 3
Fig. 3. Visualization of reprogrammed arginine and proline metabolism pathway in gastric cancer.
a MS images of key metabolites and spatial expression images of key genes in arginine and proline metabolism pathway (intensity in MS image colour scale is relative value, intensity in gene image colour scale is log2 transformed). b Violin plot show expression levels of key genes in arginine and proline metabolism pathway. *Ornithine only identified by high resolution MS spectrum. TT Tumor tissue, TG Tumor and gland tissue, NE Normal epithelium, IM Intestinal metaplasia, LT Lymphoid tissue, MM Muscularis mucosa, PM Peritumoral muscularis, LM Lamina propria, CNT Connective tissue.
Fig. 4
Fig. 4. Visualization of reprogrammed lipid synthesis and metabolism pathways in gastric cancer.
a H&E stain image of gastric cancer tissue section from patient “No.0429”, “No.0602”, and “No.0716”, scale bar = 2 mm. The experiment was repeated three times. b Fatty acid de novo synthesis pathway. c Synthesis and metabolism pathways of phosphatidylcholine and phosphatidylethanolamine. d MS images of representative lipids in gastric cancer tissues (intensity in colour scale is relative value). e Expression levels of representative lipids in different region spots of gastric cancer tissue from patient “No.0429” (seven tissue samples for spatial lipidomics, n = 6 independent section regions from patient “No.0429”, mean ± SD), p-values were calculated using the unpaired two-tailed t-test at confidence intervals 0.95. f Spatial expression images of key genes in lipid synthesis and metabolism pathways (intensity in colour scale is log2 transformed). g Expression levels of lipid metabolism-related key genes in different micro-regions of gastric cancer tissue from patient “No.0429”. TT Tumor tissue, TG Tumor and gland tissue, NE Normal epithelium, IM Intestinal metaplasia, LT Lymphoid tissue, MM Muscularis mucosa, PM Peritumoral muscularis, LM Lamina propria, CNT Connective tissue, SGS Serrated glandular structure, HCM Heterotopic cystic malformation.
Fig. 5
Fig. 5. Visualization of stepwise metabolic reprogramming in gastric cancer.
a H&E stain image of gastric cancer tissue section from patient “No.0602”, scale bar = 2 mm. The experiment was repeated three times. b Metabolite and lipid-driven tissue section segmentation. c PCA score plots based on AFADESI-MSI and MALDI-MSI data of tumor tissue (TT) and serrated glandular structure (SGS). dq MS images and levels of glucose, glucose-phosphate, lactic acid, succinic acid, malic acid, histidine, histamine, FA-18:1, Lyso-PC-16:1, C26:2-OH-SFT, C22:0-OH-SFT, C22:1-OH-SFT, C24:0-OH-SFT, and C24:1-OH-SFT in different gastric cancer tissue section spots (seven tissue samples for spatial metabolomics and lipidomics, n = 6 independent section regions from patient “No.0602”, mean ± SD), ***p < 0.001, **p < 0.01, *p < 0.05, p-values were calculated using the unpaired two-tailed t test at confidence intervals 0.95, intensity in colour scale is relative value. r Pathways enriched in SGS tissue. s Representative altered genes in oxidative phosphorylation pathway, intensity in colour scale is log2 transformed. t, u Spatial expression images of AOC1 and SCD, intensity in colour scale is log2 transformed. TT Tumor tissue, SGS Serrated glandular structure, NE Normal epithelium, LT Lymphoid tissue, MM Muscularis mucosa, MT Muscle tissue, CNT Connective tissue.
Fig. 6
Fig. 6. Imaging the immunometabolic reprogramming in tumor interface region of gastric cancer.
a Pathologist-annotated regions of cancer tissue section from patient “No.0602”. b Visium array spots colored by graph-based clustering algorithm. c UMAP plot of gastric cancer tissue colored by clusters. d Cell cluster annotation of gastric cancer tissue. e The fusion image of visium array spots and H&E stain image, scale bar = 2 mm. The H&E stain experiment was repeated three times. f, g MS images of glutamine and glutamate in whole gastric cancer tissue section and in lymphoid tissue regions, intensity in colour scale is relative value. h Spatial expression images of GLS in whole gastric cancer tissue section and in lymphoid tissue regions, intensity in colour scale is log2 transformed. il Expression levels of glutamine, glutamate, GLS genes and SLC1A5 in different gastric cancer tissue section spots (seven tissue samples for spatial metabolomics, n = 6 independent section regions from patient “No.0602”, mean ± SD), p-values were calculated using the unpaired two-tailed t-test at confidence intervals 0.95. mp MS images and expression levels of arachidonic acid, docosahexaenoic acid, docosapentaenoic acid, and docosatetraenoic acid in different gastric cancer tissue section spots (seven tissue samples for spatial lipidomics, n = 6 independent section regions per tissue sample, mean ± SD), intensity in colour scale is relative value. qt Spatial images and expression levels of FASN, SCD, ELOVL1, and ALOX5AP in gastric cancer tissue, intensity in colour scale is log2 transformed. TT Tumor tissue, SGS Serrated glandular structure, NE Normal epithelium, LT Lymphoid tissue, PLT Peritumoral lymphoid tissue, MM Muscularis mucosa, MT Muscle tissue, CNT Connective tissue.

References

    1. Pavlova NN, Thompson CB. The emerging hallmarks of cancer metabolism. Cell Metab. 2016;23:27–47. - PMC - PubMed
    1. Reinfeld BI, et al. Cell-programmed nutrient partitioning in the tumour microenvironment. Nature. 2021;593:282–288. - PMC - PubMed
    1. Chang CH, et al. Metabolic competition in the tumor microenvironment is a driver of cancer progression. Cell. 2015;162:1229–1241. - PMC - PubMed
    1. Bayik D, Lathia JD. Cancer stem cell-immune cell crosstalk in tumour progression. Nat. Rev. Cancer. 2021;21:526–536. - PMC - PubMed
    1. Karczewski KJ, Snyder MP. Integrative omics for health and disease. Nat. Rev. Genet. 2018;19:299–310. - PMC - PubMed

Publication types