. 2023 May 10;13(1):7590.
doi: 10.1038/s41598-023-33641-x.

Assessing cohesion and diversity in the collaboration network of the SALURBAL project

Affiliations

Assessing cohesion and diversity in the collaboration network of the SALURBAL project

Sofía Baquero et al. Sci Rep. .

Erratum in

Abstract

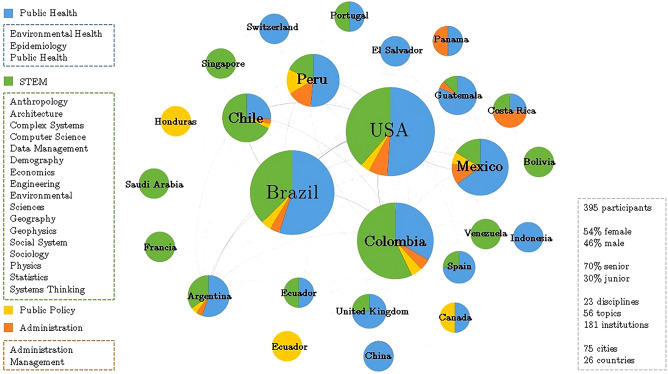
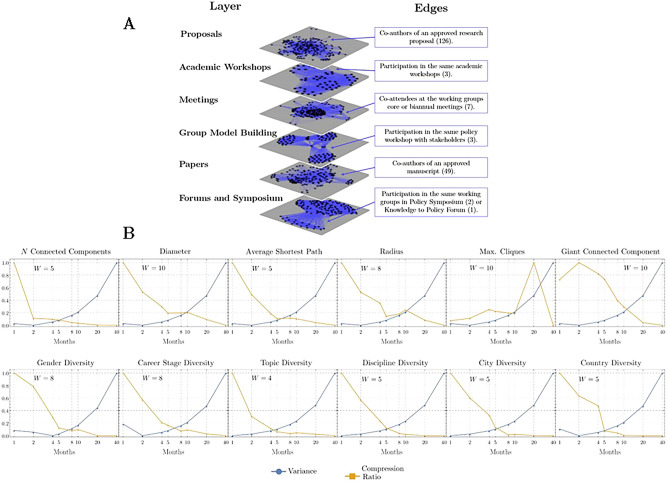
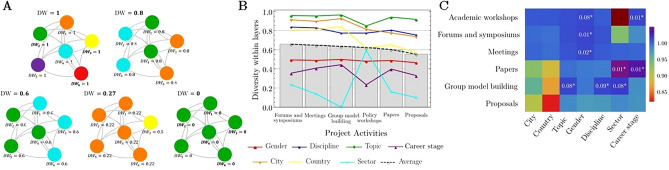
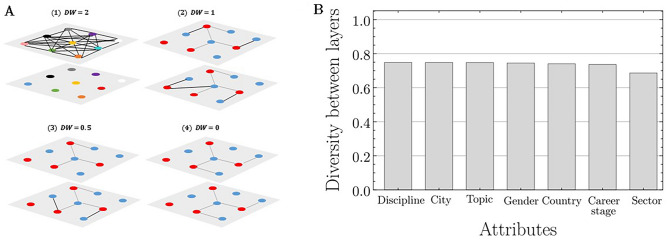
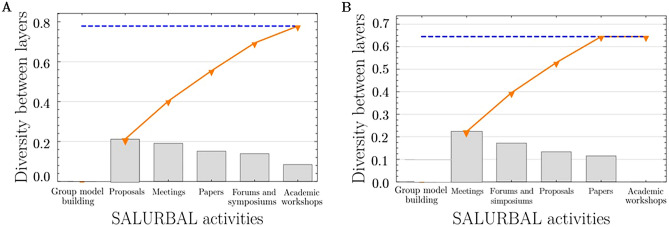
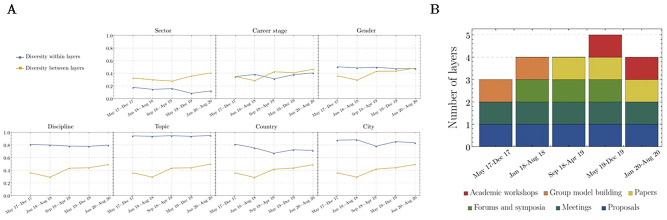
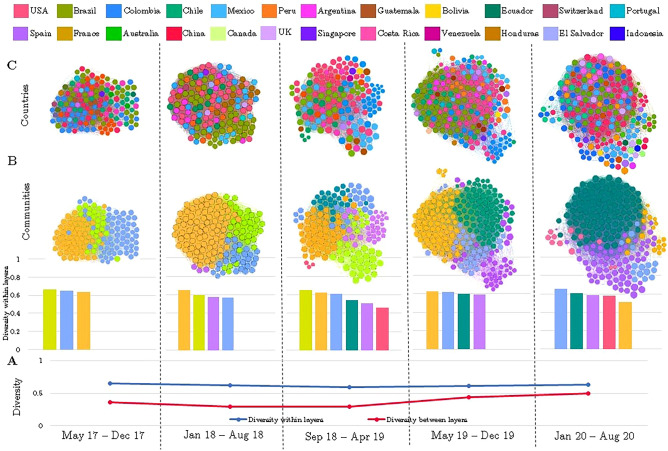
The SALURBAL (Urban Health in Latin America) Project is an interdisciplinary multinational network aimed at generating and disseminating actionable evidence on the drivers of health in cities of Latin America. We conducted a temporal multilayer network analysis where we measured cohesion over time using network structural properties and assessed diversity within and between different project activities according to participant attributes. Between 2017 and 2020 the SALURBAL network comprised 395 participants across 26 countries, 23 disciplines, and 181 institutions. While the cohesion of the SALURBAL network fluctuated over time, overall, an increase was observed from the first to the last time point of our analysis (clustering coefficient increased [0.83-0.91] and shortest path decreased [1.70-1.68]). SALURBAL also exhibited balanced overall diversity within project activities (0.5-0.6) by designing activities for different purposes such as capacity building, team-building, research, and dissemination. The network's growth was facilitated by the creation of new diverse collaborations across a range of activities over time, while maintaining the diversity of existing collaborations (0.69-0.75 between activity diversity depending on the attribute). The SALURBAL experience can serve as an example for multinational research projects aiming to build cohesive networks while leveraging heterogeneity in countries, disciplines, career stage, and across sectors.


Conflict of interest statement

The authors declare no competing interests.

Figures

Figure 1
Figure 1
The SALURBAL interdisciplinary network by country. Each node represents a country that participated in the project. Node size represents the number of participants. Each node has a pie chart with the distribution of disciplines of its participants divided into fields for better visualization. The National Science Foundation's classification of STEM fields was used, except for STEM disciplines within public health that are included in public health.
Figure 2
Figure 2
SALURBAL temporal multilayer network. (A) The optimal temporal window size w that minimizes the absolute difference between variance V(Fw), and compression ratio RFw for each network measure using the TWIN algorithm. (B) The multilayer network structure of the SALURBAL Project. The nodes represent SALURBAL participants and the edges represent collaborations between participants as defined by the text box corresponding to each layer.
Figure 3
Figure 3
The diversity within layers (i.e., project activities). (A) Diversity within layers (DW) in five examples of working groups: (A.1) All the participants are from different countries, DW=1. (A.2) One-third of the participants are from USA (blue nodes), another third are from Brazil (green nodes), and the rest are from Mexico (orange nodes), DW=0.8. (A.3) Half of the participants are from Brazil and the other half from USA, DW=0.6. (A.4) One participant is from Colombia (yellow nodes), the rest are from Mexico, DW=0.27. (A.5) All the participants are from Brazil, DW=0. (B) The diversity within the SALURBAL Project activities. Each line represents the diversity of each attribute, by project activity. Each bar graph represents the overall diversity within a particular activity, i.e. the average diversity across all attributes. The bars are in order of highest to lowest average diversity of each activity. (C) The ratio of the SALURBAL diversity to the simulated diversity on 1000 randomly generated networks that preserve the degree sequence of the participants' attributes of the SALURBAL network. Each panel represents a project activity and an attribute diversity. The purple indicates a higher diversity than expected by chance. *The p-value < 0.1 indicates that there are significantly more diverse collaborations than expected by chance.
Figure 4
Figure 4
The diversity between layers (i.e., project activities). (A) Conceptual representation of the diversity between layers (DB) measure using four examples. Each layer represents an activity, each node represents a person in the project (red = female, blue = male) and the edges (or connections between nodes) represent collaborations between people. (A.1) In the most extreme and special case, where two layers are maximally different (DB=2), the nodes in one layer are completely disconnected (i.e., no collaborations exist for that activity), while the other layer is completely connected (i.e., every person is collaborating with every other person, and each person is different from every other person with respect to a given attribute (nodes are all different colors)). (A.2) Half of the diverse collaborations between people are unique (black edges) while the other half are the same in both activities (grey edges) (DB=1). (A.3) Most of the diverse collaborations are the same in both activities (gray edges) and there are very few collaborations that are unique to one activity and not the other (black edges) (DB=0.5). (A.4) The diversity between layers is zero (DB=0), that is, all the diverse collaborations are the same in both activities (gray edges). (B) The global diversity between layers for each attribute in the SALURBAL network, ordered from highest to lowest diversity between layers. The global diversity score for each attribute was calculated by evaluating the diversity between every possible pair of project activities, for a given attribute, and then aggregating this information into a single score using the layer reduction method.
Figure 5
Figure 5
Shows, in descending order, the diversity contribution of each activity (bars) towards the diversity between layers for two attributes: discipline (A) and sector (B). The orange line represents the cumulative diversity between layers as it grows with the contribution of each project activity. The blue dash line shows the global diversity between layers for that attribute. The diversity contribution of each activity (i.e., each bar) is calculated through a series of pairwise comparisons between that activity, and each activity to its left. For example, in figure A, the diversity contribution of papers is determined by making pairwise comparisons between papers and meetings, papers and proposals and papers and group-model building activities, and then aggregating this information into a single score using the layer reduction method. (A) Group model building, and proposals are the largest contributors to between layer diversity in discipline by bringing the 27% of the global diversity, while (B) Group model building, and meetings contribute most to between layer diversity across sector by bringing the 35% of the global diversity. Note: the remaining attributes, including, gender, country, city, career stage, and research topic are not depicted as the contribution of each activity towards the diversity between layers for these attributes closely resembles the patterns observed for discipline, shown in figure (A).
Figure 6
Figure 6
SALURBAL Project diversity over time (2017–2020). (A) Diversity within (orange line) and between (blue line) layers for each attribute over time. (B) Distribution of the project activities over time.
Figure 7
Figure 7
SALURBAL collaboration network over time (2017–2020). Each node represents a project participant. Node size represents the diversity of the participant's collaborations, the smaller the node, the lower the diversity. (A) The average diversity within layers of all the SALURBAL activities vs the global diversity between layers over time. (B) Diversity within communities over time, where the node color represents the participant´s community. The communities are the groups of participants that are highly interconnected, as defined by the Louvain method, compared to the rest of participants. Each bar graph represents the community´s diversity by averaging across all attributes. (C) SALURBAL network where each node color represents the participant´s country.

References

    1. Wuchty, S., Jones, B. F. & Uzzi, B. The increasing dominance of teams in production of knowledge. Science (80-. ).316, 1036–1039 (2007). - PubMed
    1. Freshwater D, Sherwood G, Drury V. International research collaboration: Issues, benefits and challenges of the global network. J. Res. Nurs. 2006;11:295–303. doi: 10.1177/1744987106066304. - DOI
    1. Adams J. Collaborations: The rise of research networks. Nature. 2012;490:335–336. doi: 10.1038/490335a. - DOI - PubMed
    1. United Nations Development Programme. Goal 9: Industrial innovation and infrastructure. UNDPhttps://www1.undp.org/content/seoul_policy_center/en/home/sustainable-de... (2015).
    1. UNESCO Institute for Statistics. Research and development expenditure (% of GDP) | Data. World Bankhttps://data.worldbank.org/indicator/GB.XPD.RSDV.GD.ZS?most_recent_value... (2018).

Publication types