. 2023 May 10;10(1):263.
doi: 10.1038/s41597-023-02163-6.

A spatio-temporal dataset on food flows for four West African cities

Affiliations

A spatio-temporal dataset on food flows for four West African cities

Hanna Karg et al. Sci Data. .

Abstract

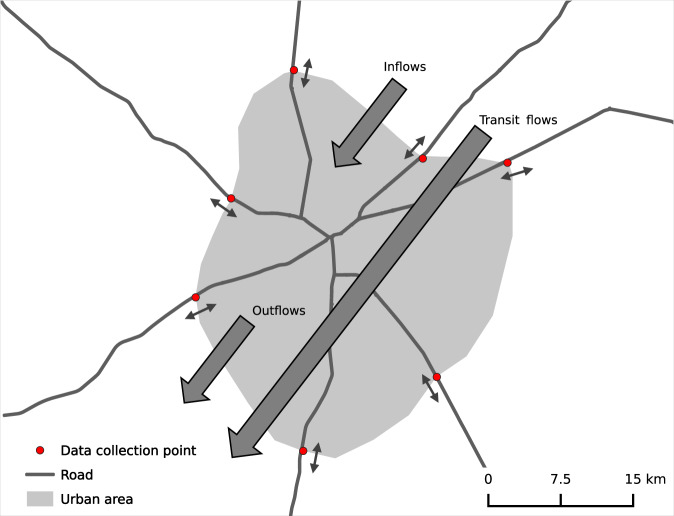
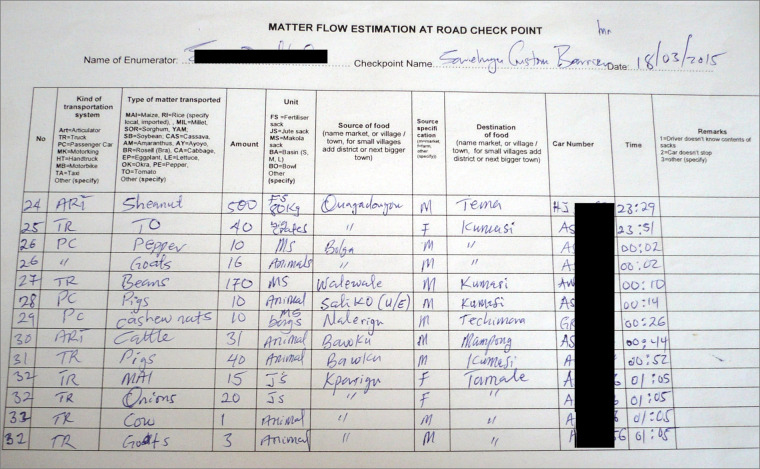
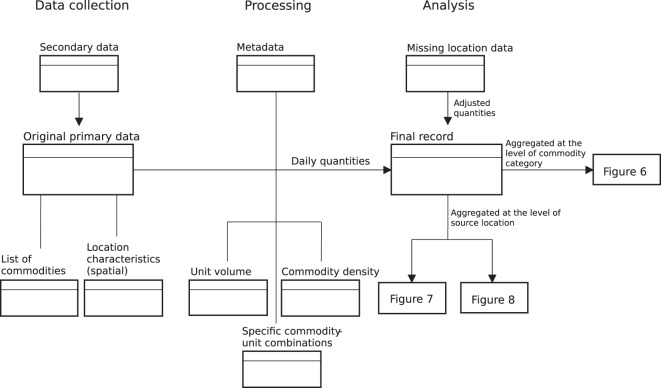
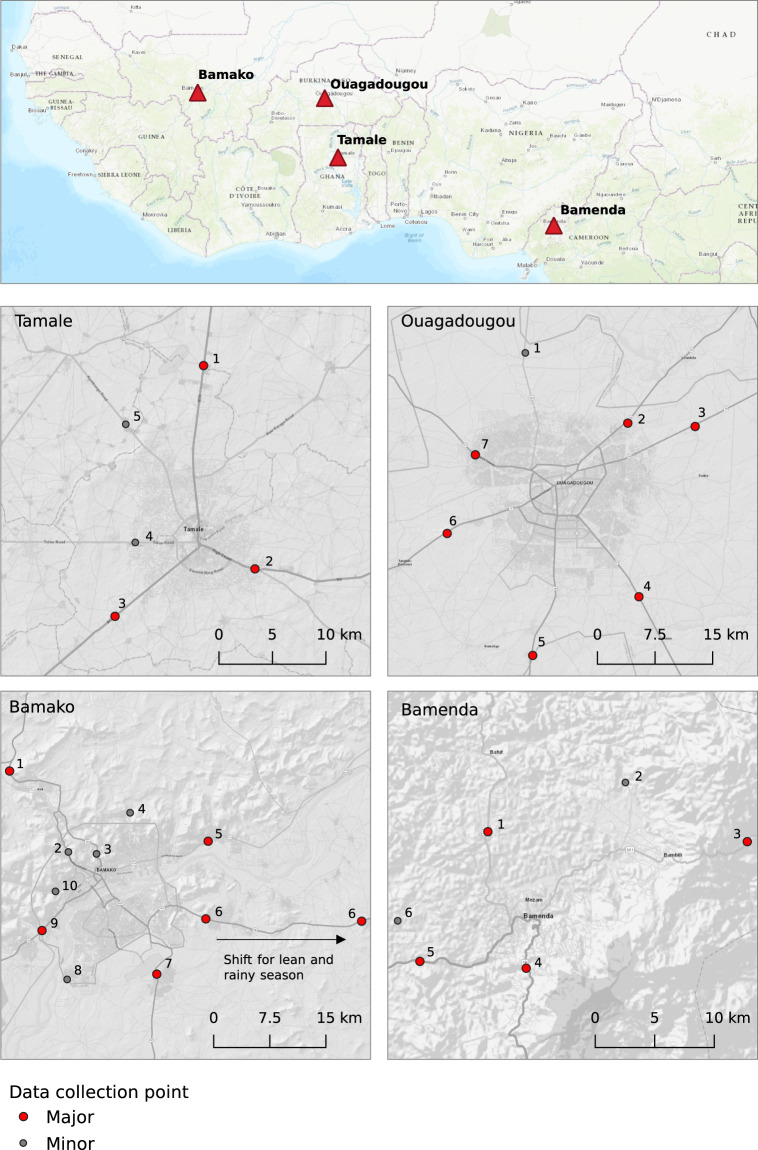
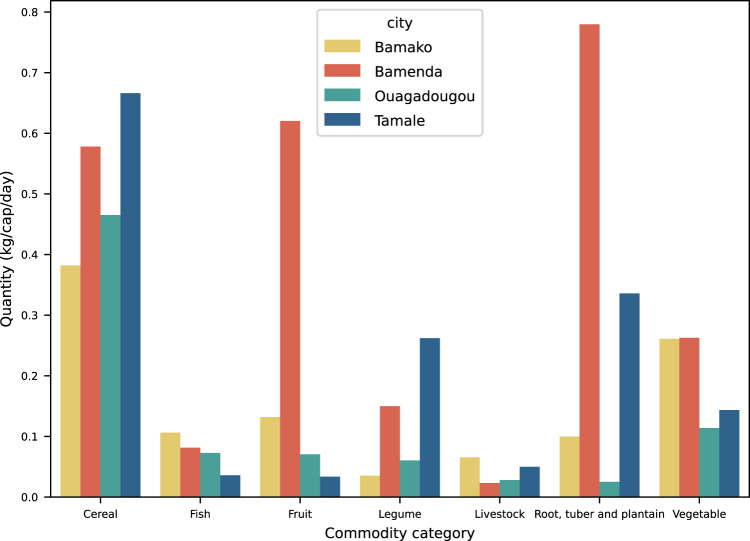
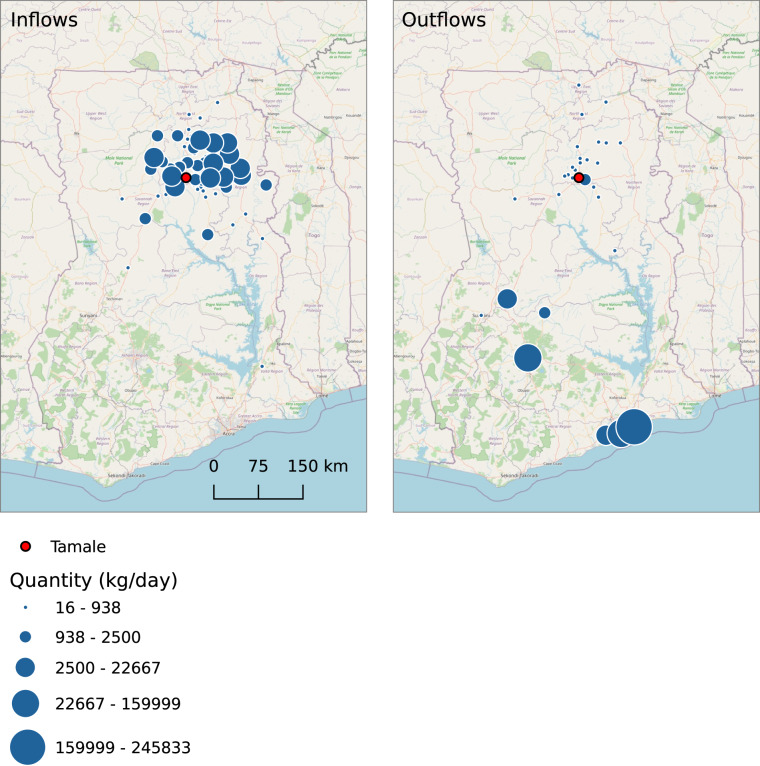
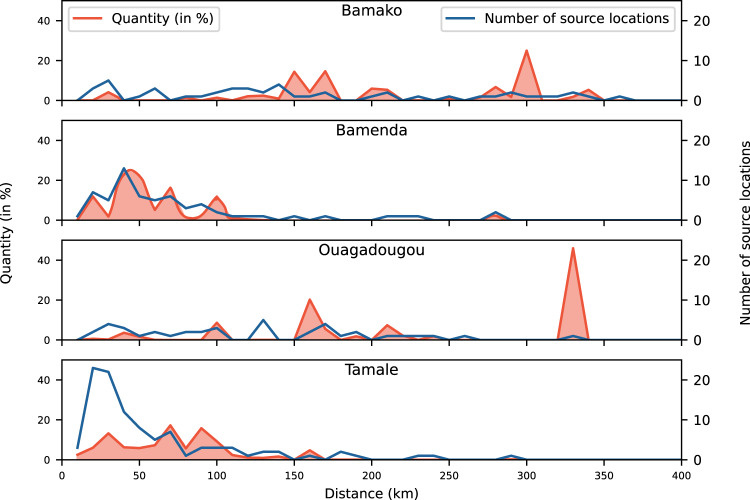
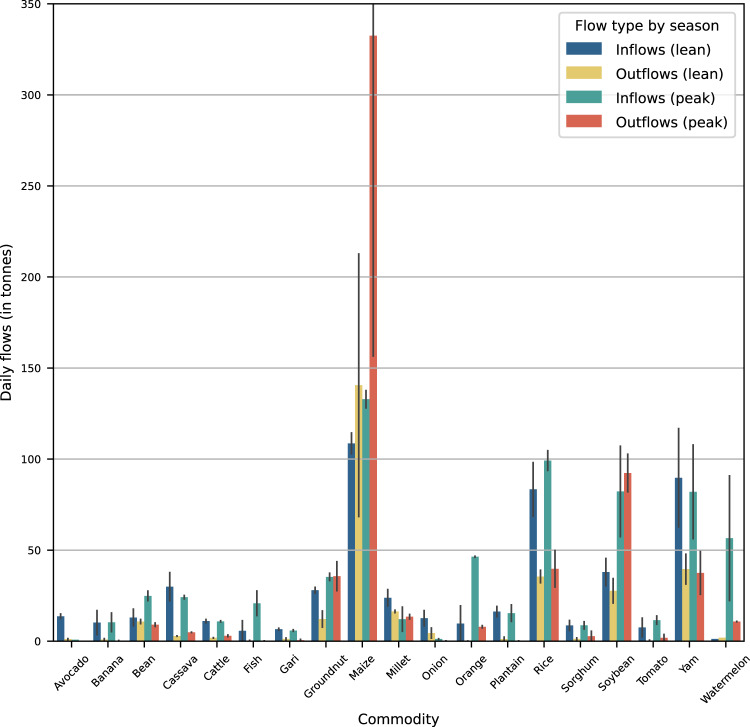
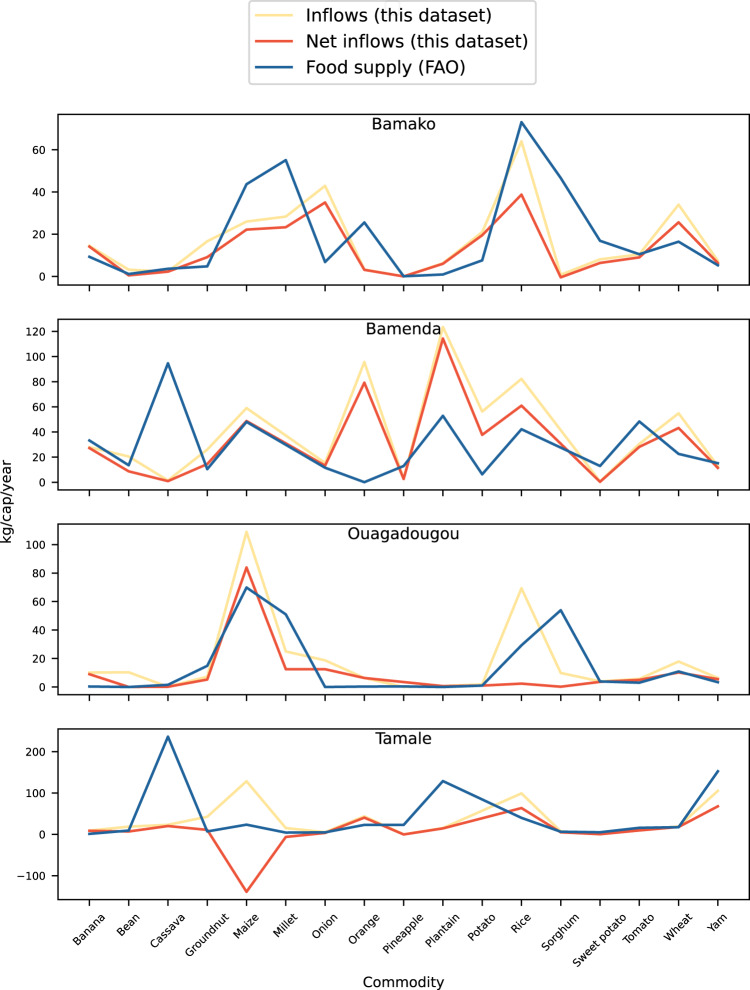
Gaining insight into the food sourcing practices of cities is important to understand their resilience to climate change, economic crisis, as well as pandemics affecting food supply and security. To fill existing knowledge gaps in this area food flow data were collected in four West African cities - Bamako (Mali), Bamenda (Cameroon), Ouagadougou (Burkina Faso), and Tamale (Ghana). The data cover, depending on the city, road, rail, boat, and air traffic. Surveys were conducted for one week on average during the peak harvest, lean, and rainy seasons, resulting in a dataset of over 100,000 entries for 46 unprocessed food commodities. The data collected includes information on the key types of transportation used, quantity, source, and destination of the food flows. The data were used to delineate urban foodsheds and to identify city-specific factors constraining rural-urban linkages. The data can also be employed to inform academic and policy discussions on urban food system sustainability, to validate other datasets, and to plan humanitarian aid and food security interventions.


Conflict of interest statement

The authors declare no competing interests.

Figures

Fig. 1
Fig. 1
Map showing the three types of flows (inflows, outflows, and transit flows) considered in this study of the four West African cities of Bamako (Mali), Bamenda (Cameroon), Ouagadougou (Burkina Faso), and Tamale (Ghana).
Fig. 2
Fig. 2
Paper form used for data collection.
Fig. 3
Fig. 3
Flow diagram describing data collection, processing, and analysis of the four West African cities of Bamako (Mali), Bamenda (Cameroon), Ouagadougou (Burkina Faso), and Tamale (Ghana).
Fig. 4
Fig. 4
Location of major and minor data collection points along access roads to the four studied West African cities of Bamako (Mali), Bamenda (Cameroon), Ouagadougou (Burkina Faso), and Tamale (Ghana) (Map sources: ESRI, 2023,. Note: North of Bamako, data were collected at three checkpoints: two minor checkpoints close to the city boundary (#2, #3), where peri-urban food sources could be captured, and one major checkpoint at the main checkpoint in Kati (#1), where large, long-distance trucks stop. More detailed information on the checkpoints can be found in Supplementary Table 1.
Fig. 5
Fig. 5
(ad) Transport channels for food via a) road (in Bamenda; source: Prisly Dzesinyuy), b) rail in Ouagadougou, and via the Niger River in Bamako (from upstream [5c] and downstream sources recorded in Koulikoro near Bamako, Mali [5d]).
Fig. 6
Fig. 6
Daily per capita inflows (in kg/cap/day) per food group entering the West African cities of Bamako (Mali), Bamenda (Cameroon), Ouagadougou (Burkina Faso), and Tamale (Ghana) during the lean (hot) season.
Fig. 7
Fig. 7
In- and outflows in kg/day of maize in the peak season in Tamale (Ghana). Note: Quantities were not adjusted for missing locations.
Fig. 8
Fig. 8
Relative inflows of maize (in %) and number of maize source locations along a distance gradient aggregated at 10 km intervals in the four West African cities of Bamako (Mali), Bamenda (Cameroon), Ouagadougou (Burkina Faso), and Tamale (Ghana).
Fig. 9
Fig. 9
Average daily seasonal flows (in tonnes) in Tamale (Ghana) for major products over two consecutive years (peak season 2013, lean season 2014, peak season 2014, lean season 2015). Error bars indicate the minimum and maximum value.
Fig. 10
Fig. 10
Comparison of net inflows (inflows minus outflows) with FAO food supply (in kg/cap/year) for the four studied West African cities of Bamako (Mali), Bamenda (Cameroon), Ouagadougou (Burkina Faso), and Tamale (Ghana). Annual data were derived from averaging seasonal flows.

References

    1. Seto KC, Ramankutty N. Hidden linkages between urbanization and food systems. Science. 2016;352:943–945. doi: 10.1126/science.aaf7160. - DOI - PubMed
    1. OECD/SWAC. Africapolis (database). Available online at: www.africapolis.org (accessed December 1, 2022) (2020).
    1. AGRA (ed.). Africa Agriculture Status Report. Feeding Africa’s Cities: Opportunities, Challenges, and Policies for Linking African Farmers with Growing Urban Food Markets (Nairobi, Kenya, 2020).
    1. Hussein, K. & Suttie, D. Rural-urban linkages and food systems in sub-Saharan Africa. The rural dimension. IFAD, 2016.
    1. Moustier P, et al. The diverse and complementary components of urban food systems in the global South: Characterization and policy implications. Global Food Security. 2023;36:100663. doi: 10.1016/j.gfs.2022.100663. - DOI