. 2023 May 10;13(1):7575.
doi: 10.1038/s41598-023-34710-x.

Reduced mitophagy is an early feature of NAFLD and liver-specific PARKIN knockout hastens the onset of steatosis, inflammation and fibrosis

Affiliations

Reduced mitophagy is an early feature of NAFLD and liver-specific PARKIN knockout hastens the onset of steatosis, inflammation and fibrosis

R Undamatla et al. Sci Rep. .

Abstract

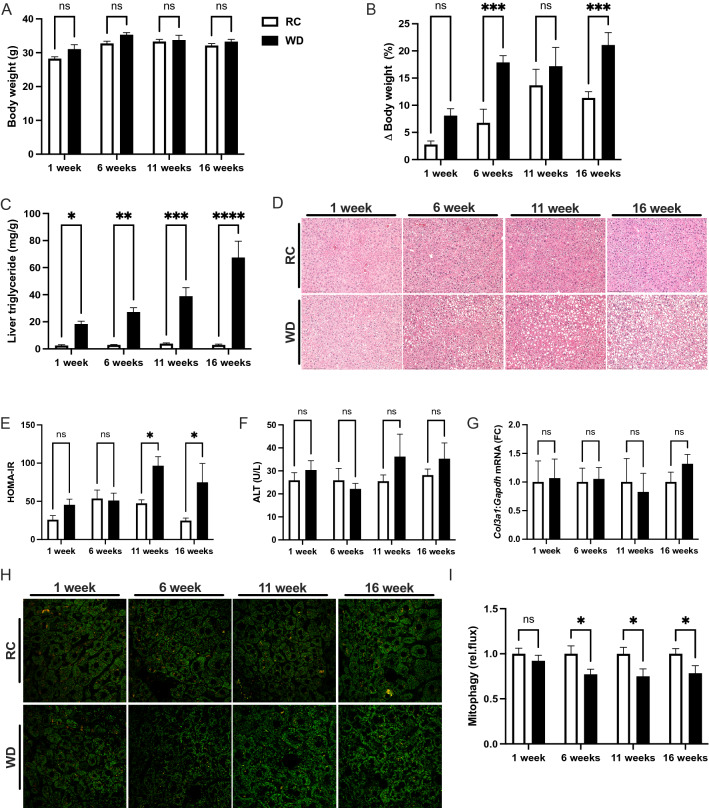
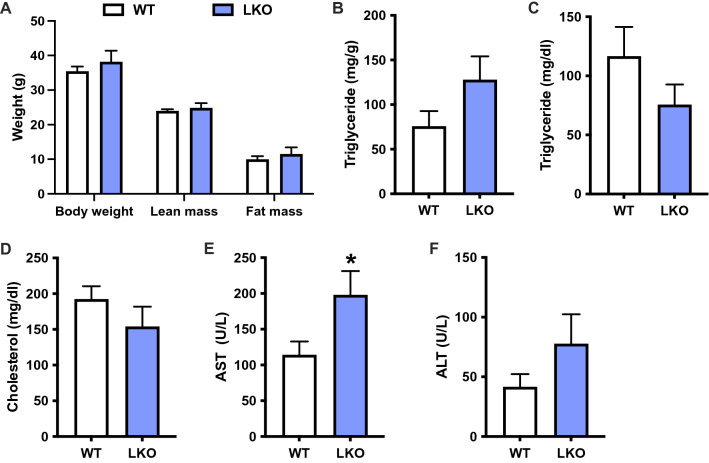
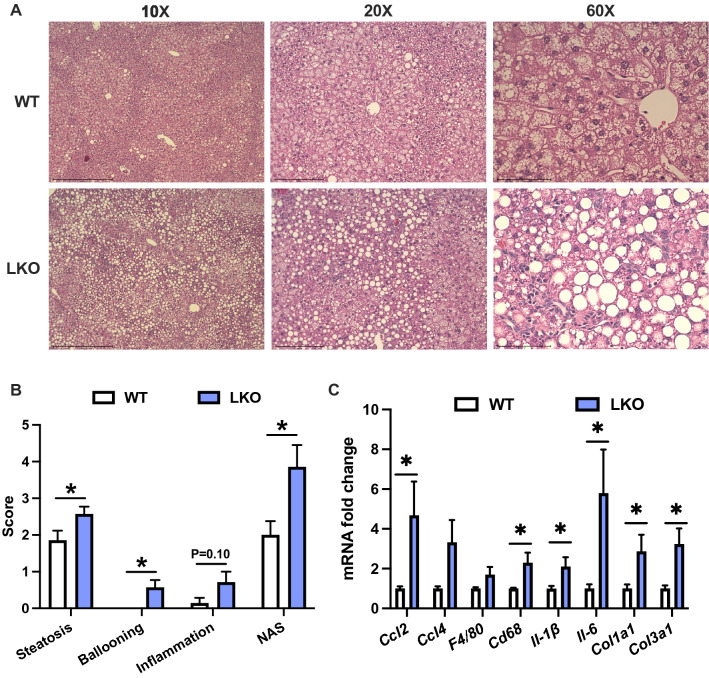
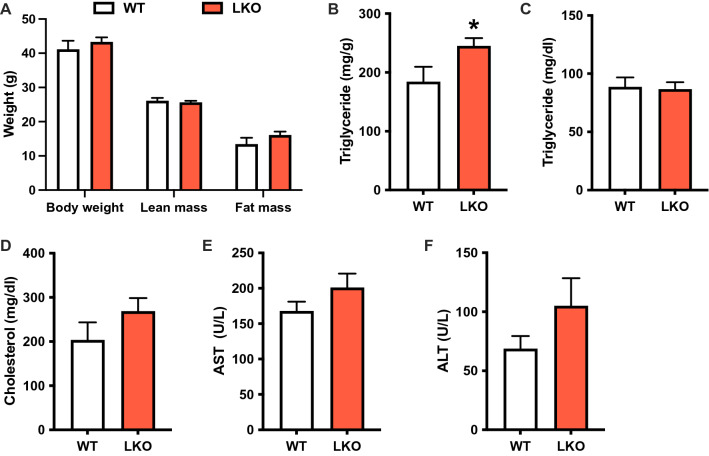
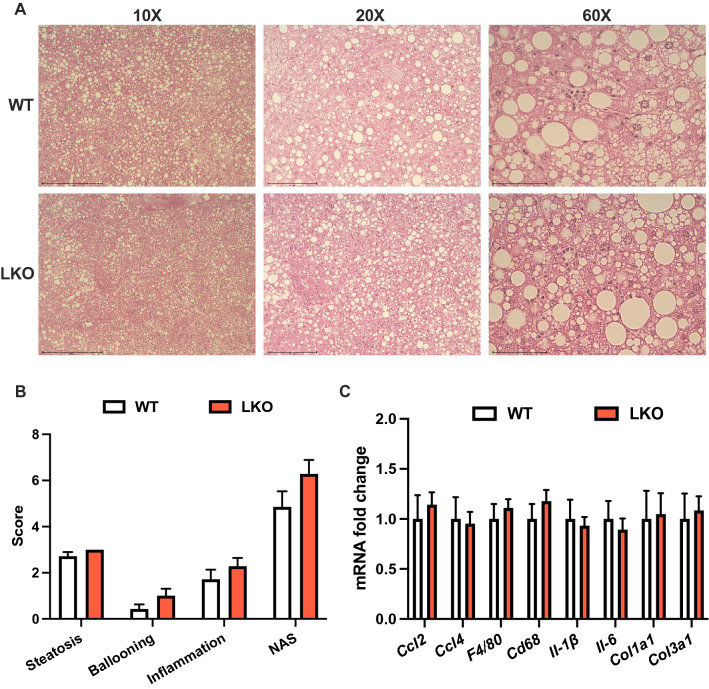
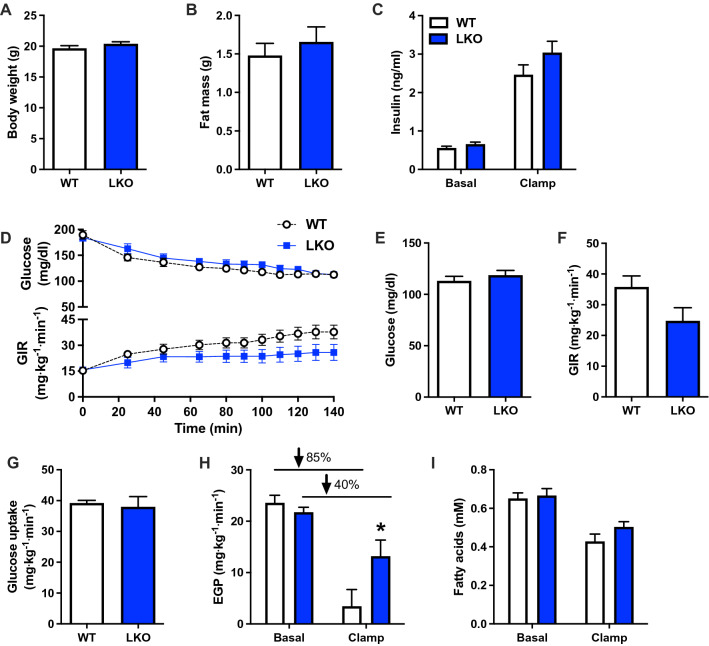
Nonalcoholic fatty liver disease (NAFLD) encompasses a spectrum of pathologies that includes steatosis, steatohepatitis (NASH) and fibrosis and is strongly associated with insulin resistance and type 2 diabetes. Changes in mitochondrial function are implicated in the pathogenesis of NAFLD, particularly in the transition from steatosis to NASH. Mitophagy is a mitochondrial quality control mechanism that allows for the selective removal of damaged mitochondria from the cell via the autophagy pathway. While past work demonstrated a negative association between liver fat content and rates of mitophagy, when changes in mitophagy occur during the pathogenesis of NAFLD and whether such changes contribute to the primary endpoints associated with the disease are currently poorly defined. We therefore undertook the studies described here to establish when alterations in mitophagy occur during the pathogenesis of NAFLD, as well as to determine the effects of genetic inhibition of mitophagy via conditional deletion of a key mitophagy regulator, PARKIN, on the development of steatosis, insulin resistance, inflammation and fibrosis. We find that loss of mitophagy occurs early in the pathogenesis of NAFLD and that loss of PARKIN accelerates the onset of key NAFLD disease features. These observations suggest that loss of mitochondrial quality control in response to nutritional stress may contribute to mitochondrial dysfunction and the pathogenesis of NAFLD.


Conflict of interest statement

The authors declare no competing interests.

Figures

Figure 1
Figure 1
Reduced mitophagy is an early feature of NAFLD. (A) Body weights at one, six, 11 and 16 weeks for regular chow (RC) and western diet (WD)-fed mito-Keima mice. (B) Change in body weight expressed as the percent increase from baseline prior to initiating WD. (C) Liver triglyceride levels expressed as mg triglyceride per g tissue. (D) Representative H&E stained liver sections from mito-Keima mice at each experimental timepoint. (E) HOMA-IR calculated from plasma glucose and insulin levels as a surrogate for insulin resistance. (F) Plasma ALT levels from mito-Keima mice at each timepoint. (G) QPCR data showing gene expression of Col3a1 relative to Gapdh expressed as the fold-change relative to RC-fed mice at each timepoint. (H) Representative images from confocal microscopy used to determine relative rates of mitophagy using mito-Keima. (I) Relative rates of mitophagy calculated as the ratio of red signal to the total of red and green signal, expressed as fold-change relative to RC group at each timepoint. Data are the mean ± s.e.m. for n = 5–10 mice per group. Data were analyzed by 2-way ANOVA followed by multiple comparison testing. *p < 0.05, **p < 0.01, ***p < 0.001.
Figure 2
Figure 2
Liver injury is exacerbated after short-term western diet feeding in liver-specific PARKIN knockout mice. (A) Body weight and composition (fat and lean mass) for WT and LKO mice after 6 weeks WD feeding. (B) Liver triglyceride levels expressed as mg triglyceride per g liver. (C) Plasma triglyceride levels. (D) Plasma cholesterol levels. (E) Plasma AST levels. (F) Plasma ALT levels. Data are the mean ± s.e.m. for n = 6–7 mice per group. Data were analyzed by Student’s t-test. *p < 0.05.
Figure 3
Figure 3
NAFLD activity score and markers of inflammation and fibrosis are increased in short-term western diet-fed liver-specific PARKIN knockout mice. (A) Representative images of H&E-stained liver sections from six-week WD fed WT and LKO mice at 10X, 20X and 60X. (B) NAFLD activity score (NAS) consisting of steatosis (0–3), inflammation (0–3) and ballooning (0–2) grading and the composite (summed criteria) NAS. (C) Liver gene expression measured by QPCR for noted gene markers of inflammation and fibrosis. Target gene expression was calculated relative to Gapdh and expressed as fold-change relative to WT. Data are the mean ± s.e.m. for n = 6–7 mice per group. Data were analyzed by Student’s t-test. *p < 0.05.
Figure 4
Figure 4
Liver steatosis but not damage is increased after long-term western diet feeding in liver-specific PARKIN knockout mice. (A) Body weight and composition (fat and lean mass) for WT and LKO mice after 20 weeks WD feeding. (B) Liver triglyceride levels expressed as mg triglyceride per g liver. (C) Plasma triglyceride levels. (D) Plasma cholesterol levels. (E) Plasma AST levels. (F) Plasma ALT levels. Data are the mean ± s.e.m. for n = 7–8 mice per group. Data were analyzed by Student’s t-test. *p < 0.05.
Figure 5
Figure 5
Liver-specific PARKIN knockout does not affect the NAFLD activity score or markers of inflammation and fibrosis after long-term western diet feeding. (A) Representative images of H&E stained liver sections from 20-week WD fed WT and LKO mice at 10X, 20X and 60X. (B) NAFLD activity score (NAS) consisting of steatosis (0–3), inflammation (0–3) and ballooning (0–2) grading and the composite (summed criteria) NAS. (C) Liver gene expression measured by QPCR for noted gene markers of inflammation and fibrosis. Target gene expression was calculated relative to Gapdh and expressed as fold-change relative to WT. Data are the mean ± s.e.m. for n = 7–8 mice per group. Data were analyzed by Student’s t-test.
Figure 6
Figure 6
Hepatic insulin sensitivity is reduced in liver-specific PARKIN knockout mice after acute western diet feeding. (A) Body weights prior to hyperinsulinemic euglycemic clamp. (B) Fat mass prior to hyperinsulinemic euglycemic clamp. (C) Basal (6 h fasted) and clamped plasma insulin levels. (D) Plasma glucose levels (upper panel) and the glucose infusion rate (GIR; lower panels) during the clamp. (E) Clamped plasma glucose levels during steady-state or the final 40 min of the clamp. (F) GIR during steady-state. (G) Whole-body glucose uptake during steady-state. (H) Basal and clamped rates of endogenous (hepatic) glucose production (EGP). Percentages represent the percent suppression of EGP in fasted mice by insulin during the clamp. (I) Basal and clamped plasma fatty acid levels. Data are the mean ± s.e.m. for n = 9–10 mice per group. Data were analyzed by Student’s t-test. *p < 0.05.

Update of

References

    1. Kleiner DE, et al. Design and validation of a histological scoring system for nonalcoholic fatty liver disease. Hepatology. 2005;41:1313–1321. doi: 10.1002/hep.20701. - DOI - PubMed
    1. Brunt EM, et al. Nonalcoholic fatty liver disease. Nat. Rev. Dis. Primers. 2015;1:1–22. doi: 10.1038/nrdp.2015.80. - DOI - PubMed
    1. Wong RJ, et al. Nonalcoholic steatohepatitis is the second leading etiology of liver disease among adults awaiting liver transplantation in the United States. Gastroenterology. 2015;148:547–555. doi: 10.1053/j.gastro.2014.11.039. - DOI - PubMed
    1. Tilg H, Moschen AR, Roden M. NAFLD and diabetes mellitus. Nat. Rev. Gastroenterol. Hepatol. 2017;14:32–42. doi: 10.1038/nrgastro.2016.147. - DOI - PubMed
    1. Eslam M, Sanyal AJ, George J, International Consensus Panel MAFLD: A consensus-driven proposed nomenclature for metabolic associated fatty liver disease. Gastroenterology. 2020;158:1999–2014. doi: 10.1053/j.gastro.2019.11.312. - DOI - PubMed

Publication types

Substances