. 2023 May 10;13(1):7613.
doi: 10.1038/s41598-023-34408-0.

Anthropogenic change decouples a freshwater predator's density feedback

Affiliations

Anthropogenic change decouples a freshwater predator's density feedback

J S Sinclair et al. Sci Rep. .

Abstract

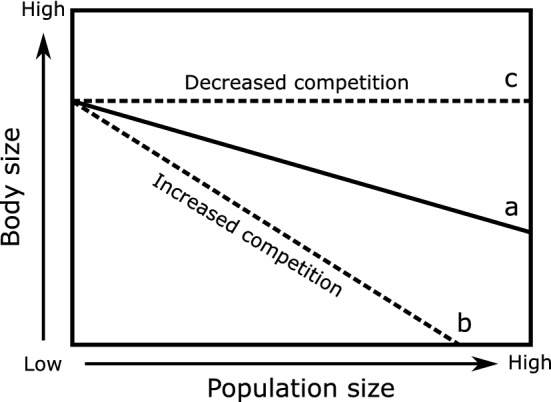
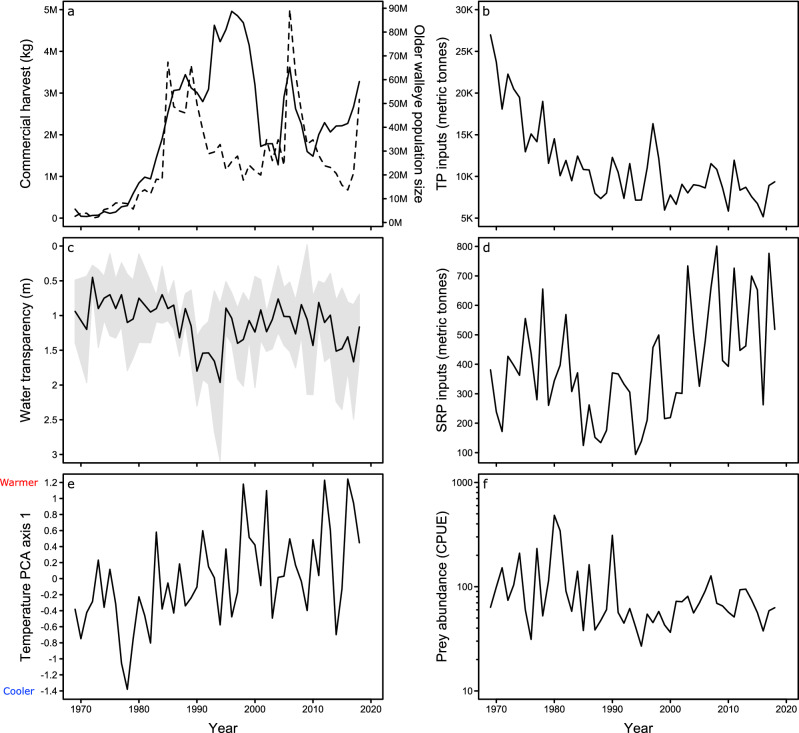
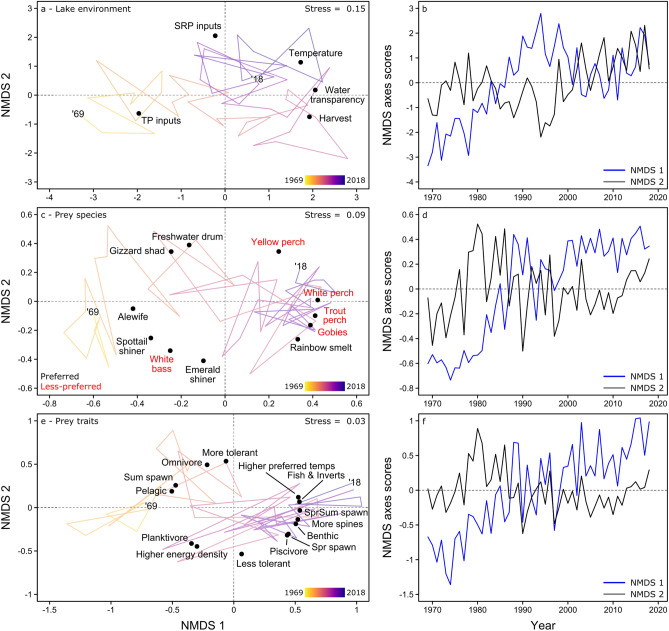
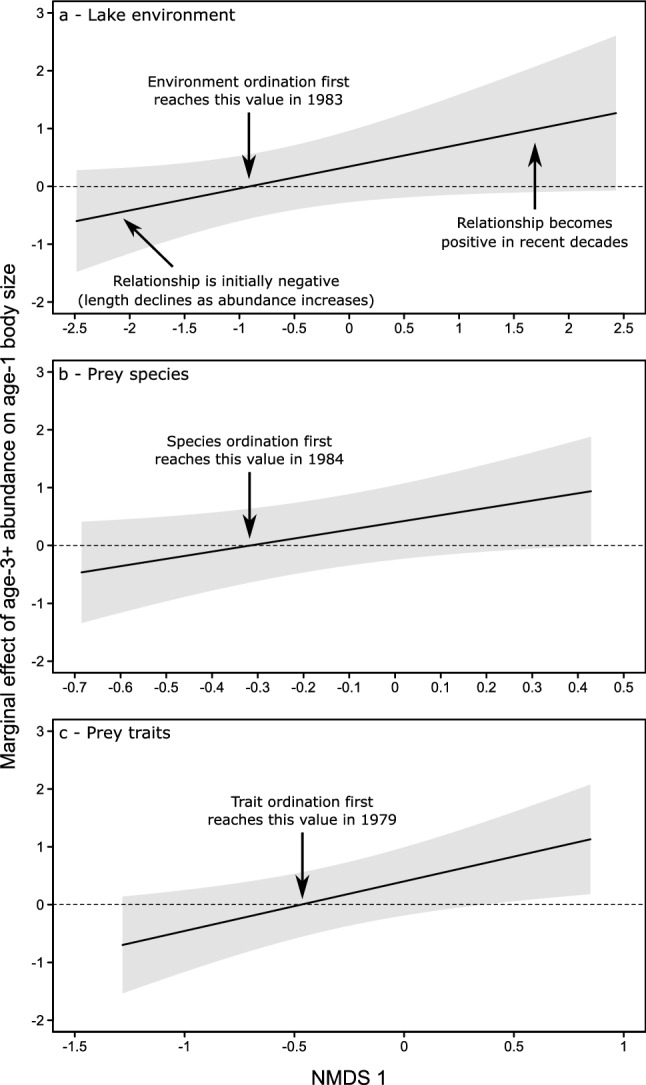
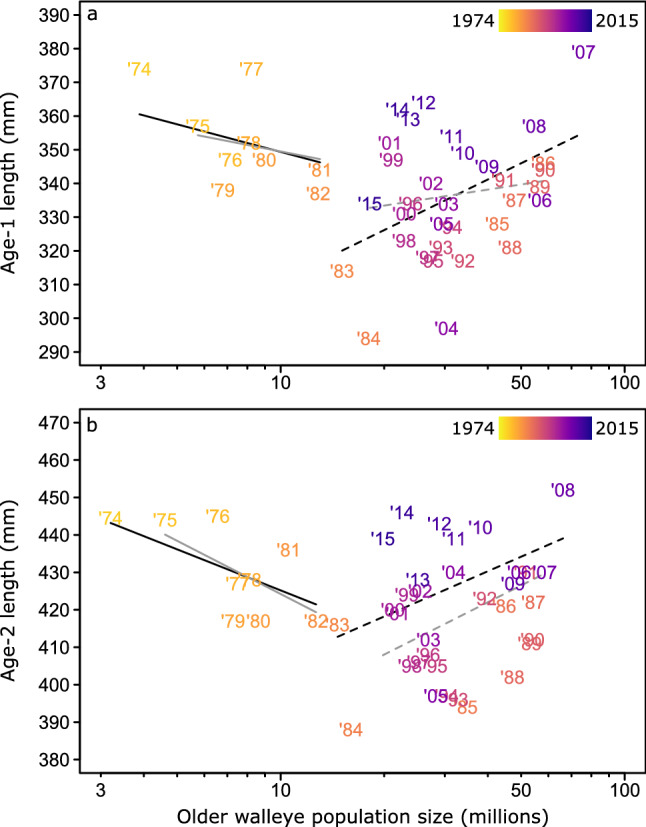
Intraspecific interactions within predator populations can affect predator-prey dynamics and community structure, highlighting the need to better understand how these interactions respond to anthropogenic change. To this end, we used a half-century (1969-2018) of abundance and size-at-age data from Lake Erie's walleye (Sander vitreus) population to determine how anthropogenic alterations have influenced intraspecific interactions. Before the 1980s, the length-at-age of younger walleye (ages 1 and 2) negatively correlated with older (age 3 +) walleye abundance, signaling a 'density feedback' in which intraspecific competition limited growth. However, after the early 1980s this signal of intraspecific competition disappeared. This decoupling of the density feedback was related to multiple anthropogenic changes, including a larger walleye population resulting from better fisheries management, planned nutrient reductions to improve water quality and transparency, warmer water temperatures, and the proliferation of a non-native fish with novel traits (white perch, Morone americana). We argue that these changes may have reduced competitive interactions by reducing the spatial overlap between older and younger walleye and by introducing novel prey. Our findings illustrate the potential for anthropogenic change to diminish density dependent intraspecific interactions within top predator populations, which has important ramifications for predicting predator dynamics and managing natural resources.


Conflict of interest statement

The authors declare no competing interests.

Figures

Figure 1
Figure 1
Predictions of how changes in the strength of intraspecific interactions could affect the relationship between predator growth (represented as body size) and population size. In (a), predator length declines as its population size increases owing to increased intraspecific interactions, such as competition or aggression, thus reducing the energy available for surplus growth. Environmental changes that (b) increase the frequency or intensity of intraspecific interactions would be expected to increase the slope of the relationship between body size and population size, with the opposite occurring if (c) the frequency or intensity of intraspecific interactions are reduced.
Figure 2
Figure 2
Anthropogenic changes in Lake Erie during 1969–2018. Changes include: (a) total lakewide commercial walleye harvest (solid line); (b) annual lakewide total phosphorus (TP) inputs; (c) mean annual water transparency in the western basin (gray shading indicates the standard deviation); (d) total annual soluble reactive phosphorus (SRP) inputs from the Maumee River; (e) climate variability, represented using an ordination axis of seasonal air and water temperatures (Supplementary Information – Sect. 2); and (f) total prey abundance (CPUE; individuals·trawl min−1). We also plotted (a) the estimated size of the older (age 3 +) walleye population (dashed line) to illustrate its relationship to commercial harvest.
Figure 3
Figure 3
Ordinations portraying temporal shifts in Lake Erie’s (a, b) environment, (c, d) prey- species composition, and (e, f) prey-trait composition during 1969–2018 (‘69–‘18). Years in (a, c, e) progress temporally across a color gradient from yellow to blue, with orange and purple representing intermediate decades. In (c), text color indicates which prey are preferred (black text) versus less-preferred (red text) by Lake Erie walleye. Relationships between time and NMDS axis 1 (blue lines) and axis 2 (black lines) are illustrated in (b, d, f) to show which years are associated with large directional shifts in the ordinations.
Figure 4
Figure 4
The marginal effects of older walleye (age 3 +) abundance on younger (age-1) walleye body size conditioned on changes in (a) the lake environment, (b) prey-species composition, and (c) prey-trait composition. Negative marginal effects indicate that the slope of the body size ~ abundance relationship is negative, specifically that younger walleye lengths tend to decline as older walleye abundance increases. A shift to a neutral then positive marginal effect indicates an inflection point where the slope changes and lengths no longer decline as abundance increases. Black lines are the estimated slope values extracted from the Generalized Least Squares models across the full range of NMDS axis values. Gray shaded areas indicate the confidence intervals of these estimates. Arrows are included in each panel at the inflection points along with which year the slopes first switched from negative to positive based on the corresponding years from the NMDS axes in Fig. 3b,d,f.
Figure 5
Figure 5
Relationships between the mean total length of (a) age-1 and (b) age-2 walleye and the estimated total number of older (age 3 +) walleye in Lake Erie during 1974–2015. Years progress across a color gradient from yellow to blue, with orange and purple representing intermediate decades. Solid lines indicate the best pre-breakpoint relationships, whereas dashed lines represent post-breakpoint relationships (modeled using piecewise linear regression). Gray lines show relationships with a downweighted influence of potentially high leverage points (age-1: 1974, 1983, 1984, and 2007; age-2: 1974, 1983, 1984, and 2008). Relationships were initially negative (age-1: slope =  − 51.2, R2lik = 0.37, P = 0.041; age-2: slope =  − 42.0, R2lik = 0.36, P = 0.046), but switched to positive after the breakpoint (age-1: slope = 52.2, R2lik = 0.13, P = 0.028; age-2: slope = 46.4, R2lik = 0.12, P = 0.042). Note the log-scale on the x-axis.

References

    1. Estes JA, et al. Trophic downgrading of planet Earth. Science. 2011;333:301–306. doi: 10.1126/science.1205106. - DOI - PubMed
    1. Wilson MW, et al. Ecological impacts of human-induced animal behaviour change. Ecol. Lett. 2020;23:1522–1536. doi: 10.1111/ele.13571. - DOI - PubMed
    1. Guiden PW, Bartel SL, Byer NW, Shipley AA, Orrock JL. Predator–prey interactions in the Anthropocene: reconciling multiple aspects of novelty. Trends Ecol. Evol. 2019;34:616–627. doi: 10.1016/j.tree.2019.02.017. - DOI - PubMed
    1. Herrando-Pérez S, Delean S, Brook BW, Bradshaw CJA. Density dependence: an ecological Tower of Babel. Oecologia. 2012;170:585–603. doi: 10.1007/s00442-012-2347-3. - DOI - PubMed
    1. Byström P, García-Berthou E. Density dependent growth and size specific competitive interactions in young fish. Oikos. 1999;86:217–232. doi: 10.2307/3546440. - DOI

Publication types