. 2023 May 10;13(1):7589.
doi: 10.1038/s41598-023-34805-5.

Identification of a genomic DNA sequence that quantitatively modulates KLF1 transcription factor expression in differentiating human hematopoietic cells

Affiliations

Identification of a genomic DNA sequence that quantitatively modulates KLF1 transcription factor expression in differentiating human hematopoietic cells

M N Gnanapragasam et al. Sci Rep. .

Abstract

The onset of erythropoiesis is under strict developmental control, with direct and indirect inputs influencing its derivation from the hematopoietic stem cell. A major regulator of this transition is KLF1/EKLF, a zinc finger transcription factor that plays a global role in all aspects of erythropoiesis. Here, we have identified a short, conserved enhancer element in KLF1 intron 1 that is important for establishing optimal levels of KLF1 in mouse and human cells. Chromatin accessibility of this site exhibits cell-type specificity and is under developmental control during the differentiation of human CD34+ cells towards the erythroid lineage. This site binds GATA1, SMAD1, TAL1, and ETV6. In vivo editing of this region in cell lines and primary cells reduces KLF1 expression quantitatively. However, we find that, similar to observations seen in pedigrees of families with KLF1 mutations, downstream effects are variable, suggesting that the global architecture of the site is buffered towards keeping the KLF1 genetic region in an active state. We propose that modification of intron 1 in both alleles is not equivalent to complete loss of function of one allele.


Conflict of interest statement

The authors declare no competing interests.

Figures

Figure 1
Figure 1
Analysis of the KLF1 intronic enhancer. (a) Reanalysis of data from a study on the mouse KLF1 promoter. Constructs containing the KLF1 promoter or one that additionally includes intron 1 were stably integrated into mouse ES cells adjacent to a GFP reporter, yielding two stable ES lines (“P-Klf1-GFP” and “P-Klf1-intron-GFP”). Top: Locations of the mapped upstream enhancer, proximal promoter, and intronic enhancer are as indicated. Bottom: ES cells from each line were differentiated to EBs for the indicated number of days, and samples were quantitatively analyzed for expression of exogenous reporter (green) to monitor the effect of intron 1 inclusion. Data is from analysis of biological triplicates. Endogenous KLF1 expression was also monitored in the same samples to show that its onset/expression is similar in both sets (Fig. S5). (b) Genome browser data aligned at the human KLF1 genomic region (https://main.genome-browser.bx.psu.edu/index.html). Shaded bars show the locations of the enhancer upstream of the gene and of the intron 1 site within the gene (also marked with an asterisk). In vivo GATA1, SMAD1, TAL1, and P300 binding identified from ChIP-seq analyses of erythroid cells are shown. (c) Genome browser data showing onset of chromatin accessibility as monitored by ATAC-seq analyses of primary human cells: top, during erythroid differentiation from sorted adult human CD34+ cells; middle, from erythroid, megakaryocyte, and hepatic fetal liver cells; bottom, from adult human hematopoietic subpopulations. Shaded bars are aligned with and are as in (b). (d) Reporter assay of various renilla reporter constructs after transfection into human JK1 cells. Top: Schematic of constructs containing the KLF1 promoter (as in (a)) are shown. The location of the intron 1 point mutant introduced into P-Klf1-intron-Ren is shown (“M”). Bottom: Results of the assay, showing high renilla levels from the promoter alone that are further stimulated by inclusion of the intron (data from two separate DNA preparations, each performed in triplicate); however, these levels are decreased when the point mutant variant is used (data from three separate DNA preparations, each performed in triplicate). Normalization is to a co-transfected luciferase plasmid, and data is an average of triplicate samples from each DNA preparation.
Figure 2
Figure 2
TALEN-mediated indel generation and analysis of KU812 cells. (a) Top, schematic of the location of the two TALEN arms (blue) in the context of the KLF1 gene and the intron 1 mutation site (red). Exact sequence is shown. Bottom, schematic of parental and modified constructs containing RFP (in frame) and GFP (out of frame) reporters separated by a target site into which the intron 1 sequence (with the left and right TALEN sites) is incorporated. Successful transfection and activity of the dual TALENs is predicted to yield an indel leading to a frameshift and resultant in-frame expression of GFP (1 out of 3 chance). (b) Data is shown from the transfection of KU812 cells. Selection of RFP+/GFP+ positive cells after cotransfection with left and right TALEN arms greatly increases the chance of finding a clone with the desired indel, even at low frequency. Clones are generated by single-cell sorting and expansion. (c) Genomic sequence analysis of parental and two KU812 subclones (“clone 1” and “clone 2”) containing directed indels at KLF1 intron 1; blue are the TALEN sequences, red is the target JMML site as a reference point. Homo- or heterozygous deletions are as indicated. Analyses of the two indel KU812 cell clones compared to parental cells are shown after a check of KLF1 RNA expression and western blot assessment (uncropped blot is in Fig. S3) of KLF1 and HSP90 protein (insert). (d) ChIP analysis of specific TEL/ETV6 binding in WT or mutant (clone 2, “Mut”) KU812 cells. ETV6 occupancy at the KLF1 intron 1 site, monitored by two different primer pairs, show a positive signal only in WT cells. (e) Positive control targets known to bind ETV6 show signals in all cases (HHEX, GATA2, LMO2 based on) in WT or mutant cells. For (d) and (e), multiple samples were analyzed, each in triplicate.
Figure 3
Figure 3
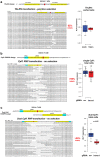
Gene editing and analysis of primary human cells. Human CD34+ cells were transfected, differentiated towards the erythroid lineage with a three-phase protocol, and analyzed by deep sequencing of the KLF1 intron 1 region. Indels were identified, and the top 30 are shown in each case along with the total indel percentage in the population (one representative example from each test is shown). The location of the JMML point mutation (marked in red at the top) serves as a reference point for each design. KLF1 mRNA expression was monitored by RT-qPCR and shown on the right. (a) Cells were transfected with the left and right TALEN arms (indicated at the top in yellow) along with the co-transfected reporter. The RFP+/GFP+ pool was sorted, expanded, and differentiated prior to NGS genomic DNA analysis. KLF1 expression levels are not significantly different (n = 4–6 each). (b) Cells were transfected with an RNP consisting of Cpf1 protein and gRNA (indicated at the top in yellow, with the PAM sequence in blue). The negative control was cells transfected with an RNP containing scrambled gRNA. The cells were expanded and differentiated prior to NGS genomic DNA analysis. NGS of the scrambled control cells showed no changes (not shown). Although there is a range of KLF1 expression after editing, levels are not significantly different from the scrambled control (n = 18 each). (c) Cells were transfected with a 50/50 mix of RNPs consisting of Cpf1 protein and two gRNAs (indicated at the top in yellow, with their PAM sequences in blue). The negative control was cells transfected with an RNP containing scrambled gRNA. The cells were expanded and differentiated prior to NGS genomic DNA analysis. NGS of the scrambled control cells showed no changes (not shown). KLF1 expression is down twofold in the samples dual-edited samples (n = 9 each).
Figure 4
Figure 4
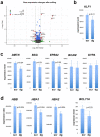
RNA seq analysis of edited CD34+ cell-derived erythroid cells. (a) Volcano plot of RNA expression data from control compared to intron 1-edited CD34+ cells is shown based on analysis of biological triplicate samples harvested at d18 of the three-phase differentiation protocol. Black dots represent genes not changed in expression, green are changed but not significantly, blue are significantly changed but less than |log2| = 1.0, and red are significantly changed and |log2| ≥ 1.0. Some genes in this last category have been identified in the figure. These genes are listed in Tables S5 and S6. (bd) RNA seq expression data from control (transfected with Cpf1 RNP containing scrambled gRNA; ‘scr’) compared to that from intron 1-edited (transfected with a Cpf1 RNP containing a dual guide mix of intron 1-directed gRNA as in Fig. 3c; ‘dg’). Statistical analysis is from the DESeq2 files (as in (a)). The source file for these genes is Table S7. (b) Expression of KLF1. (c) Expression of genes anticipated to be affected by drop in KLF1 levels. (d) Expression of genes related to β- and α-globin gene regulation, including the BCL11A repressor.

Similar articles

Cited by

References

    1. Laurenti E, Gottgens B. From haematopoietic stem cells to complex differentiation landscapes. Nature (London) 2018;553:418–426. doi: 10.1038/nature25022. - DOI - PMC - PubMed
    1. Miller IJ, Bieker JJ. A novel, erythroid cell-specific murine transcription factor that binds to the CACCC element and is related to the Krüppel family of nuclear proteins. Mol. Cell. Biol. 1993;13:2776–2786. - PMC - PubMed
    1. Perkins A, et al. Kruppeling erythropoiesis: An unexpected broad spectrum of human red blood cell disorders due to KLF1 variants. Blood. 2016;127:1856–1862. doi: 10.1182/blood-2016-01-694331. - DOI - PMC - PubMed
    1. Waye JS, Eng B. Kruppel-like factor 1: Hematologic phenotypes associated with KLF1 gene mutations. Int. J. Lab. Hematol. 2015;37(Suppl 1):78–84. doi: 10.1111/ijlh.12356. - DOI - PubMed
    1. Gnanapragasam MN, Bieker JJ. Orchestration of late events in erythropoiesis by KLF1/EKLF. Curr. Opin. Hematol. 2017;24:183–190. doi: 10.1097/MOH.0000000000000327. - DOI - PMC - PubMed

Publication types