. 2024 Apr;42(4):663-673.
doi: 10.1038/s41587-023-01793-w. Epub 2023 May 10.

Pangenome graph construction from genome alignments with Minigraph-Cactus

Collaborators, Affiliations

Pangenome graph construction from genome alignments with Minigraph-Cactus

Glenn Hickey et al. Nat Biotechnol. 2024 Apr.

Abstract

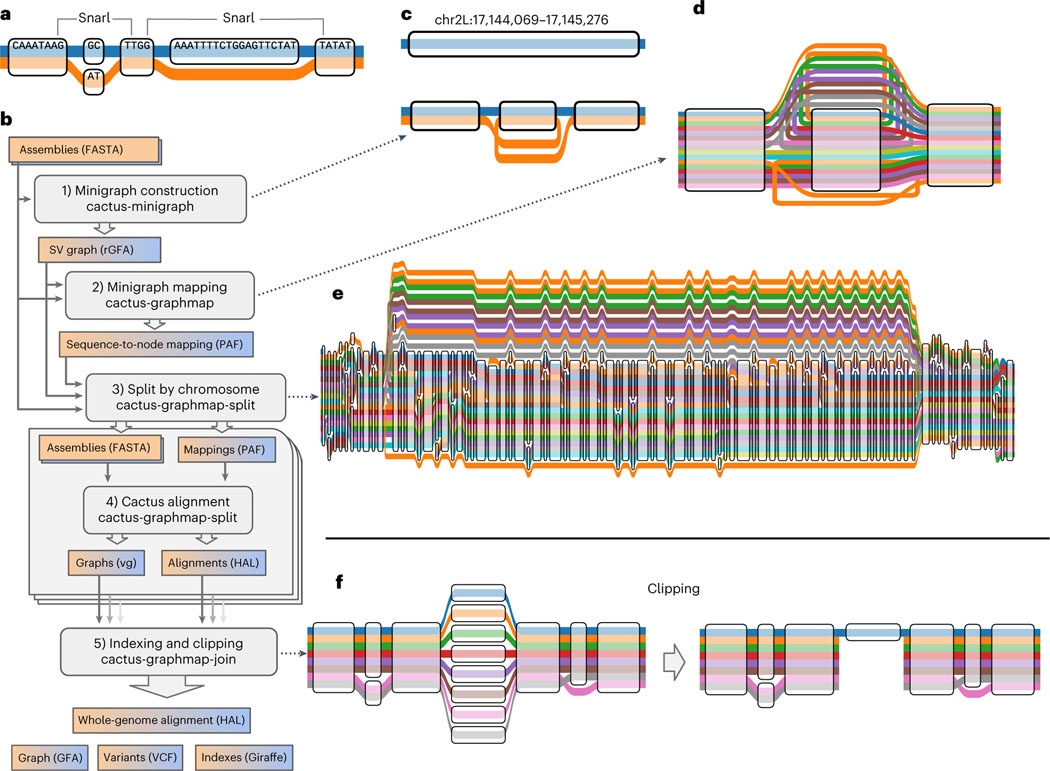
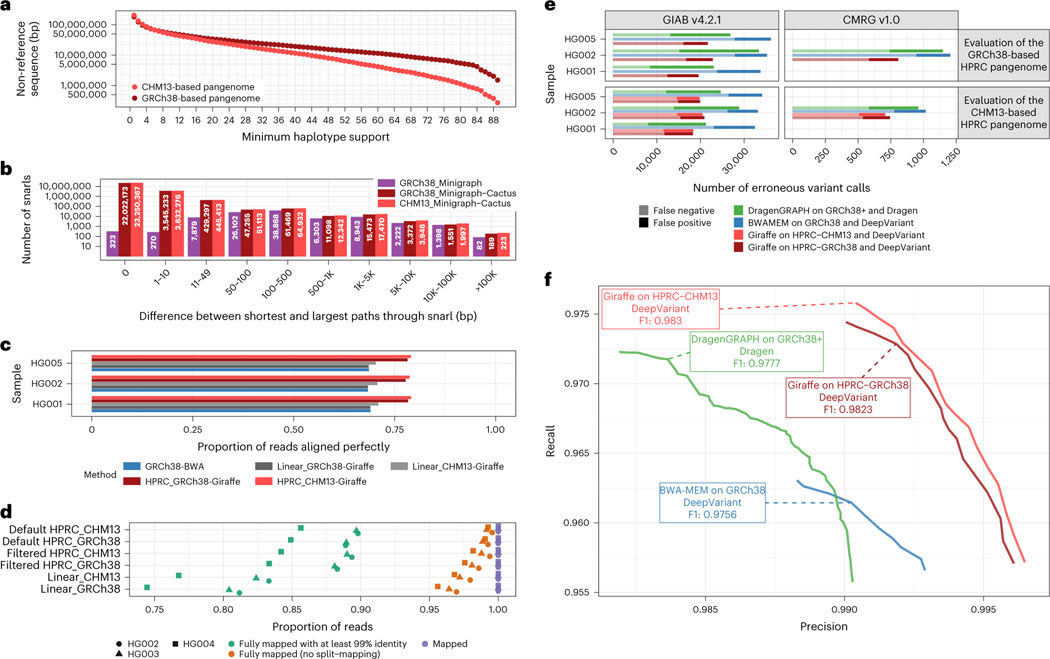
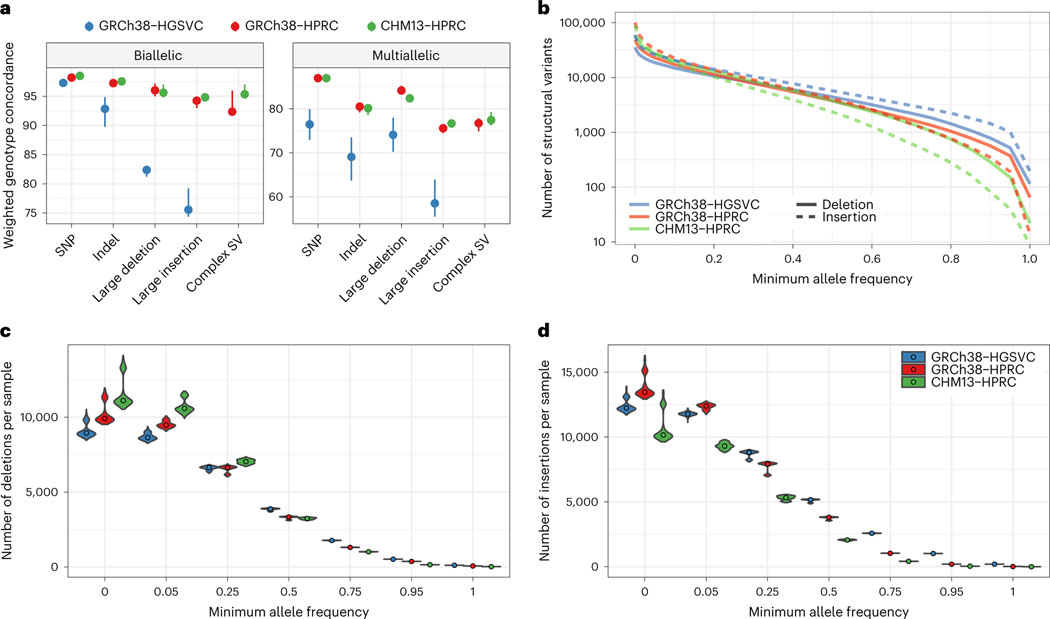
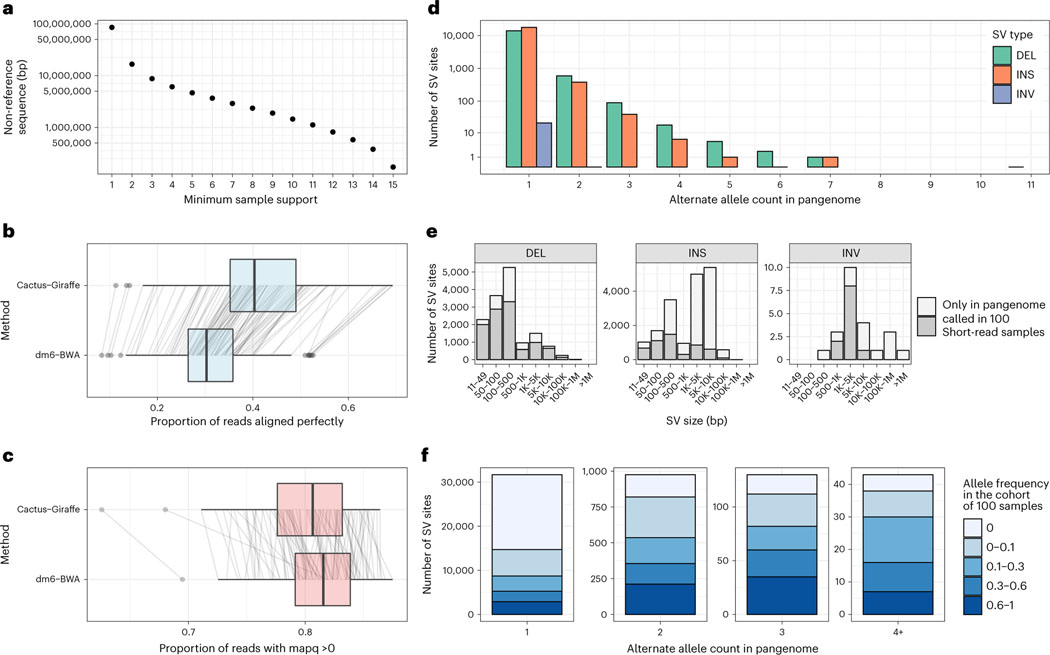
Pangenome references address biases of reference genomes by storing a representative set of diverse haplotypes and their alignment, usually as a graph. Alternate alleles determined by variant callers can be used to construct pangenome graphs, but advances in long-read sequencing are leading to widely available, high-quality phased assemblies. Constructing a pangenome graph directly from assemblies, as opposed to variant calls, leverages the graph's ability to represent variation at different scales. Here we present the Minigraph-Cactus pangenome pipeline, which creates pangenomes directly from whole-genome alignments, and demonstrate its ability to scale to 90 human haplotypes from the Human Pangenome Reference Consortium. The method builds graphs containing all forms of genetic variation while allowing use of current mapping and genotyping tools. We measure the effect of the quality and completeness of reference genomes used for analysis within the pangenomes and show that using the CHM13 reference from the Telomere-to-Telomere Consortium improves the accuracy of our methods. We also demonstrate construction of a Drosophila melanogaster pangenome.


Figures

Fig. 1 |
Fig. 1 |. Minigraph-Cactus pangenome construction.
a, ‘Tube Map’ view of a sequence graph shows two haplotypes as paths through the graph. The two snarls (variation sites defined by graph topology, also known as bubbles) are highlighted. b, The five steps and associated tools of the Minigraph-Cactus pipeline, which takes as input genome assemblies in FASTA format and outputs a pangenome graph, genome alignment, VCF and indexes required for mapping with vg Giraffe, illustrating the steps in the pipeline by example. c, SV graph construction using minigraph (as wrapped by Minigraph-Cactus) begins with a linear reference and adds SVs, in this case a single 1,204-bp inversion (at ch2L:17,144,069 in the D. melanogaster pangenome). d, The input haplotypes are mapped back to the graph with minigraph, in this example six of which contain the inversion allele from c. e, The minigraph mappings are combined into a base resolution graph using Cactus, augmenting the larger SVs with smaller variants—in this case, adding smaller variants within the inversion. f, An unaligned centromere is clipped out of a graph, leaving only the reference (blue) allele in that region. The other alleles are each broken into two separate subpaths but are otherwise unaffected outside the clipped region.
Fig. 2 |
Fig. 2 |. Evaluating GRCh38-based and T2T-CHM13-based human pangenomes.
a, The amount of non-reference sequence in the HPRC graphs by the minimum number of haplotypes it is contained in. b, Distribution of the size of the snarls (variation sites, also known as bubbles) for the GRCh38-based minigraph and GRCh38-based and CHM13-based Minigraph-Cactus pangenomes. Note that, in the case of overlapping variants, snarls can be much larger than any single event that they contain. c,e,f, ~30× Illumina short reads for three GIAB samples were mapped using three approaches: BWA-MEM on GRCh38 (blue), vg Giraffe on the linear pangenomes with GRCh 38 or CHM13 (gray) and vg Giraffe on the GRCh38-referenced or CHM13-referenced HPRC pangenome (red). c, Proportion of the reads aligning perfectly to the (pan-)genome for each sample (y axis). d, Number of Hi-Fi reads mapped to the linear, filtered and default (unfiltered by allele frequency) pangenomes. For each sample and pangenome, three points show the number of mapped reads (purple square), reads mapped without being split (orange triangle) and reads fully mapped with at least 99% identity. e,f, Short variants were called with DeepVariant after projecting the reads to GCRh38 from the GRCh38-based pangenome (dark red) or the CHM13-based pangenome (light red). The results when aligning reads with BWA-MEM (blue) or using the Dragen pipeline (green) are also shown. e, The number of erroneous calls (false positive in dark, false negative in pale) is shown on the x axis across samples from GIAB (y axis). Left: GIAB version 4.2.2 high-confidence calls. Right: CMRG version 1.0. When evaluating the CHM13-based pangenome (bottom panels), regions with false duplications or collapsed in GRCh38 were excluded. f, The graph shows the precision (x axis) and recall (y axis) for different approaches using the CMRG version 1.0 truth set for the HG002 sample (bottom-right panel in e). The curves are traced by increasing the minimum quality of the calls.
Fig. 3 |
Fig. 3 |. Comparing pangenome SV genotyping.
a, Leave-one-out PanGenie validation measures the concordance of haplotypes as genotyped by short reads with the haplotypes created using genome assembly. The dots show the medians of five samples independently validated in this way. The error bars extend to the minimum and maxiumum values. Note that different samples were used for the HGSVC graph than for the HPRC graphs. b, log-scaled number of SVs given a minimum allele frequency in the PanGenie genotypes. c, The number of SV deletions genotyped per sample, stratified across six minimum allele frequency thresholds. The violin plots show the distribution across 368 samples, whereas the dots represent the median. d, The number of SV insertions genotyped per sample, stratified across six minimum allele frequency thresholds.
Fig. 4 |
Fig. 4 |. A D. melanogaster pangenome.
a, Amount of non-reference sequence by minimum number of haplotypes it occurs in for the D. melanogaster pangenome. b,c, Reads mapped by two approaches (y axis): ‘Cactus-Giraffe’, where short reads are aligned to the pangenome using vg Giraffe, and ‘dm6-BWA’, where reads were mapped to dm6 using BWA-MEM. The box plots show the median (center line), upper and lower quartiles (box limits) up to 1.5× interquartile range (whiskers) and outliers (points). The lines connect the same sample between the two approaches. The x axis shows the proportion of reads that align perfectly (b) or the proportion of reads with a mapping quality (mapq) above 0 (c). d, Distribution of the alternate allele count across each SV site. The x axis represents the number of assemblies in the pangenome that support an SV. The y axis is log-scaled. e, The size distribution (x axis) of different SV types (panels). The SV sites are separated in two groups: SV sites that were called in at least one sample from the cohort of 100 samples with short reads (dark gray) and SV sites present only in the pangenome (light gray). f, Fraction of SVs of different frequency in the cohort of 100 samples (color) compared to their frequency in the pangenome (x axis). DEL, deletions; INS, insertions; INV, inversions.

Similar articles

Cited by

References

    1. Eizenga JM et al. Pangenome graphs. Annu. Rev. Genomics Hum. Genet. 21, 139–162 (2020). - PMC - PubMed
    1. Miga KH & Wang T. The need for a human pangenome reference sequence. Annu. Rev. Genomics Hum. Genet. 22, 81–102 (2021). - PMC - PubMed
    1. Garrison E. et al. Variation graph toolkit improves read mapping by representing genetic variation in the reference. Nat. Biotechnol. 36, 875–879 (2018). - PMC - PubMed
    1. Abel HJ et al. Mapping and characterization of structural variation in 17,795 human genomes. Nature 583, 83–89 (2020). - PMC - PubMed
    1. Hickey G. et al. Genotyping structural variants in pangenome graphs using the vg toolkit. Genome Biol. 21, 35 (2020). - PMC - PubMed