. 2023 May;617(7961):608-615.
doi: 10.1038/s41586-023-06044-1. Epub 2023 May 10.

Peroxisome biogenesis initiated by protein phase separation

Affiliations

Peroxisome biogenesis initiated by protein phase separation

Rini Ravindran et al. Nature. 2023 May.

Abstract

Peroxisomes are organelles that carry out β-oxidation of fatty acids and amino acids. Both rare and prevalent diseases are caused by their dysfunction1. Among disease-causing variant genes are those required for protein transport into peroxisomes. The peroxisomal protein import machinery, which also shares similarities with chloroplasts2, is unique in transporting folded and large, up to 10 nm in diameter, protein complexes into peroxisomes3. Current models postulate a large pore formed by transmembrane proteins4; however, so far, no pore structure has been observed. In the budding yeast Saccharomyces cerevisiae, the minimum transport machinery includes the membrane proteins Pex13 and Pex14 and the cargo-protein-binding transport receptor, Pex5. Here we show that Pex13 undergoes liquid-liquid phase separation (LLPS) with Pex5-cargo. Intrinsically disordered regions in Pex13 and Pex5 resemble those found in nuclear pore complex proteins. Peroxisomal protein import depends on both the number and pattern of aromatic residues in these intrinsically disordered regions, consistent with their roles as 'stickers' in associative polymer models of LLPS5,6. Finally, imaging fluorescence cross-correlation spectroscopy shows that cargo import correlates with transient focusing of GFP-Pex13 and GFP-Pex14 on the peroxisome membrane. Pex13 and Pex14 form foci in distinct time frames, suggesting that they may form channels at different saturating concentrations of Pex5-cargo. Our findings lead us to suggest a model in which LLPS of Pex5-cargo with Pex13 and Pex14 results in transient protein transport channels7.


Conflict of interest statement

Competing interests The authors declare no competing interests.

Figures

Extended Data Fig. 1 |
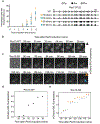
Extended Data Fig. 1 |. Predicted PLD in Pex13 and Pex5.
PLD Analysis of a, Pex13 b, Pex5 and c, Pex14 using PLAAC. Predicted PLD sequence is marked in red for Pex13 and Pex5 on the left, corresponding to the outputs on the right. d, Multiple sequence alignment of the Pex13 sequence from the indicated five species, showing conserved Y residues within the predicted yeast PLD sequence.
Extended Data Fig. 2 |
Extended Data Fig. 2 |. PTS1 transport defective in Pex13-PLD variants.
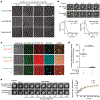
a, Distribution of Y (white) to F (orange) or S (purple) substitutions introduced in the Pex13 PLD using CRISPR-Cas9. Point mutation heat map shown in shades of gray denotes the number of mCherry foci observed in the indicated cells. n = 100 cells from 3 independent experiments. Confocal images of b, GFP-Pex13-S8 (interspersed) and c, GFP-Pex13-S9 (blocky) cells taken at the indicated time points after induction of Pex5. Scale bar 5 μm. Percentage cells displaying mCherry-SKL foci are indicated below each panel. n = 100 cells per sample.
Extended Data Fig. 3 |
Extended Data Fig. 3 |. Import kinetics in Pex13-WT and Y→S or F substitutions.
a, Percentage of cells displaying mCherry-SKL foci in the indicated strains following Pex5 induction. Error bars are mean ± s.e.m. for 3 independent experiments, n = 100 cells. The schematic on the right shows the Y→S or F substitutions made. b, Timelapse following mCherry-SKL foci formation in Pex13 WT cells (black arrow) and c, Pex13 S8 cells (orange and blue arrows). Scale bar 5 μm. d,e, mCherry-SKL foci fluorescence intensity of the cells imaged in panels b and c, respectively, plotted as a function of time after induction of Pex5 expression.
Extended Data Fig. 4 |
Extended Data Fig. 4 |. Representative images of cargo import defects.
Spinning disc confocal images of a, GFP-Pex13-S7 and b, GFP-Pex13-S15 cells taken at the indicated time points after induction of Pex5. Scale bar 5 μm. Percentage cells displaying mCherry-SKL foci are indicated below the panels. n = 100 cells.
Extended Data Fig. 5 |
Extended Data Fig. 5 |. LLPS of purified PTS1 peroxins.
a, Coomassie stained SDS-PAGE gels of 1 μg of the indicated purified proteins. Images of condensates formed by b,c, Pex13-IDR WT labeled with AZdye 488 maleimide d,e, Pex5 labeled with AZdye 647 maleimide and f,g, Pex14 IDR labeled with AZdye 488 maleimide. Scale bar 5 μm.
Extended Data Fig. 6 |
Extended Data Fig. 6 |. Pex5-cargo partitions into Pex13-IDR condensates.
Titration of a, Pex5 and b, mCherry-SKL to determine the concentration at which they do not form condensates. 1 μM of both Pex5 and mCherry-SKL were used for in vitro reconstitution assays with Pex13-IDR. c, Reconstitution experiments to measure partitioning of Pex5 labelled with AZ 647 dye and mCherry-SKL into Pex13-IDR WT condensates immediately after mixing at room temperature. d, Cas9-AZdye 488 maleimide does not actively partition into Pex13 droplets (top) while mCherry-SKL partitions with Pex5 and Pex13 (bottom). e, Pex5 and mCherry-SKL partition into Pex13-IDR WT (10 μM) and Pex13-IDR S8 (30 μM) condensates. f, Pex13-IDR S15 does not form spherical condensates. mCherry-SKL remains diffuse in most images of Pex13-S15 aggregates (top). In some images, however, Pex5-mCherry-SKL appears to partition with Pex13-S15 (bottom). This is likely due to experimental variation, perhaps a somewhat lower concentration of Pex5-mCherry-SKL, co-aggregating with Pex13-IDR-S15. Scale bar 5 μm.
Extended Data Fig. 7 |
Extended Data Fig. 7 |. iFCCS) workflow and controls.
a, Fiducial markers used to align the GFP-Pex13 and mCherry-SKL channels using MATLAB. b, The centroid position of fiducial markers are selected and the coordinates are exported using a normalized cross correlation between the red and green channels. c, The centroid locations of peroxisomes of interest are localized using a particle localization analysis (dashed circle provided as guide for the eye). d, The GFP and mCherry intensities of each of the surrounding 17×17 pixels of the peroxisome centroid location are extracted. The intensities of centroid pixel boxed in c are shown in d. Using the equation in e, the intensity fluctuations, δF(t), relative to the mean intensity are calculated and used to calculate G(τ). Resulting data f, Spatial and g, Temporal, as explained in the methods section. h, Controls for laser power effect on photo bleaching. i, Averaged standard deviation of the cross correlation curves with the maximum G_XC(0) value in each peroxisome at each laser power.
Extended Data Fig. 8 |
Extended Data Fig. 8 |. iFCCS spatial and temporal data shows transient clusters of correlated signal of mCherry-SKL and GFP-Pex13.
a, Percentage of peroxisomes with GXC(0 ms) > 0.5 for GFP-Pex13 and soluble mCherry (no SKL) (gray). The-data of GFP-Pex13 with mCherry-SKL import from Fig. 4j is shown for comparison (red). b, Spatial iFCCS data from six different peroxisomes in WT 50 min after Pex5 induction where distinct transient clusters of correlated signals are observed. Images measure 1.19 μm × 1.19 μm in size. c, Transient nature of individual clusters are observed in the decay and fluctuations of the cross-correlation over time between clusters in different peroxisomes (n = 27 peroxisomes). d, Gaussian distribution of NGFP-Pex13/NmCherry-SKL obtained by autocorrelating signal from the Pex13-GFP and SKL-mCherry channels, extracting a value from the pixel exhibiting the highest GXC(0) > 0.5 in each peroxisome from the Pex13 WT strain, 50 min after Pex5 induction. e, Bimodal Gaussian fit of GFP-Pex14 same as in panel d, for data obtained 90 min after Pex5 induction. f, Distribution of NPex13–488/NPex5–647 showing the ratio of Pex13 to Pex5 in Pex13-IDR and Pex13-S8 condensates. All pixels within a single condensate of Pex13-IDR-WT or Pex13-IDR-S8 with Pex5 partitioned within the condensate were analyzed. Gaussian fit parameters μ and σ listed with 95% confidence intervals in panels d,e and f. g, An alternative transmembrane intercalation model for peroxisomal cargo import.
Fig. 1 |
Fig. 1 |. Pex13 Y-to-S substitutions disrupt peroxisomal PTS1-cargo import.
a,b, Domain structures of Pex5 (a) and Pex13 (b), highlighting IDRs, tetratricopeptide repeat (TPR), transmembrane domains (TMs) and SRC homology 3 domain (SH3). YG repeats within the PLD (teal) are highlighted in yellow. Percentage amino acid composition of the PLD is presented below the PLD sequence. c, YG- and FG-rich PLD regions within Pex13 and the nucleoporin proteins that line the central channel of the NPC. d, Schematic diagram of the assay to measure PTS1 import. VPS1Δ deletion strain expressing GFP–Pex13 with or without Y-to-S or F substitutions in the Pex13 PLD was transformed with mCherry–SKL plasmid. Cells with active PTS1 import show red mCherry–SKL puncta that overlap with GFP–Pex13, whereas mCherry–SKL remains cytoplasmic in cells with inactive PTS1 import. e, Confocal microscopy images of the indicated strains expressing mCherry–SKL. Scale bar, 5 μm. Schematic of the Y-to-S substitutions in Pex13 PLD is given below. f, Percentage cells exhibiting mCherry–SKL foci imaged in e. Data are mean ± s.e.m. of n = 100 cells for 3 biologically independent experiments. NS (not significant), P > 0.05; one-way analysis of variance with Tukey’s multiple comparison test. g, GFP–Pex13 fluorescence intensity in the indicated strains. n = 50 cells for 3 biologically independent experiments. NS, P > 0.05; Kruskal–Wallis one-way analysis of variance test with Dunn’s multiple comparison. The box limits represent the range between the first and third quartiles for each condition, the centre lines show the median, and the ends of the whiskers extend to 1.5× the interquartile range.
Fig. 2 |
Fig. 2 |. Pex13-PLD Y-to-S substitutions decrease rates of PTS1-cargo import.
a, Left: mCherry–SKL remains cytoplasmic in cells grown in raffinose. Right: mCherry–SKL puncta overlap with GFP–Pex13 following galactose induction of Pex5 expression. b, Immunoblot analysis showing levels of Pex5 at the indicated time points following Pex5 induction. Negative control, PEX5Δ strain; loading control, tubulin. Uncropped immunoblots are provided in Supplementary Fig. 1. c, Spinning-disc confocal images of GFP–WT-Pex13 cells (n = 100) after induction of Pex5. Scale bar, 5 μm. d, Percentage of cells exhibiting mCherry–SKL foci imaged in c. e, Cargo import measured as the ratio of pixel sum intensity of mCherry–SKL foci superimposed on GFP–Pex13 to the cytoplasmic mCherry–SKL fluorescence measured in GFP–WT-Pex13 cells (n = 50) following induction of Pex5 expression. The inset shows all-or-none appearance of mCherry–SKL puncta at 2-min resolution. f, Ratio of mCherry–SKL foci to cytoplasm fluorescence intensities as a function of time after Pex5 induction in the indicated strains; n = 50 cells. g,h, Percentage of Pex13(S8) and Pex13(S9) cells (n = 100) with blocky or interspersed Y-to-S substitutions (g) and WT-Pex13 and variant cells (n = 100) with blocky Y-to-S substitutions (h) exhibiting mCherry–SKL foci following Pex5 induction. Error bars are mean ± s.e.m. for three biologically independent experiments for dh. i, Schematic representation of the sequence distributions of Y-to-S substitutions in the Pex13 PLD variants indicated in fh. j, Schematic representation of hypothetical effects of Y-to-S substitutions on Pex5–Pex13 phase separation. Phase separation of WT Pex13 occurs when Pex5 expression reaches a saturating concentration at which it is above the phase boundary for phase separation (blue U-shaped boundary). Increasing numbers of Y-to-S substitutions in Pex13 result in right and upward shifts in the phase boundary with corresponding increases in the saturating concentration of Pex5. Distributions to the left or under the y and x axes, respectively, represent Pex13 and Pex5 abundances across a population of cells.
Fig. 3 |
Fig. 3 |. mCherry–SKL requires binding to Pex5 to partition into Pex13-IDR condensates in vitro.
a, Bright-field confocal images of condensates formed by purified WT-Pex13, Pex13(S8) and Pex13(S15) IDR proteins at the indicated concentrations at room temperature. Scale bar, 50 μm. b, Top: fusion of WT-Pex13 and Pex13(S8) IDR purified proteins at the indicated time points. Scale bar, 5 μm. Bottom: fusion events are fitted by an exponential decay to determine fusion time constant τ. The τavg was calculated with data for n = 18 condensates. c, Reconstitution experiments to measure partitioning of AZdye 647 maleimide-tagged Pex5 and mCherry–SKL into AZdye 488 maleimide-tagged WT-Pex13 IDR condensates immediately after mixing at room temperature. Scale bar, 5 μm. d, Fluorescence intensity of mCherry–SKL partitioned into Pex13-IDR condensates. n = 30 condensates from 3 independent experiments; P value was determined using two-tailed Student’s t-test. The box limits represent the range between the first and third quartiles for each condition, the centre lines show the median, and the ends of the whiskers extend to 1.5× the interquartile range. e, Left: representative images of mCherry–SKL partitioned into WT-Pex13 IDR or Pex13(S8) IDR in the presence of Pex5 before and after photobleaching. Bleached region of interest is outlined in yellow. Scale bar, 2 μm. Right: fluorescence recovery after photobleaching quantification; error bars are mean ± s.e.m. for n = 5 condensates from 3 independent experiments. One-phase exponential equations were fitted to the curves.
Fig. 4 |
Fig. 4 |. Clusters of transiently correlated mCherry–SKL and GFP–Pex13 or GFP–Pex14 on peroxisomes.
a, The intensities of GFP–Pex13 (left) and mCherry–SKL (right) are cross-correlated over time to produce an image at a given lag time, τ, where clusters of high cross-correlation (GXC(0) > 0.5) indicate transient clusters of pixels where GFP–Pex13 and mCherry–SKL are spatiotemporally cross-correlated. Scale bar, 500 nm. b,c, Spatial cross-correlation images at GXC(0 ms) for positive control dual-labelled GFP–Pex13–mCherry (b) and negative control mCherry–SKL and GFP–Ant1 (c). d, iFCCS curves taken from individual pixels demonstrate expected observations for the positive control (GXC(0) > 0.5) and negative control (GXC(0 ms) ≅ 0). e,f, WT-Pex13 strain spatially distributed (left) and temporal (right) cross-correlation 10 min (e) and 50 min (f) after Pex5 induction. g, Cross-section GXC(τ) intensity (from f, left, dotted line) fitted to a two-component Gaussian (blue, red), to extract the full width at half maximum (FWHM) size and resolving separated high-GXC(0 ms) clusters within a peroxisome. h, Cumulative distribution plotting the probability of the size of a high-GXC(0 ms) cluster extracted from Gaussian fits (n = 48) with a FWHM′ at a size smaller than the FWHM indicated on the x axis shows that 58% of pores fall within a diffraction-limited normal population whereas 42% are >313 nm in diameter. i, Image (left) showing at least three distinct high-GXC(0 ms) clusters and iFCCS temporal decays (right) for GFP–Pex14 and mCherry–SKL. j, Percentage of peroxisome with high-GXC(0 ms) GFP–Pex13 or GFP–Pex14 and mCherry–SKL clusters versus time following Pex5 induction in the indicated strains. k, A model for peroxisome cargo transport in which Pex5–cargo protein complexes phase separate with Pex13 or Pex14 through protein–protein interactions between their IDRs to form condensates that create conduits for cargo release into the peroxisome lumen.

References

    1. Zalckvar E & Schuldiner M Beyond rare disorders: a new era for peroxisomal pathophysiology. Mol. Cell 82, 2228–2235 (2022). - PubMed
    1. Ganesan I, Shi LX, Labs M & Theg SM Evaluating the functional pore size of chloroplast TOC and TIC protein translocons: import of folded proteins. Plant Cell 30, 2161–2173 (2018). - PMC - PubMed
    1. Walton PA, Hill PE & Subramani S Import of stably folded proteins into peroxisomes. Mol. Biol. Cell 6, 675–683 (1995). - PMC - PubMed
    1. Meinecke M et al. The peroxisomal importomer constitutes a large and highly dynamic pore. Nat. Cell Biol 12, 273–277 (2010). - PubMed
    1. Martin EW et al. Valence and patterning of aromatic residues determine the phase behavior of prion-like domains. Science 367, 694–699 (2020). - PMC - PubMed

Publication types

MeSH terms

Substances

LinkOut - more resources