. 2023 Jun;618(7963):188-192.
doi: 10.1038/s41586-023-06050-3. Epub 2023 May 10.

In situ architecture of the ER-mitochondria encounter structure

Affiliations

In situ architecture of the ER-mitochondria encounter structure

Michael R Wozny et al. Nature. 2023 Jun.

Abstract

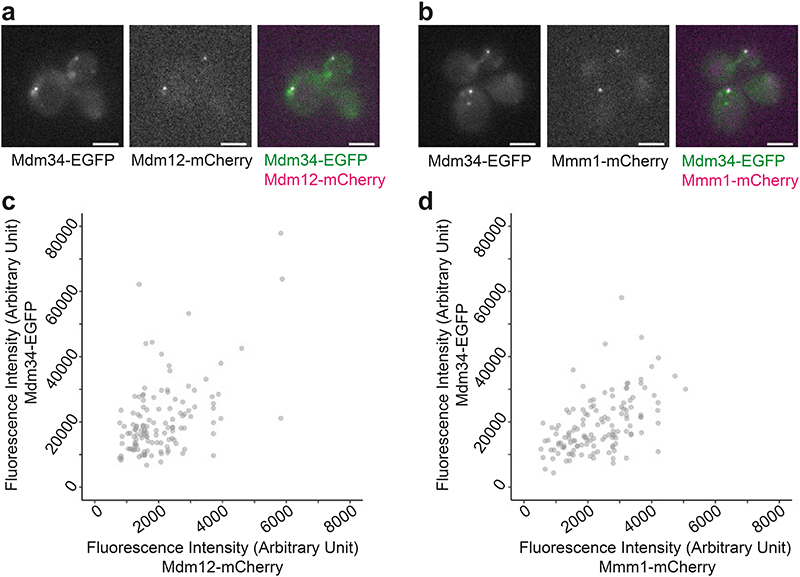
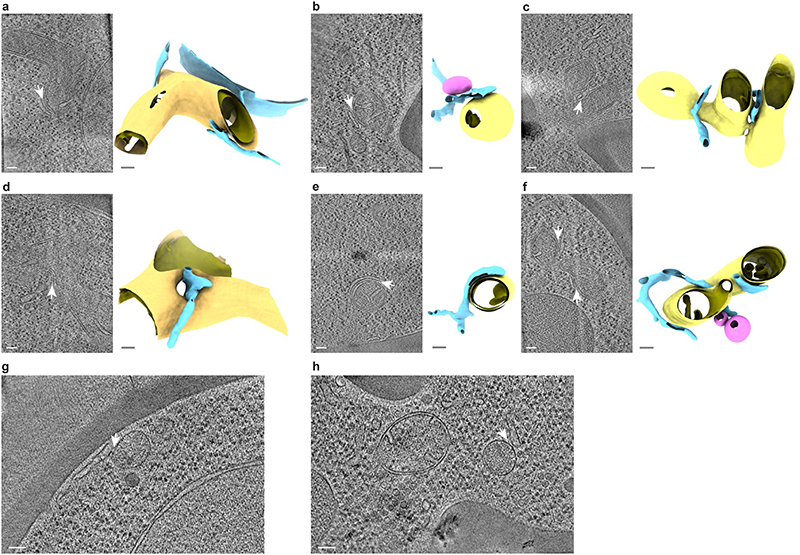
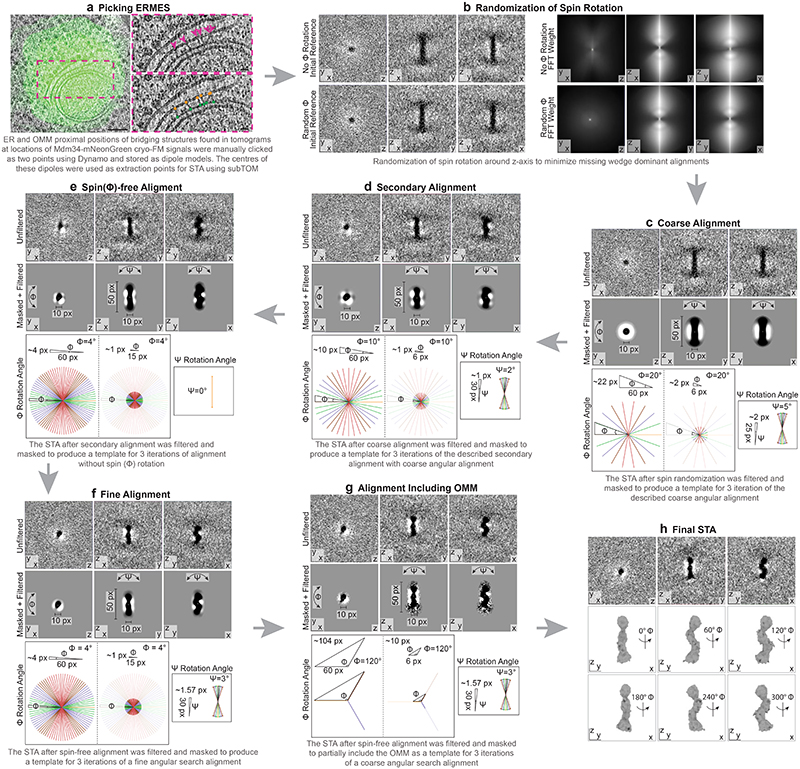
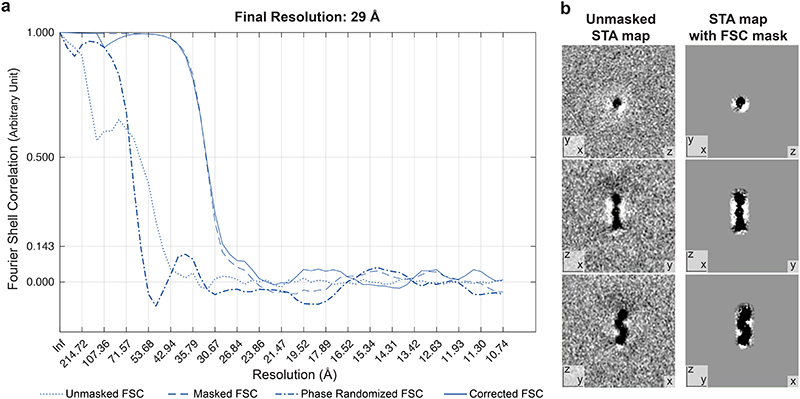
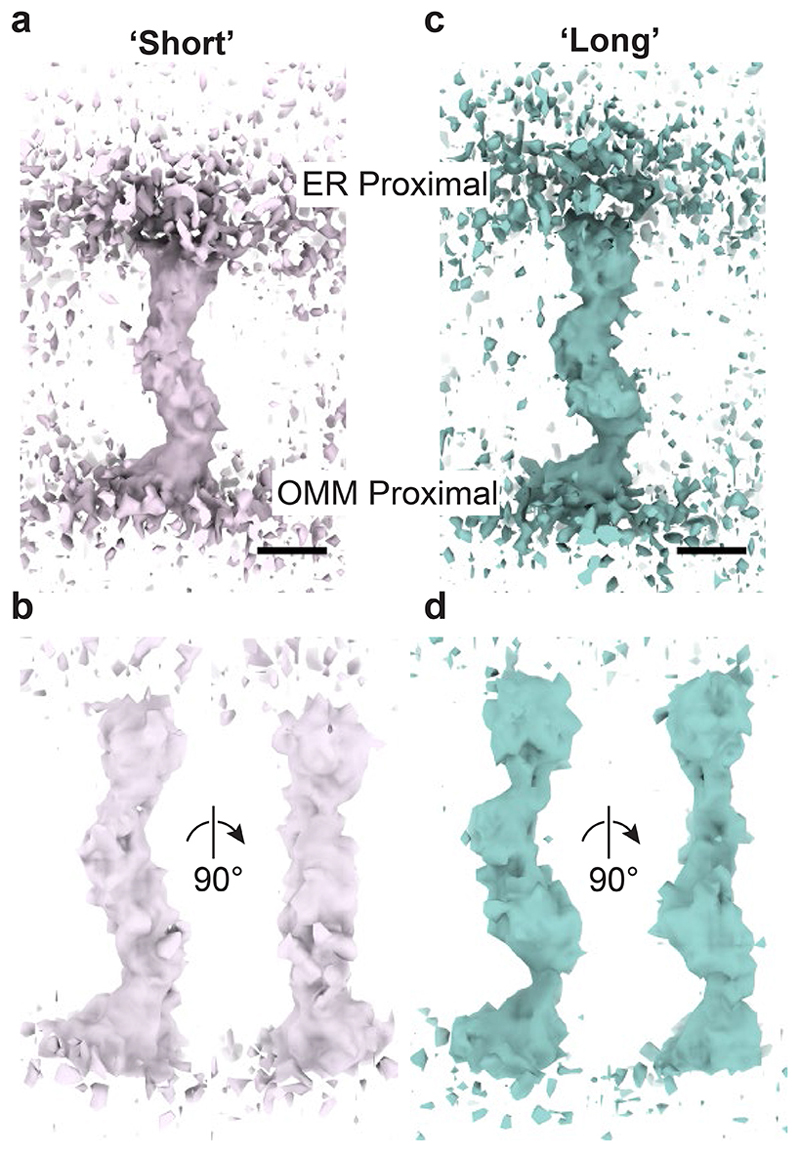
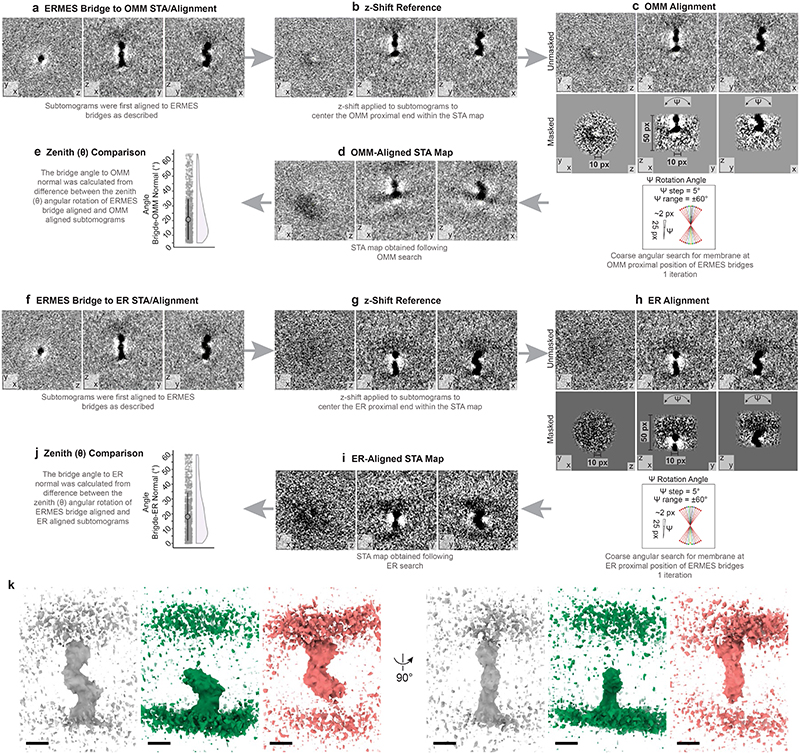
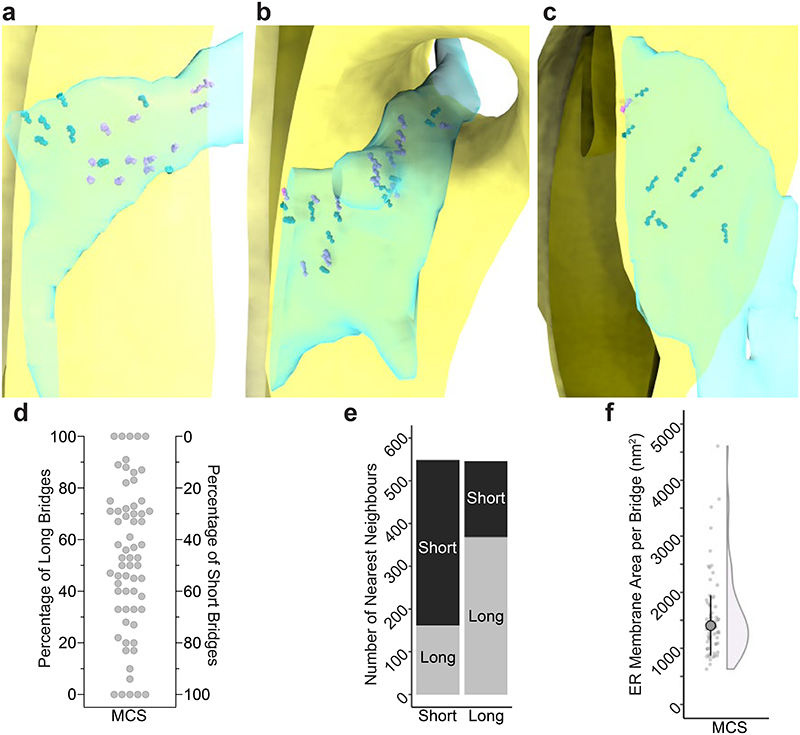
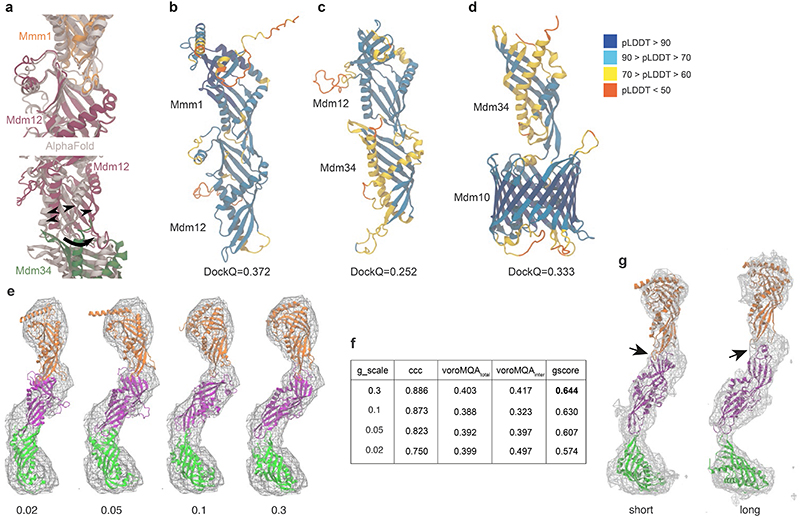
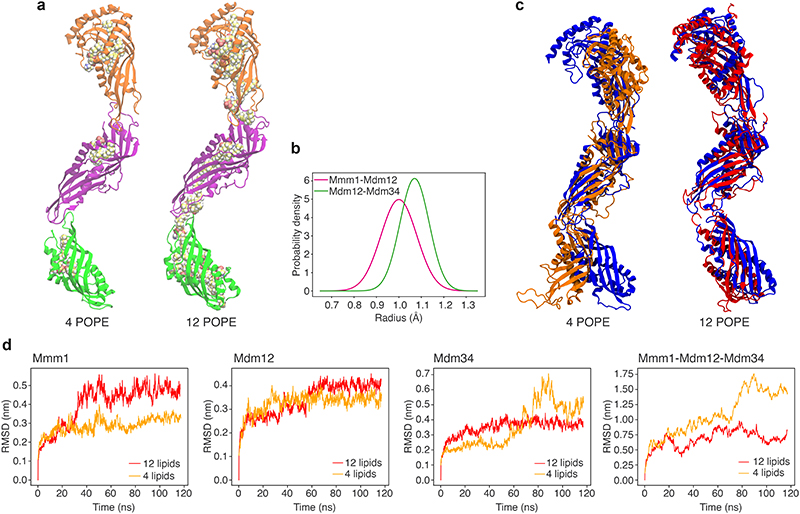
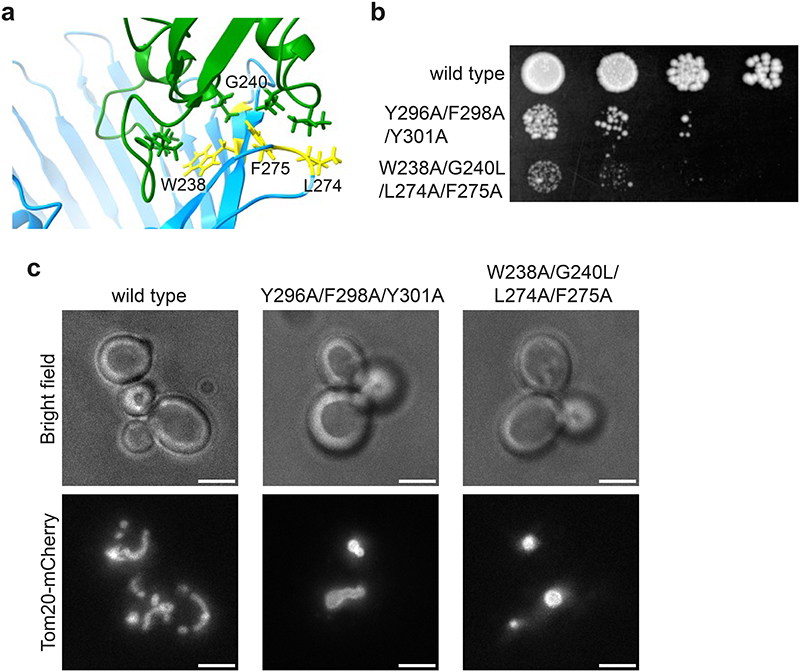
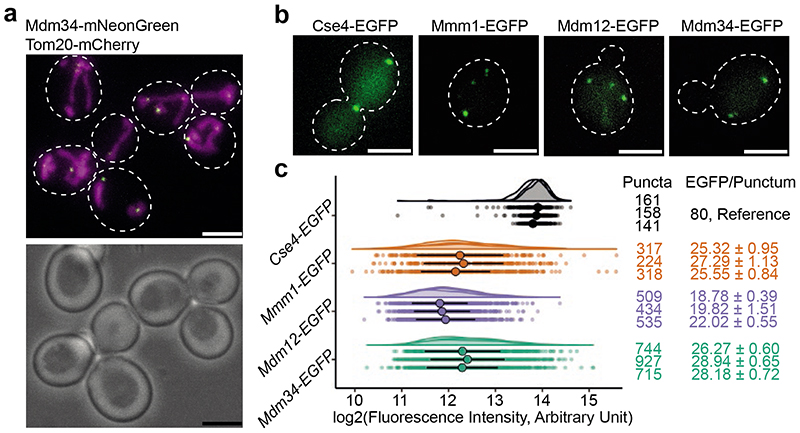
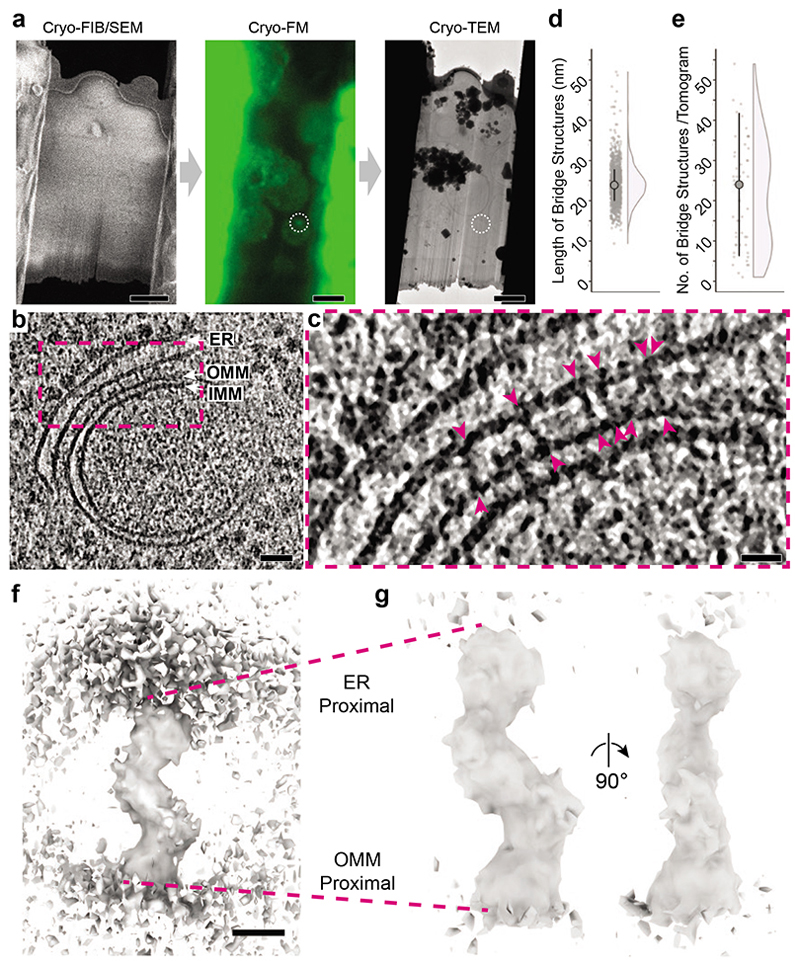
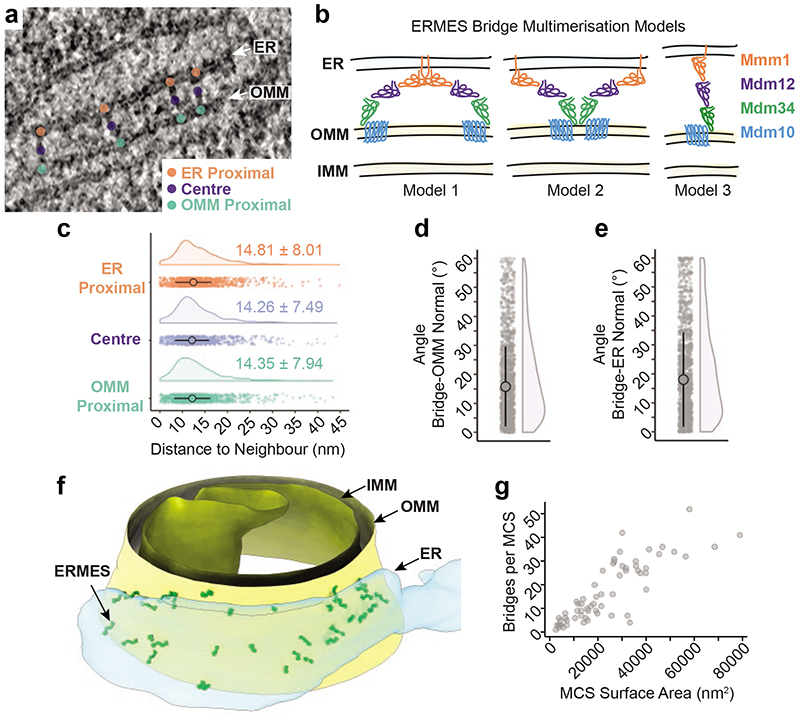
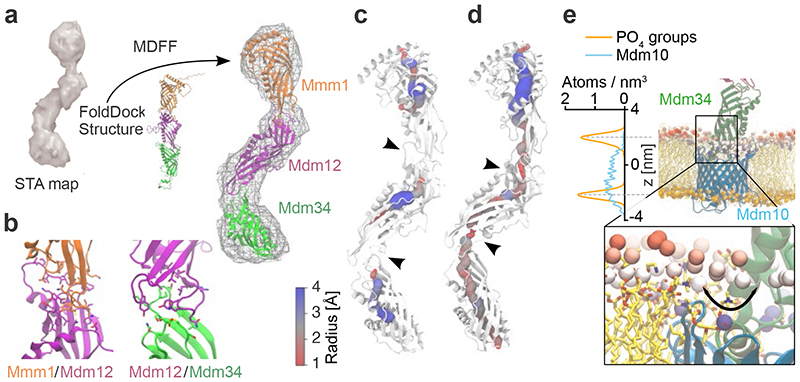
The endoplasmic reticulum and mitochondria are main hubs of eukaryotic membrane biogenesis that rely on lipid exchange via membrane contact sites1-3, but the underpinning mechanisms remain poorly understood. In yeast, tethering and lipid transfer between the two organelles is mediated by the endoplasmic reticulum-mitochondria encounter structure (ERMES), a four-subunit complex of unresolved stoichiometry and architecture4-6. Here we determined the molecular organization of ERMES within Saccharomyces cerevisiae cells using integrative structural biology by combining quantitative live imaging, cryo-correlative microscopy, subtomogram averaging and molecular modelling. We found that ERMES assembles into approximately 25 discrete bridge-like complexes distributed irregularly across a contact site. Each bridge consists of three synaptotagmin-like mitochondrial lipid binding protein domains oriented in a zig-zag arrangement. Our molecular model of ERMES reveals a pathway for lipids. These findings resolve the in situ supramolecular architecture of a major inter-organelle lipid transfer machinery and provide a basis for the mechanistic understanding of lipid fluxes in eukaryotic cells.


Conflict of interest statement

Competing interests

The authors declare no competing interests.

Figures

Extended Data Figure 1
Extended Data Figure 1. Correlation between simultaneously labelled ERMES components.
a: Fluorescence live cell microscopy of cells expressing Mdm34-EGFP and Mdm12-mCherry. Individual channels and merge are shown. b: Fluorescence live cell microscopy of cells expressing Mdm34-EGFP and Mmm1-mCherry. Individual channels and merge are shown. c: The fluorescence intensity of Mdm34-EGFP and Mdm12-mCherry, labelled in the same cells, correlates in puncta. N=128 puncta, Pearson’s correlation R=0.566, p=3.38*10-12 (two-sided). d: The fluorescence intensity in a.u. of Mdm34-EGFP and Mmm1-mCherry, labelled in the same cells, correlates in puncta. N=134 puncta, Pearson’s correlation R=0.529, p=5.18*10-11 (two-sided). Scale bars are 3 μm.
Extended Data Figure 2
Extended Data Figure 2. MCS imaged by cryo-ET at Mdm34-mNeonGreen signals.
a-f: Diversity of membrane morphologies of ER-mitochondria MCS imaged by cryo-ET at locations of Mdm34-mNeonGreen. Six representative examples from a data set of 51 tomograms are shown. Left panels are virtual slices through electron cryo-tomograms. ER-mitochondria MCS are indicated by white arrows. Right panels are segmentation models of the ER (blue), the OMM (yellow), the IMM (mustard) and peroxisomes (pink). The segmentation models are rotated relative to the virtual slices to better visualize the MCS. The example in e is the same as shown in Fig. 3e. g, h: ER-peroxisome contacts imaged by cryo-ET at locations of Mdm34-mNeonGreen. Approximately 15% of Mdm34-mNeonGreen puncta contained ER-peroxisome MCS (indicated by white arrows) rather than ER-mitochondria MCS. Peroxisomes are identified as spheroid single-membrane vesicles more than 100 nm in diameter with dense interior,. Scale bars are 100 nm. Note that due to the perspective view, scale bars in the panels showing segmentation models apply only to the front plane of the scenes.
Extended Data Figure 3
Extended Data Figure 3. Subtomogram averaging pipeline.
The strategy using sequential alignment steps is outlined in steps a - h. The data set consisted of manually picked coordinates of the ER and OMM anchor points of 1098 bridge structures from 51 electron cryo-tomograms at positions of Mdm34-mNeonGreen signals. The resolution of the final STA map is potentially affected by a minor fraction of bridge-like particles of different identity, which could contribute noise. Images in a are the same as shown in Fig. 2b and c, with modifications to the overlay. Scale bars in a are 100 nm (left image) and 20 nm (images in pink dashed boxes).
Extended Data Figure 4
Extended Data Figure 4. Resolution estimate of STA map.
a: Fourier shell correlation, calculated according to. The final resolution corresponds to FSC=0.143. b: Left panel: Three virtual slices through the unmasked STA map. Right panel: Three virtual slices through the STA map masked for FCS calculation.
Extended Data Figure 5
Extended Data Figure 5. STA maps of short and long bridges.
a, b: STA map of short class (pink). c, d: STA map of long class (teal). The two classes were obtained by halving the data set of 1098 bridge structures according to bridge length and subjecting both classes separately to the procedure shown in Extended Data Fig. 3. In a and c the maps are shown at lower contour levels than in b and d. Scale bars are 5 nm. Note that due to the perspective view, scale bars apply only to the front plane of the scenes.
Extended Data Figure 6
Extended Data Figure 6. Orientation of the bridges relative to the membranes.
a-d: STA alignment strategy to determine the angle between the bridges and the OMM. e: This graph is the same as shown in Figure 3d. Large point indicates median, vertical lines MAD. N=1098 bridges from 51 tomograms. f-i: STA alignment strategy to determine the angle between the bridges and the ER. j: This graph is the same as shown in Figure 3e. Large point indicates median, vertical lines MAD. N=1098 bridges from 51 tomograms. k: Comparison of the STA maps obtained from different alignments. Grey: Full STA map obtained from the alignment strategy depicted in Extended Data Fig. 4. The STA map is the same as shown in Fig 2f and g, displayed at different contour level. Green: STA map obtained from the alignment strategy used to determine the angle between bridges and OMM, as depicted in panels a-d. Red: STA map obtained from the alignment strategy used to determine the angle between bridges and ER, as depicted in panels f-i. Scale bars are 5 nm. Note that due to the perspective view, scale bars apply only to the front plane of the scenes.
Extended Data Figure 7
Extended Data Figure 7. The distribution of bridges within the MCS ultrastructure.
a-c: Segmentation models of MCS in three different tomograms, with STA maps of short (pink) and long (teal) classes placed back to the tomographic positions of individual bridges. OMM is in yellow, IMM in mustard, and ER in transparent light blue. d: Distribution of bridges of the long and short classes, across MCS. Each dot represents one MCS (N=64), plotted according to the percentage of long (left y-axis) and short bridges (right y-axis) it contains. e: Distribution of bridges of the long and short classes, within MCS. The number of short (left bar) and long (right bar) bridges that have a nearest neighbour belonging to the long (light grey bar fraction) and short (dark grey bar fraction) class. f: Dot plot and half-violin plot of the surface area of the ER membrane serviced by one ERMES bridge, determined per MCS. Large point indicates median, vertical lines indicate MAD. One outlier is not shown but included in median and MAD determination. N=63 MCS from 49 tomograms.
Extended Data Figure 8
Extended Data Figure 8. Integrative modelling of the ERMES complex.
a: Differences between FD (in colour) and AF multimer (grey) predicted structures. While initial predictions of the complex structure using AF multimer, and FD yield a nearly identical Mmm1-Mdm12 interface, the Mdm12-Mdm34 FD-interface shows a larger aperture (black arrowheads) which tends to close upon fitting to the cryo-ET STA map (black arrow). This difference between AF and FD highlights a lack of dynamic information as a current limitation of structural prediction. b-d: Quality estimation of the dimer predictions (Mmm1/Mdm12, Mdm12/Mdm34, Mdm34/Mdm10) using the FoldDock (FD) protocol. For each protein, the local pLDDT score is shown, together with the overall DockQ score of the dimer. For all protein-protein interfaces, the DockQ score is above the value generally considered to successfully predict heteromeric interfaces (DockQ>0.23),. e: Final conformations of the trimeric Mmm1-Mdm12-Mdm34 complex, obtained from the MDFF simulations including 4 POPE lipids after fitting with different scaling factors (g_scale, numerical values given below models). The scaling factor determines the weight of the experimental STA map on the total molecular potential. f: Assessment of MDFF-derived models obtained using different scaling factors, shown in panel e. ccc refers to the cross-correlation coefficient between map and model, voroMQAtotal and voroMQAinter refer to the global voroMQA score and the component including only inter-subunit contacts, respectively. Based on the gscore which combines the assessment parameters (see Methods), g_scale=0.3 was considered best and is thus shown in other figures. g: Models obtained when the conformation of the Mmm1-Mdm12-Mdm34 complex was biased by MDFF into the short (left) and long (right) STA maps. The interaction between Mmm1 and Mdm12 (indicated by black arrows) appears to be diminished in the long conformation. In both cases, the model contained 4 lipids and the scaling factor was g_scale=0.1 See also Supplementary Table 1.
Extended Data Figure 9
Extended Data Figure 9. Effect of bound lipids on the ERMES complex model.
a: Model of the Mmm1-Mdm12-Mdm34 complex obtained by MDFF when the starting complex contained 4 POPE lipid molecules (left) as compared to 12 POPE molecules (right). Note that the MDFF-derived model with 4 POPE molecules is also shown in Fig. 4a, b and d as well as in Extended Data Fig. 8e (g_scale=0.3), without visualisation of the lipids. b: Distributions of detected cavity radii at the interfaces between subunits Mmm1-Mdm12 (magenta) and Mdm12-Mdm34 (green). The radii were computed from frames taken over the last 100 ns of the MDFF simulation and are shown as probability density distributions. c: Structural comparison between the heterotrimeric complex obtained by MDFF with the STA map (blue), and the same complex after an additional unbiased MD simulation of 120 ns. The left model is with 4 lipids bound, the right model with 12 lipids bound. d: Root mean square deviations (RMSD) of individual subunits and of the heterotrimeric complex, measured over the additional 120 ns unbiased MD simulations of the MDFF-obtained heterotrimeric complex with either 12 or 4 lipids bound (red and orange, respectively). The end points (120 ns) of the red and orange plots correspond to red and orange conformations of the complex shown in d, respectively. The differences in the RMSD of Mmm1 with 12 vs. 4 lipids can be attributed to its N-terminal region, see also Supplementary Fig. 2.
Extended Data Figure 10
Extended Data Figure 10. Mdm10 mutation in the predicted Mdm10-Mdm34 interface.
a: MDFF-derived predicted interface between Mdm10 (blue) and Mdm34 (green). Residues in wild type Mdm10 that were mutated to Mdm10W238A/G240L/L274A/F275A to disrupt the interface are indicated in yellow. The mutated residues are not involved in known interactions within the SAM complex,. b: Spot growth assay on YPD, comparing wild type, Mdm10Y296A/F298A/Y301A (shown before to disrupt the interface between Mdm10 and Mdm34) and Mdm10W238A/G240L/L274A/F275A. All three strains express Tom20-Cherry. c: Light microscopy of strains expressing wild type and mutant Mdm10. Tom20-mCherry is used as an indicator of mitochondrial morphology. Mdm10Y296A/F298A/Y301A and Mdm10W238A/G240L/L274A/F275A display a similar mitochondrial phenotype, indicative of ERMES complex disruption,. Scale bars are 3 μm. See also Supplementary Fig. 3.
Figure 1
Figure 1. The number of molecules of ERMES components per MCS.
a: Live cell imaging of budding yeast cells expressing Tom20-mCherry (magenta), marking mitochondria, and Mdm34-mNeonGreen (green), marking ERMES-mediated MCS. White dashed outlines mark cell boundaries in the fluorescence image (top) according to bright field image (bottom). b: Live cell FM of yeast cells expressing either Cse4-EGFP, Mmm1-EGFP, Mdm12-EGFP or Mdm34-EGFP, forming diffraction limited puncta. White dashed outlines mark cell boundaries. Cells expressing the kinetochore protein Cse4-EGFP, of which the number of molecules per diffraction limited spot is known were used as a reference to determine the number of molecules of ERMES components. c: Fluorescence intensity quantifications of puncta of EGFP-tagged Cse4 (grey), Mmm1 (orange), Mdm12 (purple) and Mdm34 (green), represented as dot plots as well as half-violin plots. Three experimental repeats are shown. Each data point is one punctum. Large points represent median and vertical lines MAD, for each experimental repeat. Using Cse4-EGFP as reference, median +/-MAD fluorescence intensities were transformed into median +/-MAD numbers of EGFP molecules/punctum (right column). Left column indicates number of analysed puncta (N). Scale bars are 3 μm.
Figure 2
Figure 2. ERMES-mediated MCS consist of bridge structures connecting the two membranes.
a: The cryo-CLEM workflow includes three microscope steps. Thinning of cells into lamellae by cryo-FIB milling visualized by scanning EM (SEM); cryo-FM of lamellae to localize Mdm34-mNeonGreen marked ERMES puncta (white dashed circle); and cryotransmission EM (TEM) for acquisition of electron cryo-tomograms. b: Virtual slice through an electron cryo-tomogram acquired at an Mdm34-mNeonGreen punctum, showing an ER-mitochondrial MCS. The ER, OMM and IMM are indicated. c: Zoom into the region in dashed pink box in b. The arrowheads indicate bridge-like connections between the ER and the OMM. d: The length of the bridge structures in nm. Dot plot and half-violin plot. Large point indicates mean (24.2 nm, N=1098 bridges from 51 tomograms), vertical lines SD. e: The number of bridge structures found per electron cryo-tomogram acquired at Mdm34-mNeonGreen puncta. Dot plot and half-violin plot. Large point indicates median (24, N=51 tomograms), vertical lines MAD. f: 3D map of the bridge structure obtained by STA. The ER (top) and OMM (bottom) membranes are partially visible. g: STA map at higher contour level than in f, therefore membranes are not visible. Two views rotated by 90° along the major axis. The map represents the cytosolic portion of the bridge, with regions proximal to the ER and OMM indicated. Scale bars are 3 pm in a, 50 nm in b, 20 nm in c, and 5 nm in f Note that due to the perspective view, the scale bar in f only applies to the front plane of the scene.
Figure 3
Figure 3. Supramolecular organization of ERMES within MCS.
a Coordinates of ER membrane anchor points (orange), centre points (purple) and OMM anchor points (green) in electron cryo-tomograms. b: Three possible models of how ERMES bridges could be arranged relative to each other, consistent with the STA map. Model 1: ERMES dimerizes via Mmml as observed in vitro,; ER anchor points of neighbouring bridges would be close to each other. Model 2: ERMES dimerizes via Mdm34 or Mdm10; OMM anchor points of neighbouring bridges would be close to each other. Model 3: Neither model 1 nor 2 applies if neighbouring bridges are similarly close at the ER, the bridge centre and the OMM. c: Dot plot and half-violin plot of the distances between nearest neighbouring bridges, measured between the ER anchor points (orange), the bridge centres (purple), and the OMM anchor points (green), respectively. Large point indicate medians, vertical lines MAD, both also given as numerical values (N=1095 bridges from 49 tomograms) d: The angle by which each bridge is tilted relative to the OMM normal. Dot plot and half-violin plot. Large point indicates median, vertical lines MAD (N=1098 bridges from 51 tomograms). e: The angle by which each bridge is tilted relative to the ER membrane normal. Dot plot and half-violin plot. Large point indicates median, vertical lines MAD (N=1098 bridges from 51 tomograms). f: Segmentation model of an electron cryo-tomogram, showing the distribution of ERMES bridge structures within MCS. The STA map was placed at the positions of individual bridge structures, indicated as ERMES. OMM, IMM and ER are also indicated. g: The number of bridges per MCS, plotted as a function of the surface area of the ER membrane in contact with the OMM (N=63 MCS from 49 tomograms).
Figure 4
Figure 4. Integrative modelling of the ERMES complex.
a: FD and MDFF approach,. The STA map was used to bias the conformation of the three SMP domains of ERMES. b: Predicted interfaces between Mmm1-Mdm12 (left), Mdm12-Mdm34 (right) in the model fit to the STA map. Interfacing residues (<3 Å) are shown as sticks. c: Average cavity of the heterotrimeric ERMES model with 4 POPE molecules. The three subunits show three distinct cavities which narrow at the subunit interfaces (black arrowheads). Cavity radii are indicated by sphere size and colour. d: Average cavity of the heterotrimeric ERMES model obtained with 12 POPE molecules. A continuous tunnel across subunit interfaces (black arrowheads) is observed as compared to c. The cavity is shown as an average of trajectory snapshots in which a full tunnel connects the two extremities of the complex (approximately 7% of total trajectory snapshots). Cavity radii are indicated by sphere size and colour. e: Hydrophobic mismatch of Mdm10 (cyan) embedded in an OMM-like bilayer. Phosphate groups of the upper leaflet are coloured according to their position along the z-axis (range: 10-25 Å from the bilayer centre, scale: blue to red). Left: Density profiles of the Mdm10 backbone (cyan) and membrane phosphate groups (orange), averaged over last 100 ns of the MDFF simulation. Inset: Close-up representation of the Mdm34-Mdm10 interface. Phosphate groups are represented as large Van der Waals spheres. Black arrow indicates nearness of Mdm34 cavity to phosphate groups

References

    1. Vance JE. Phospholipid synthesis in a membrane fraction associated with mitochondria. J Biol Chem. 1990;265:7248–7256. - PubMed
    1. Vance JE. Newly made phosphatidylserine and phosphatidylethanolamine are preferentially translocated between rat liver mitochondria and endoplasmic reticulum. J Biol Chem. 1991;266:89–97. - PubMed
    1. Achleitner G, et al. Association between the endoplasmic reticulum and mitochondria of yeast facilitates interorganelle transport of phospholipids through membrane contact. Eur J Biochem. 1999;264:545–553. - PubMed
    1. Kornmann B, et al. An ER-mitochondria tethering complex revealed by a synthetic biology screen. Science. 2009;325:477–481. doi: 10.1126/science.1175088. - DOI - PMC - PubMed
    1. Kawano S, et al. Structure-function insights into direct lipid transfer between membranes by Mmm1-Mdm12 of ERMES. J Cell Biol. 2018;217:959–974. doi: 10.1083/jcb.201704119. - DOI - PMC - PubMed

Publication types

MeSH terms