. 2023 May;617(7962):747-754.
doi: 10.1038/s41586-023-06052-1. Epub 2023 May 10.

De novo evolution of macroscopic multicellularity

Affiliations

De novo evolution of macroscopic multicellularity

G Ozan Bozdag et al. Nature. 2023 May.

Abstract

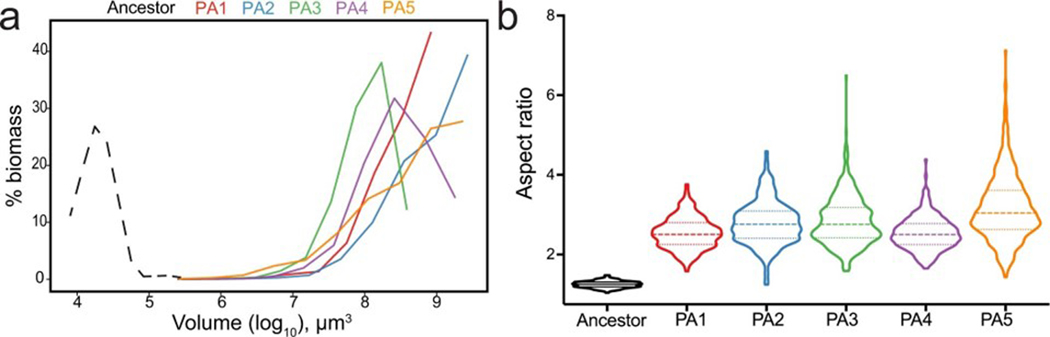
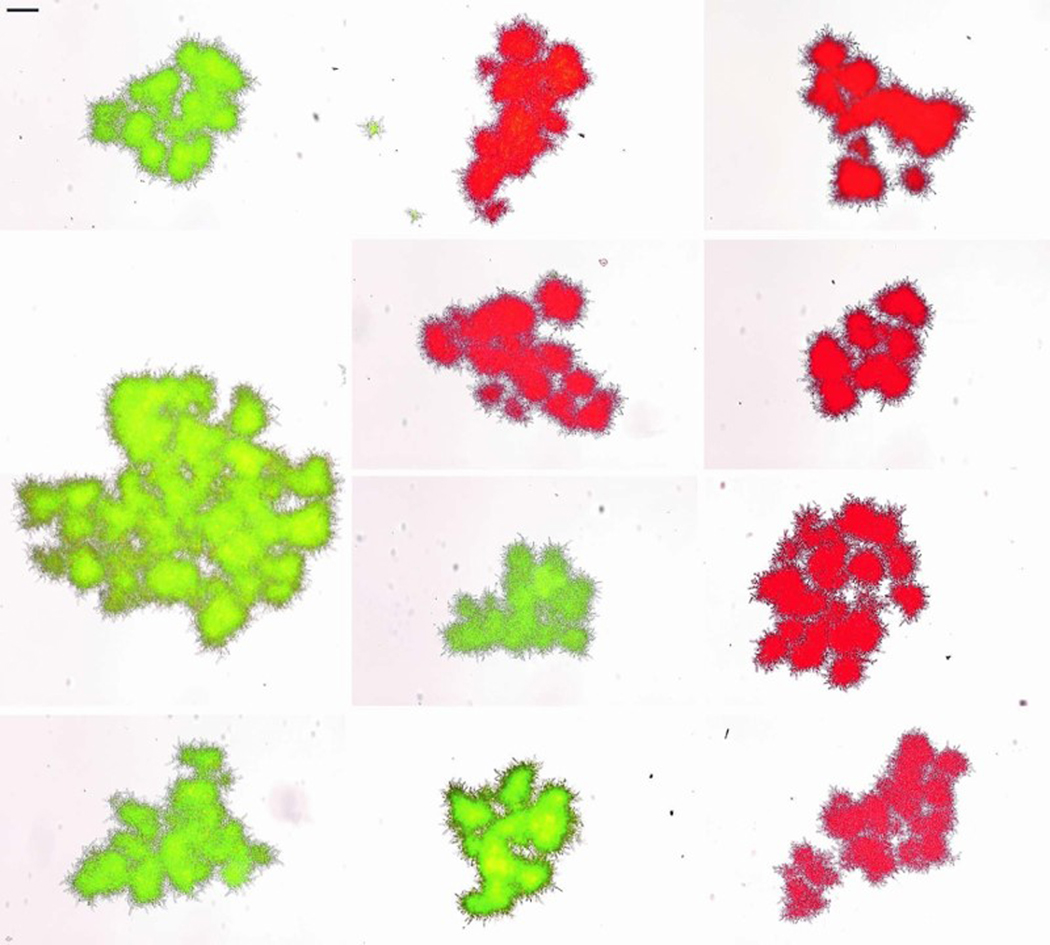
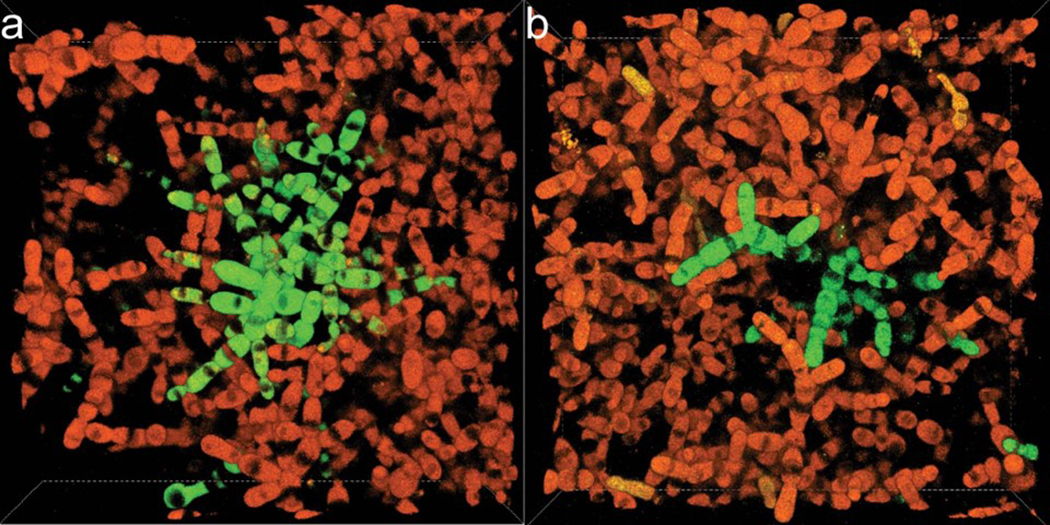
While early multicellular lineages necessarily started out as relatively simple groups of cells, little is known about how they became Darwinian entities capable of sustained multicellular evolution1-3. Here we investigate this with a multicellularity long-term evolution experiment, selecting for larger group size in the snowflake yeast (Saccharomyces cerevisiae) model system. Given the historical importance of oxygen limitation4, our ongoing experiment consists of three metabolic treatments5-anaerobic, obligately aerobic and mixotrophic yeast. After 600 rounds of selection, snowflake yeast in the anaerobic treatment group evolved to be macroscopic, becoming around 2 × 10⁴ times larger (approximately mm scale) and about 104-fold more biophysically tough, while retaining a clonal multicellular life cycle. This occurred through biophysical adaptation-evolution of increasingly elongate cells that initially reduced the strain of cellular packing and then facilitated branch entanglements that enabled groups of cells to stay together even after many cellular bonds fracture. By contrast, snowflake yeast competing for low oxygen5 remained microscopic, evolving to be only around sixfold larger, underscoring the critical role of oxygen levels in the evolution of multicellular size. Together, this research provides unique insights into an ongoing evolutionary transition in individuality, showing how simple groups of cells overcome fundamental biophysical limitations through gradual, yet sustained, multicellular evolution.


Figures

Extended Data Fig. 1
Extended Data Fig. 1. Temporal dynamics of size evolution in each population and treatment group.
Data points show the weighted average radius of cluster size for the entire population. This was calculated by measuring the size of an average of 1150 snowflake yeast clusters per sample population (3 ancestors + 3 treatment groups × 5 replicate populations × 12 time points = 183 samples, all data is publicly available under the raw data file). Please see the Methods section for details on how weighted average radius was calculated.
Extended Data Fig. 2.
Extended Data Fig. 2.. Characterizing the life-cycle of the ancestral (microscopic) and evolved (macroscopic) snowflake yeast.
a, During the ~24-hour growth cycle, snowflake yeast compete for growth and reproduction in 10 mL of YPED (250 RPM at 30°C). At the end of the growth phase, we select for larger group size via settling selection. While there is a theoretical maximum survival rate of 15% (that is, if all of the cells survived settling selection), we only transfer the bottom 50 μl of pellet biomass regardless of how many cells settle, creating an arms race that favors the fastest groups within the population. Our measurements of the number of cellular generations per day in Fig. 1a suggests about 3% of the cells survive from one day to the next on average. b, Both the microscopic (ancestral) and macroscopic (t600) snowflake yeast clusters have a life cycle, reproducing during the growth phase. c, Consistent with entanglement producing tough groups, macroscopic snowflake yeast release mostly microscopic propagules, possibly from branch tips at the exterior of the group, where the opportunity for entanglement is minimal. Despite the presence of many small propagules, most of the biomass in the population is contained within macroscopic clusters. The open circles represent the biomass-weighted mean size, which is the average sized group the mean cell finds itself in. A total of 14,313 clusters were analyzed for the t0 time point, and 1,603 clusters were analyzed for the t600 time point, across 0, 3, 6, 12, and 24-hour time points.
Extended Data Fig. 3.
Extended Data Fig. 3.. Cluster size and aspect ratio distribution.
a, Biomass distribution as a function of cluster size for the ancestral snowflake yeast (dotted line) and 600 day evolved populations of PA1-PA5. The ‘weighted mean size’ used in Figures 1, 2 and 4 is the mean of the biomass distribution. b, Distribution of aspect ratios for ancestral and 600-day evolved populations of anaerobic snowflake yeast.
Extended Data Fig. 4.
Extended Data Fig. 4.. Cell shape is not substantially affected by location within macroscopic yeast.
a and b show cell volume and cell shape (aspect ratio) measured for 10 cells from the interior of a macroscopic cluster and 10 cells from the exterior of a cluster (measured in t600 macroscopic clusters). Average cell volume for exterior and interior are 110.8 μm3 and 113.1 μm3 (p=0.88, t=0.15 df=17.55, Welch’s t-test), and average cell shape for exterior and interior are 2.9 and 2.8 (p=0.51, t=0.68, df=14, Welch’s t-test). Individual measurements are marked as points, the mean and one standard deviation are indicated by the bar plot.
Extended Data Fig. 5.
Extended Data Fig. 5.. Parallel evolution of elongated cell shape across all five replicates of each PA population.
For each evolutionary time point and population, five different cells are shown (organized vertically from left to right: PA1 on the further left and PA5 on the further right in each box). Scale bar is 5 μm (under the ancestral cell). This is a more detailed version of the plot shown in Fig. 2c.
Extended Data Fig. 6.
Extended Data Fig. 6.. Macroscopic snowflake yeast are monoclonal, growing via permanent mother-daughter cellular bonds, not aggregation.
We co-cultured GFP and RFP-tagged genotypes of a macroscopic single strain isolate (PA2, strain ID: GOB1413–600) for 5 days, then imaged 70 clusters on a Nikon Ti-E. Shown are a composite of 11 individual clusters, which all remain entirely green or red. Individual clusters were compressed with a coverslip for imaging, resulting in their fragmentation into multiple modules. Scale bar (top-left) is 100 μm.
Extended Data Fig. 7.
Extended Data Fig. 7.. Quantifying entanglement via analysis of the topology and geometry of a snowflake yeast cluster.
a, We measured entanglement of individual components by fitting a convex hull around each component, and determining whether the other component overlaps with the space bounded by this convex hull. Here we just show the convex hull for the blue component, which overlaps with the red component. These components are thus part of the same entangled component. b, Using this approach, we identified the components within a sub-volume of a macroscopic snowflake yeast, and used a percolation analysis to examine the fraction of the biomass that is part of the same entangled component (colored in red).
Extended Data Fig. 8.
Extended Data Fig. 8.. Cell stiffness and stress-strain curve.
a, Individual cells do not change their stiffness over 600 rounds of selection (average cell stiffness for the ancestor and t600 isolates are 0.019 and 0.020, respectively. p=0.77, t=0.31, df=8, Welch’s unequal variances t-test). Single-cell stiffness values measured from atomic force microscopy (AFM) of individual cells. Error bars are one standard deviation. b, Macroscopic snowflake yeast fractured into small modules prior to compression do not show strain stiffening behavior. Shown here is an AFM trajectory of cantilever deflection vs displacement for one t600 cluster that has been crushed into small, unentangled pieces.
Extended Data Fig. 9.
Extended Data Fig. 9.. Representative confocal images show chimeric clusters that are formed after growth in liquid culture followed by entanglement on agar plates.
Each frame is 139.64 × 139.64 × 34.50 μm in X, Y, and Z axes, respectively.
Extended Data Fig. 10.
Extended Data Fig. 10.. Dimensions of bud scars connecting cells in microscopic, ancestral (t0, gray) and macroscopic, evolved snowflake yeast clusters (PA2 t600, blue).
Macroscopic t600 yeast had 2.4x larger bud scar cross-sectional area (a; p<0.001, t=5.3, df=24, t-test), 2.8x greater bud scar height (b; p<0.001, t=12.5, df=24, t-test), resulting in bud scars with 5.8-fold greater volume (c; p<0.001, t=7.3, df=24, t-test) than the microscopic ancestor. Error bars are one standard deviation. b, Histogram of pixel intensities for bud scars stained with chitin stain calcofluor white, isolated from ancestor (t0, microscopic) and t600 (macroscopic) bud scars. The t600 strain has a 27% higher mean fluorescence intensity, suggesting that they may have evolved moderately chitin density in the bud scar. c, The size differences in bud scars is readily visible. Shown are the side view of buds from the ancestor (left) and t600 evolved (right), imaged at the same microscope settings. The scale bar is 0.5 μm.
Fig. 1.
Fig. 1.. Evolution of macroscopic multicellularity in five replicate snowflake yeast populations.
a, We selected for larger size over 600 daily transfers, which represents ~3,000 generations. b, Only the anaerobic populations (PA1–5) evolved macroscopic size over this time. c, Individual snowflake yeast clusters from t600 are visible to the naked eye. d, Representative clusters of the same two genotypes (ancestor in the upper right corner) shown under the same magnification (color represents depth in the z plane). e, Temporal dynamics of size evolution in the anaerobic treatment (PA), showing a dramatic increase in mean cluster radius (p < 0.0001; F5, 13321 = 2100, Dunnett’s test in one-way ANOVA comparing t600 to t0). f, Macroscopic snowflake yeast were considerably more fit, calculated as a per-day selection rate constant , than their microscopic ancestor (F5,12 = 39.5, p < 0.0001, one-way ANOVA. Dunnett’s test comparing each evolved isolate to their ancestor, p < 0.0001, denoted by asterisks). For each genotype we performed three replicate fitness assays, error bars represent one SD. In a, the number of generations was estimated by measuring the average daily dilution factor for 15 populations, each with 3 technical replicates, across 3 time-points, resulting in a total of 45 samples. In b and e, the data points represent the biomass-weighted mean radius (see Methods for details) calculated by measuring the size of an average of 1150 snowflake yeast clusters per sample population (3 ancestors + 3 treatment groups x 5 replicate populations x 12 time points = 183 samples). See Extended Data Fig. 1 for additional data on the evolution of cluster size in oxygen-using populations (PM and PO) and Extended Data Fig. 3a for cluster size distributions for the 600-day anaerobic populations (PA1–5). Lines in e are Lowess smoothing curves intended to aid the eye. See source data and raw data files for data underlying a, b, e, and f.
Fig. 2.
Fig. 2.. Evolution of novel cell morphology.
a, When compressed, macroscopic snowflake yeast fracture into modules, retaining the same underlying branched growth form of their microscopic ancestor as seen in b (scale bars are 20 μm). Cell walls are stained with calcofluor-white in a and b. c and d show the parallel evolution of elongated cell shape (scale bar in c is 5 μm, and the ancestral genotype is the same in all replicate populations), resulting in an increase in average aspect ratio from ~1.2 to ~2.7 (F5, 1993 = 206.2, p < 0.0001, one-way ANOVA comparing t600 and t0. Dunnett’s test comparing each t600 population to the ancestor, p < 0.0001). An expanded version of c is shown in Extended Data Fig. 5. e, Early in their evolution (aspect ratio 1–2.3), cluster size (weighted mean radius) is an approximately linear function of cellular aspect ratio (inset; p < 0.0001, y = 41.1x - 27.8, r2 = 0.72, linear regression analysis). This relationship does not hold beyond aspect ratio ~2.5. f, A biophysical model of snowflake yeast predicts that increasing cellular aspect ratio should decrease cellular packing fraction (black points). We see a close correspondence with these predictions for low aspect ratios, but our experimental data diverges from model predictions for aspect ratios beyond 2. For each point in d, 453 cells per population were measured on average (1 ancestor + 5 replicates x 12 time points, each separated by 50 days = 61 samples). Each datapoint in f reports the mean of 15 snowflake yeast clusters or 25 replicate simulations; error bars are one SD.
Fig. 3.
Fig. 3.. Branch entanglement underlies the evolution of macroscopic size.
a shows two entangled components (green and tan), obtained via SBF-SEM imaging. b, Branch entanglement is pervasive in macroscopic snowflake yeast. Starting with the two-component sub-volume in a, we percolated entanglement by adding on adjacent entangled components in four steps (I-IV). Scale bars on a and b are 5 μm. c, Stress vs. strain plot for macroscopic snowflake yeast (PA2, t600) clusters in blue and the ancestor in grey (ancestor shown again in inset with a rescaled y axis). Macroscopic snowflake yeast experience strain stiffening, a hallmark of entangled systems, while the ancestor’s stress-strain plot is linear (i.e., r2 = 0.97 +/− 0.02), which is expected for non-entangled systems. The shaded area shows one SD based on 10 repeated measurements for each.
Fig. 4.
Fig. 4.. Whole-genome sequencing reveals the dynamics of molecular evolution and the genetic basis of cell-level and cluster-level changes.
a and b show the number and types of mutations in evolved single strains from each population. c GIN4, a kinase whose loss of function increases bud neck size (see Source Data file), is mutated in two independent populations. d Macroscopic snowflake yeast were enriched in mutations affecting cell cycle progression, cytoskeleton, and filamentous growth. In addition, we saw mutations affecting budding (i.e., the location of buds on the cell surface, and bud neck size). e Representative images of cells from strains used to re-engineer macroscopic size. Scale bars are 10 μm. f Engineered strains recapitulated the evolutionary trajectory established over 600 rounds of selection. With cellular aspect ratio below ~2.5, snowflake yeast remained microscopic, greatly increasing in size beyond this threshold (experimentally-evolved strains described in Fig. 1e are shown in gray to facilitate direct comparison). Scale bars are 10 mm. In f, the mean cluster size and aspect ratio of six genotypes were calculated by measuring an average of 1132 multicellular clusters and 1205 individual cells per genotype (see the raw data file for details).

Similar articles

Cited by

References

    1. Libby E & Rainey PB. A conceptual framework for the evolutionary origins of multicellularity. Physical biology 10, 035001 (2013). - PubMed
    1. Michod RE in The Evolution of Multicellularity 25–52 (CRC Press, 2022).
    1. Buss LW. The evolution of individuality. Vol. 796 (Princeton University Press, 2014).
    1. Knoll AH. The multiple origins of complex multicellularity. Annual Review of Earth and Planetary Sciences 39, 217–239 (2011).
    1. Bozdag GO, Libby E, Pineau R, Reinhard CT & Ratcliff WC. Oxygen suppression of macroscopic multicellularity. Nature Communications 12, 1–10 (2021). - PMC - PubMed

LinkOut - more resources