. 2023 Jun;618(7967):1041-1048.
doi: 10.1038/s41586-023-05974-0. Epub 2023 May 10.

Mitotic clustering of pulverized chromosomes from micronuclei

Affiliations

Mitotic clustering of pulverized chromosomes from micronuclei

Yu-Fen Lin et al. Nature. 2023 Jun.

Abstract

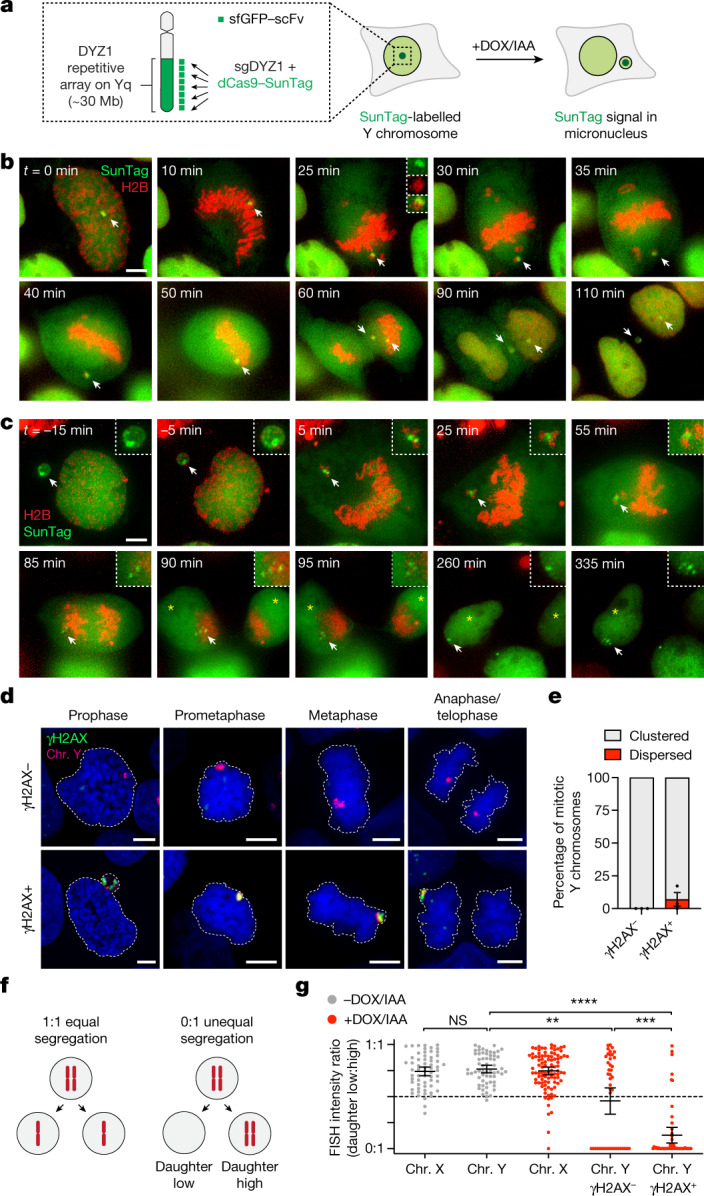
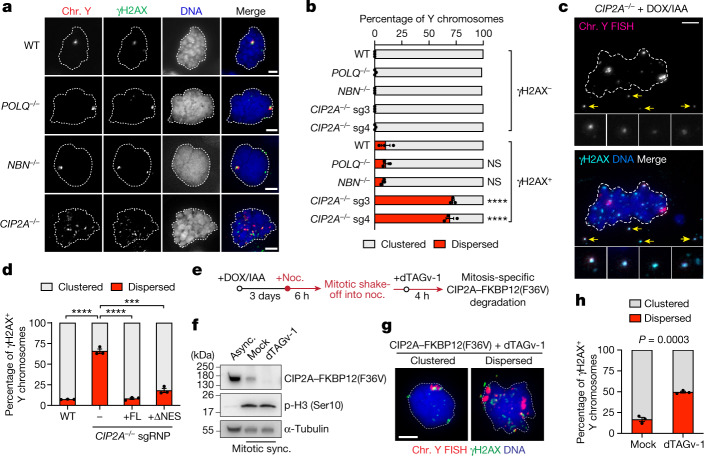
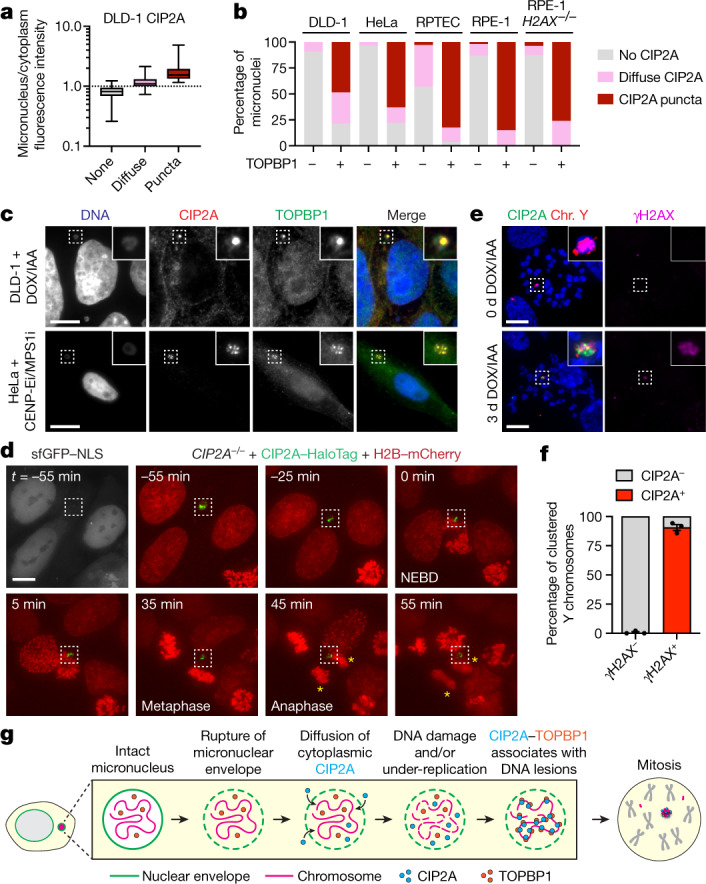
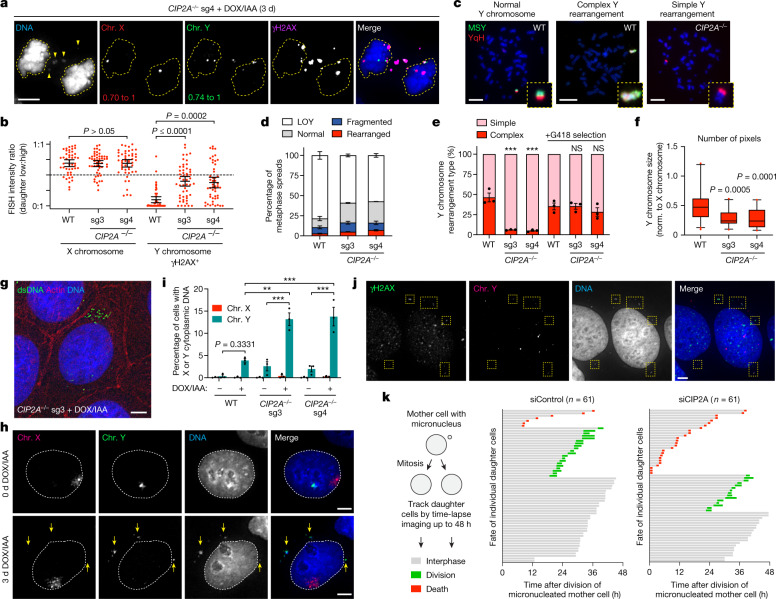
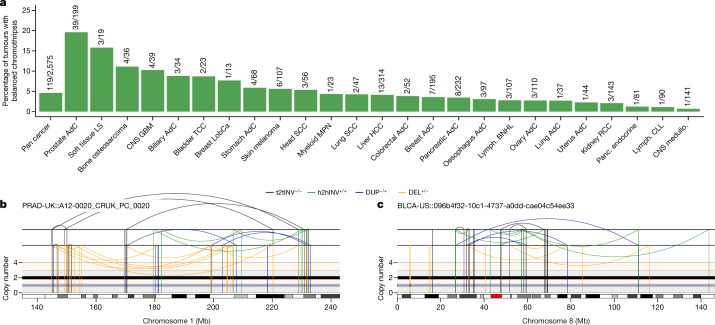
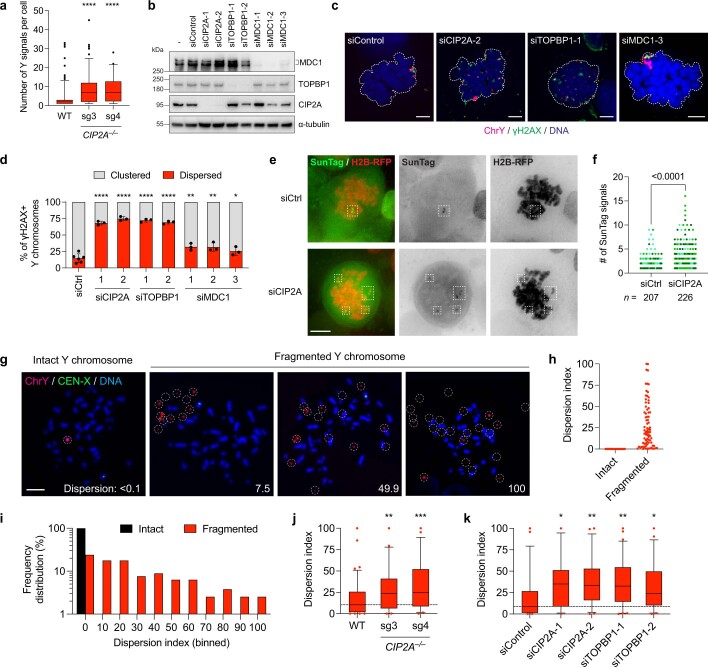
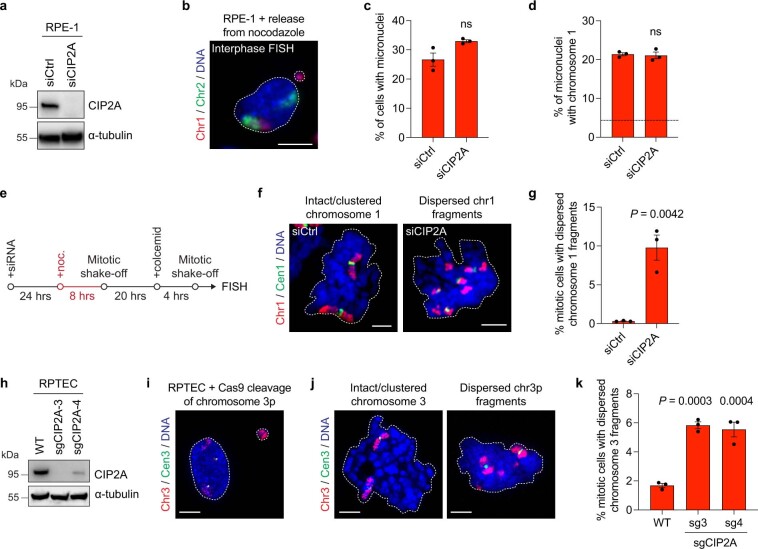
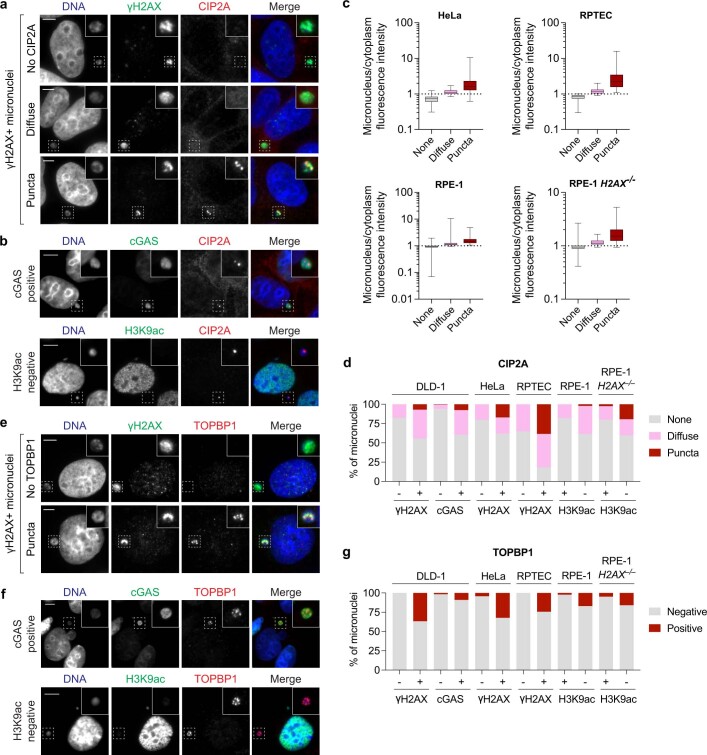
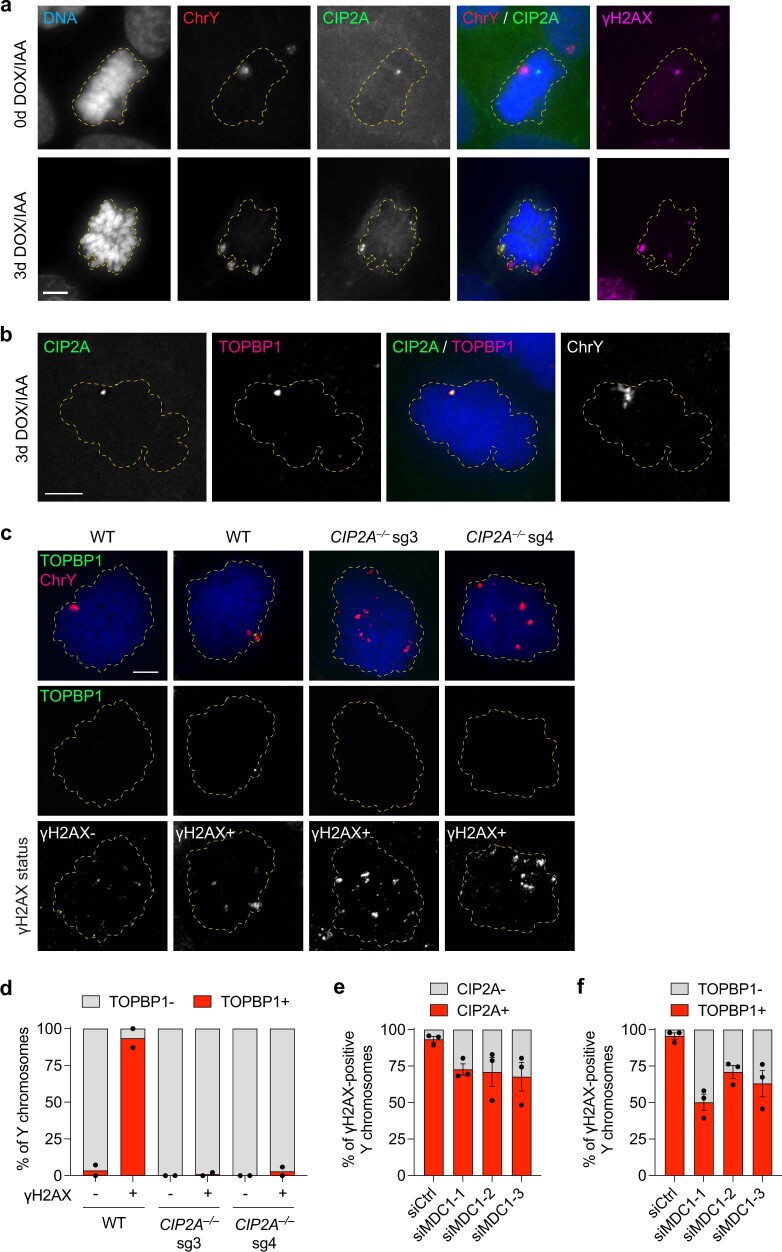
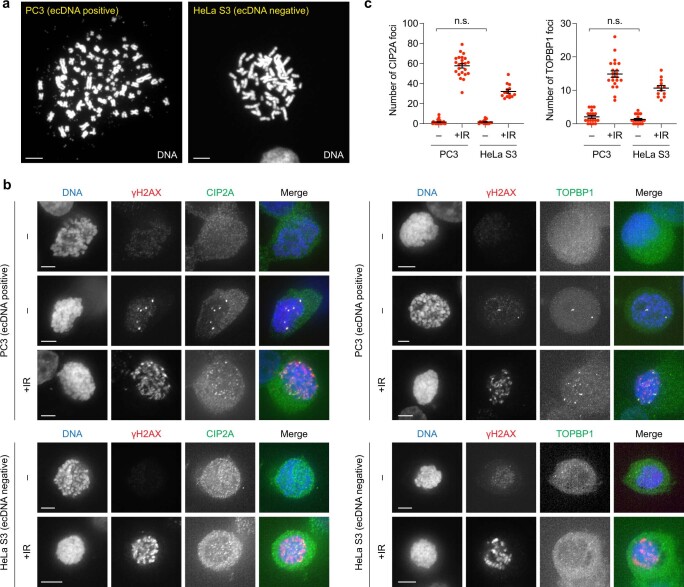
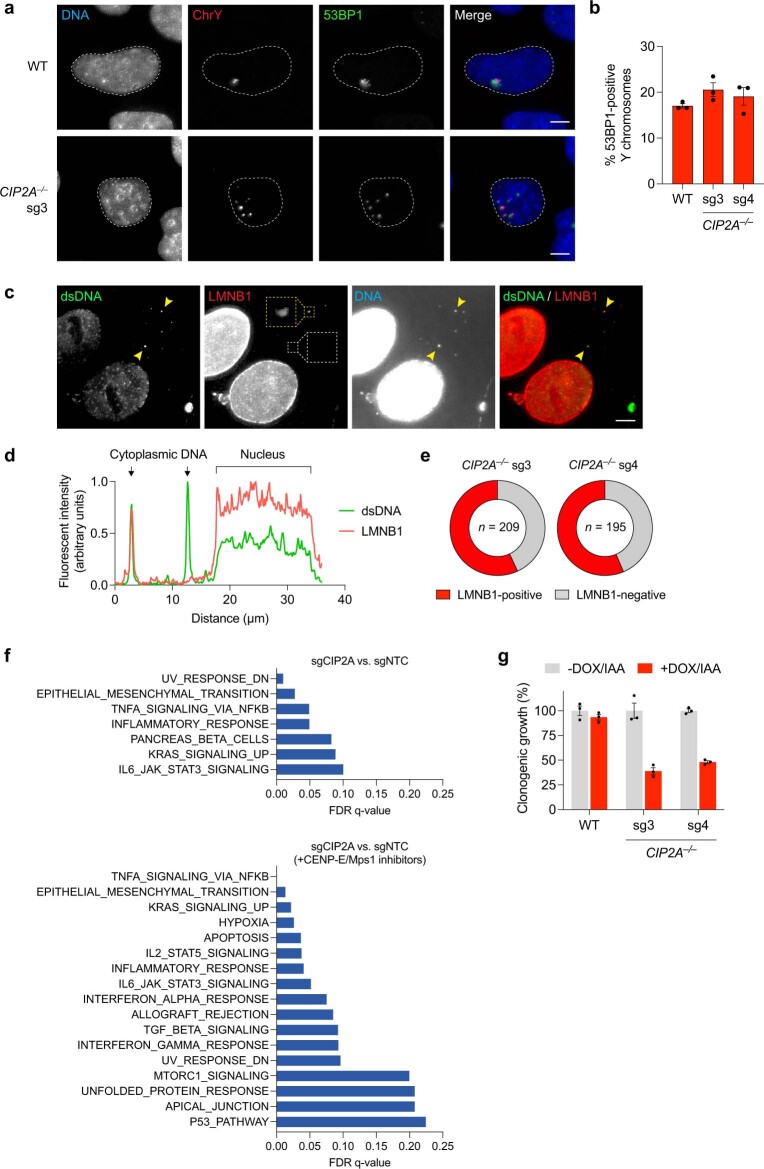
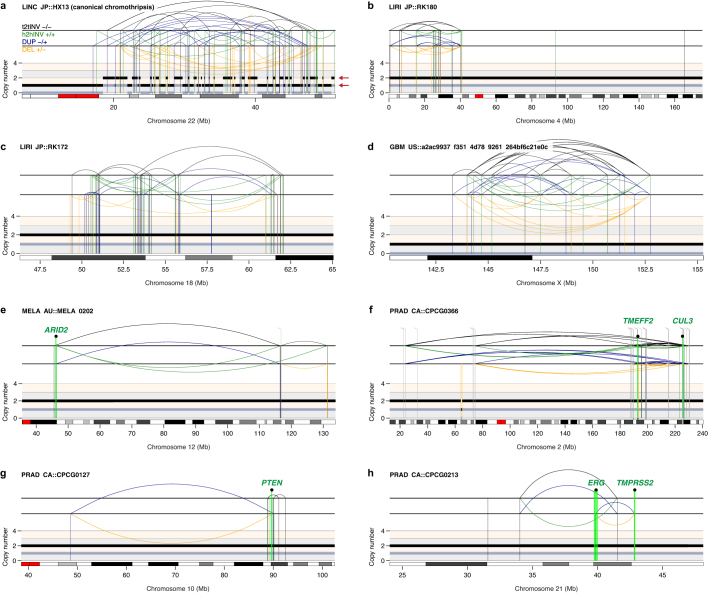
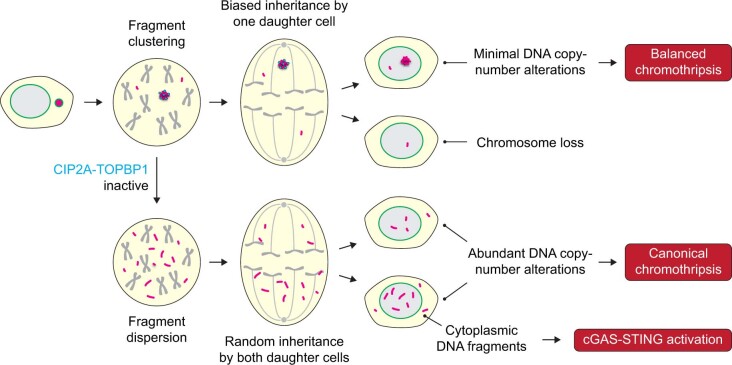
Complex genome rearrangements can be generated by the catastrophic pulverization of missegregated chromosomes trapped within micronuclei through a process known as chromothripsis1-5. As each chromosome contains a single centromere, it remains unclear how acentric fragments derived from shattered chromosomes are inherited between daughter cells during mitosis6. Here we tracked micronucleated chromosomes with live-cell imaging and show that acentric fragments cluster in close spatial proximity throughout mitosis for asymmetric inheritance by a single daughter cell. Mechanistically, the CIP2A-TOPBP1 complex prematurely associates with DNA lesions within ruptured micronuclei during interphase, which poises pulverized chromosomes for clustering upon mitotic entry. Inactivation of CIP2A-TOPBP1 caused acentric fragments to disperse throughout the mitotic cytoplasm, stochastically partition into the nucleus of both daughter cells and aberrantly misaccumulate as cytoplasmic DNA. Mitotic clustering facilitates the reassembly of acentric fragments into rearranged chromosomes lacking the extensive DNA copy-number losses that are characteristic of canonical chromothripsis. Comprehensive analysis of pan-cancer genomes revealed clusters of DNA copy-number-neutral rearrangements-termed balanced chromothripsis-across diverse tumour types resulting in the acquisition of known cancer driver events. Thus, distinct patterns of chromothripsis can be explained by the spatial clustering of pulverized chromosomes from micronuclei.


Conflict of interest statement

S.F.B. owns equity in, receives compensation from and serves as a consultant and on the scientific advisory board and board of directors of Volastra Therapeutics. The other authors declare no competing interests.

Figures

Fig. 1
Fig. 1. Pulverized chromosomes from micronuclei spatially cluster throughout mitosis for biased inheritance by a single daughter cell.
a, Schematic of the chromosome-labelling strategy using a dCas9–SunTag to target sfGFP fused to a single-chain variable fragment (sfGFP–scFv) to the Y-chromosome DYZ1 satellite array. Treatment with DOX/IAA triggers Y centromere inactivation and chromosome missegregation into micronuclei. b, Time-lapse images of a dCas9–SunTag-labelled Y chromosome (white arrow) missegregating into a micronucleus during mitosis after induction with DOX/IAA for 2 days. c, Time-lapse images of a dCas9–SunTag-labelled Y chromosome in a micronucleus clustering throughout mitosis with uneven distribution of the SunTag signal between daughter cells (yellow asterisks). A representative example is shown from n = 13 events obtained from independent experiments. In b and c, chromatin is labelled with H2B–mCherry. Scale bar, 5 μm. d, Micronuclear chromosome clustering in fixed DLD-1 cells at different stages of mitosis visualized by DNA FISH with chromosome paint probes. γH2AX was used to identify pulverized chromosomes from micronuclei with extensive DNA damage. DNA was stained with 4′,6-diamidino-2-phenylindole (DAPI) (blue). Scale bar, 5 μm. e, Quantification of fragment clustering with and without γH2AX from prometaphase to metaphase. Data are mean ± s.e.m. of n = 3 independent experiments; n = 595 (γH2AX) and n = 230 (γH2AX+) cells. f, Schematic of chromosome distribution in a 1:1 or 0:1 segregation ratio between daughter cell pairs. g, FISH measurements between pairs of daughter cells indicate that pulverized chromosomes (chr.) are asymmetrically inherited by a single daughter. Data are mean ± 95% confidence intervals. Statistical analysis was performed using non-parametric Kruskal–Wallis test with correction for multiple comparisons; not significant (NS), P > 0.05; **P = 0.0026, ***P = 0.0006, ****P ≤ 0.0001. From left to right, n = 61, 61, 95, 44 and 51 daughter cell pairs pooled from 3 independent experiments. Representative images are shown in Extended Data Fig. 2f. Source Data
Fig. 2
Fig. 2. Inactivation of CIP2A disrupts mitotic clustering and disperses pulverized chromosome fragments.
a, DOX/IAA-treated mitotic DLD-1 cells with the indicated genotypes with γH2AX-positive Y chromosomes. sg3 and sg4 denote distinct sgRNAs targeting exon 1 of CIP2A. b, Fragment clustering from γH2AX-negative and γH2AX-positive Y chromosomes from a. Data are mean ± s.e.m. Statistical analysis was performed using one-way ANOVA with correction for multiple comparisons compared with the WT controls; ****P ≤ 0.0001. n = 3 independent experiments; from top to bottom, 657, 455, 352, 526, 383, 238, 165, 175, 179 and 149 cells. c, Mitotic CIP2A-KO (sg3) cell with γH2AX-positive Y-chromosome fragments displaced from the genomic mass (arrows). d, Fragment clustering from γH2AX-positive Y chromosomes from CIP2A-KO cells rescued by ectopic CIP2A–HaloTag. Data are mean ± s.e.m. Statistical analysis was performed using two-tailed t-tests compared with CIP2A-KO cells; ****P ≤ 0.0001, ***P = 0.0002. n = 3 independent experiments; 137 (WT), 200 (no rescue), 139 (full length (FL)) and 115 (ΔNES) cells. e, Schematic of inducing the depletion of CIP2A fused to a FKBP12(F36V) degron with dTAGv-1 in mitosis-synchronized cells. noc., nocodazole. f, Immunoblot analysis showing rapid degradation of CIP2A–FKBP12(F36V) after 4 h treatment of mitotic cells with dTAGv-1. Async, asynchronous; sync., synchronized. g, Clustered and dispersed Y-chromosome fragments after mitotic CIP2A depletion. h, Fragment clustering from γH2AX-positive Y chromosomes from g. Data are mean ± s.e.m. Significance was determined using two-tailed Student’s t-tests. n = 3 independent experiments; 194 (mock) and 188 (dTAGv-1) cells. For a,c and g, scale bars, 5 μm. Source Data
Fig. 3
Fig. 3. Recruitment of CIP2A–TOPBP1 to ruptured micronuclei poises acentric fragments for clustering upon mitotic entry.
a, Intensity measurements of distinct CIP2A localization patterns in micronuclei compared with to the cytoplasmic pool. The box plots show the median (centre line) and the interquartile range (box limits) with the minimum–maximum values (whiskers). n = 392 (none), n = 99 (diffuse), n = 23 (puncta) micronuclei from 3 independent experiments. Example images are provided in Extended Data Fig. 6. b, The frequency of TOPBP1-positive micronuclei with the indicated patterns of CIP2A across a panel of human cell lines containing micronuclei induced by various methods. Data are mean. From left to right, n = 165, 33, 182, 27, 290, 85, 208, 40, 247 and 25 micronuclei pooled from 2 (DLD-1 and HeLa) or 3 (RPTEC and RPE-1) independent experiments. c, Co-localization of CIP2A and TOPBP1 puncta in micronuclei of DLD-1 cells with Y-chromosome micronuclei (top) and HeLa cells with micronuclei containing random chromosomes (bottom). Scale bar, 10 μm. d, Time-lapse example of interphase CIP2A–HaloTag signal in a ruptured micronucleus (lacking sfGFP–NLS) through mitotic entry and the completion of mitosis. The yellow asterisks denote the two newly formed daughter cells. NEBD, nuclear envelope breakdown. Scale bar, 5 μm. e, Examples of mitotic chromosomes showing a highly specific association between CIP2A and clusters of γH2AX-positive Y-chromosome fragments (+DOX/IAA) but not γH2AX-negative Y chromosomes (−DOX/IAA). Scale bar, 10 μm. f, Quantification of CIP2A localization on Y chromosomes with and without γH2AX from e. Data are mean ± s.e.m. n = 3 independent experiments; 611 (γH2AX) and 200 (γH2AX+) mitotic cells. g, Schematic of the stepwise series of events resulting in the premature engagement of CIP2A–TOPBP1 with DNA lesions following micronuclear envelope rupture during interphase. Source Data
Fig. 4
Fig. 4. Dispersed chromosome fragments randomly partition between daughter cells, undergo error-prone DNA repair and misaccumulate as cytoplasmic DNA.
a, CIP2A loss distributes pulverized chromosomes to both daughters during mitosis. b, FISH intensity ratios between daughter cell pairs. Data are mean ± 95% confidence intervals. P values were determined using non-parametric Kruskal–Wallis test with correction for multiple comparisons. n = 47 (WT), n = 51 (sg3) and n = 49 (sg4) daughter cell pairs pooled from 3 independent experiments. c,d, Examples (c) and frequencies (d) of Y-chromosome rearrangements using dual-coloured chromosome paint probes on WT and CIP2A-KO metaphases after DOX/IAA induction. Data are mean ± s.e.m. n = 3 independent experiments; 1,060 (WT), 990 (sg3) and 884 (sg4) metaphases. YqH, Y-chromosome q arm heterochromatic region. LOY, loss of the Y chromosome. e, Y-chromosome rearrangements with and without selection for a Y-encoded neomycin-resistance marker. Data are mean ± s.e.m. Statistical analysis was performed using one-way ANOVA; ***P = 0.0002. n = 3 independent experiments; from left to right, 29, 49, 62, 151, 166 and 156 metaphases. f, The number of DAPI pixels occupied by Y chromosomes with complex rearrangements relative to the X chromosome. The box plots show the median (centre line) and 5th to 95th percentile (box limits). P values were determined using one-way ANOVA. n = 39 (WT), n = 23 (sg3) and n = 28 (sg4) chromosomes from 3 independent experiments. Norm., normalized. g, Semi-permeabilized DLD-1 cells stained with anti-dsDNA antibodies. Actin was used to demarcate cell boundaries. h, DNA FISH with chromosome paint probes showing Y-chromosome-specific cytoplasmic DNA foci in CIP2A sg3 KO cells. i, Quantification of the percentage of cells with X or Y chromosome-derived cytoplasmic DNA in h. Data are mean ± s.e.m. Statistical analysis was performed using one-way ANOVA with Tukey’s multiple-comparisons test; **P = 0.0012, ***P ≤ 0.001. n = 3 independent experiments; from left to right, 2,410, 3,322, 1,960, 2,946, 2,100 and 3,940 cells. j, γH2AX-positive Y-chromosome fragments (yellow boxes) in the cytoplasm of interphase CIP2A sg4 KO cells. k, The fate of daughter cells from micronucleated mother cells was monitored over a 48 h period. Each bar represents a single daughter cell. Scale bars, 5 μm (a, gh and j) and 10 μm (c). Source Data
Fig. 5
Fig. 5. Prevalence of DNA copy-number-neutral, balanced chromothripsis events across pan-cancer genomes.
a, The frequency of balanced chromothripsis in the ICGC/TCGA PCAWG cohort. The fractions represent the number of tumours with balanced chromothripsis in at least one chromosome over the total number of tumours of each type analysed. AdC, adenocarcinoma; CNS GBM, central nervous system glioblastoma; CNS medullo., central nervous system medulloblastoma; Head SCC, head-and-neck squamous cell carcinoma; HCC, hepatocellular carcinoma; LS, liposarcoma; LobCa, lobular carcinoma; Lymph. BNHL, lymphoid mature B cell lymphoma; Lymph. CLL, lymphoid chronic lymphocytic leukemia; MPN, myeloproliferative neoplasm; Panc. endocrine, pancreatic neuroendocrine tumour; RCC, renal cell carcinoma; TCC, transitional cell carcinoma. b,c, Examples of balanced chromothripsis events in prostate adenocarcinoma (b) and bladder cancer (c) characterized by clusters of interleaved rearrangements, as expected for the random rejoining of genomic fragments shattered in chromothripsis, but without DNA loss, as indicated by the lack of deletions. The total and minor copy-number data are represented in black and grey, respectively. DEL, deletion-like rearrangement; DUP, duplication-like rearrangement; h2hINV, head-to-head inversion; t2tINV, tail-to-tail inversion. An example of canonical chromothripsis and additional examples of balanced chromothripsis events are provided in Extended Data Fig. 10.
Extended Data Fig. 1
Extended Data Fig. 1. Development of a live-cell Y chromosome-labelling system by targeting dCas9-SunTag to the DYZ1 array.
a) Images of DLD-1 cell populations expressing dCas9-SunTag and sfGFP-scFv with the indicated sgRNAs targeting the DYZ1 array. Scale bar, 5 μm. b) List of sgRNA sequences used in (a). sgDYZ1-2 was used for the remainder of the study. c) Images of DLD-1 cell populations expressing sfGFP-scFv under the control of full-length or truncated CMV promoters with dCas9-SunTag containing the indicated scaffold lengths. Scale bar, 5 μm. d) Signal-to-noise measurements for the conditions shown in (c). Data represent mean; from left to right, n = 13, 13, 15, 11, 12, and 10 cells. e) IF-FISH image of interphase cells showing co-localization between an anti-GFP antibody recognizing sfGFP bound to dCas9-SunTag and DNA FISH probes targeting the Y chromosome q-arm heterochromatic array (YqH). Scale bar, 5 μm. f) Fluorescent line scan analysis of the indicated region marked in (e) showing high specificity of the SunTag with YqH FISH. g) IF-FISH image of mitotic chromosomes showing co-localization between an anti-GFP antibody recognizing dCas9-SunTag with chromosome paint probes targeting YqH. Scale bar, 10 μm. h) Example images of live DLD-1 cells with dCas9-SunTag signals in the nucleus or micronucleus. Scale bar, 5 μm. i) Proportion of nuclei and micronuclei with or without dCas9-SunTag signals following DOX/IAA induction for the indicated number of days. Data represent mean ± SEM of n = 3 independent experiments; 0 days = 1,044, 2 days = 1,070, 3 days = 1,123 cells. j) Background fluorescence measurements of non-dCas9-SunTag-bound sfGFP-scFv from n = 13 micronuclei obtained from independent experiments (left) and schematic of intact and ruptured micronuclei measurements (right). Source Data
Extended Data Fig. 2
Extended Data Fig. 2. Micronucleation produces clusters of damaged chromosome fragments that unequally reincorporate into daughter cell nuclei.
a) Examples of clustered (left panels) and dispersed (right panels) Y chromosome signals in the interphase nucleus with or without γH2AX. Percentages shown represent the proportion of cells that exhibit each category following 3d DOX/IAA treatment. Scale bar, 5 μm. b) Pie charts depicting the fraction of control or DOX/IAA-treated cells with clustered or dispersed Y chromosome fragments during interphase. Data pooled from 2 independent experiments; -DOX/IAA: n = 376, +DOX/IAA: n = 858 cells. c) Pie charts depicting the γH2AX status of clustered and dispersed Y chromosome fragments. Data pooled from 2 independent experiments; clustered: n = 828, dispersed: n = 30 fragments. d) Re-integrated Y chromosome fragments occupy a larger nuclear space with increased nuclear fluorescence signal area following DOX/IAA treatment. Scale bar, 5 μm. e) Violin plot quantification of (d) measuring Y chromosome FISH area over the total area of the nucleus, as indicated by DAPI staining; data pooled from 0d: n = 103, 3d: n = 105 Y chromosome clusters; ****P ≤ 0.0001 by Welch’s two-tailed unpaired t-test. f) Images of equal segregation of an intact Y chromosome (top) and pulverized Y chromosome exhibiting unequal partitioning between daughter cells. Scale bar, 5 μm. Quantification shown in Fig. 1g. Source Data
Extended Data Fig. 3
Extended Data Fig. 3. Characterization of human DLD-1 cells harbouring biallelic deletions in CIP2A.
a) Immunoblot confirmation of CIP2A KO clones. b) Growth curves of WT and CIP2A KO cells with and without DOX/IAA treatment over the indicated number of days. Data represent mean ± SEM; n = 3 biological replicates. c) Flow cytometry analysis of propidium iodide-stained WT and CIP2A KO cells showing similar cell cycle distribution profiles. d) Proportion of micronucleated cells with or without 2d DOX/IAA induction, as determined by DAPI staining. Data represent mean ± SEM; WT: **P = 0.0017, sg3: **P = 0.0023, sg4: *P = 0.0261 by two-tailed t-test compared to untreated controls; n = 3 independent experiments; WT (-DOX/IAA = 5,521, +DOX/IAA = 3,718), CIP2A KO sg3 (-DOX/IAA = 3,436, +DOX/IAA = 2,450), CIP2A KO sg4 (-DOX/IAA = 3,999, +DOX/IAA = 2,930 cells). e) Frequency of Y chromosome fragmentation among Y chromosome-positive metaphase spreads following 3d DOX/IAA induction. Data represent mean ± SEM; not significant (ns), P > 0.05 by two-tailed t-test compared to WT controls; n = 3 independent experiments; WT = 234, CIP2A KO sg3 = 269, CIP2A KO sg4 = 284 cells. f) Mitotic CIP2A KO cells exhibiting fragment dispersion with and without cell cycle arrest with the indicated mitotic inhibitors. Dispersion frequencies and the number of cells analysed are shown. g) Immunoblot of ectopic CIP2A-HaloTag complementation in CIP2A KO cells generated by a frameshift deletion in exon 3 induced by Cas9 ribonucleoprotein (sgRNP) delivery. FL, full length; NES, nuclear export signal. Source Data
Extended Data Fig. 4
Extended Data Fig. 4. Loss of CIP2A-TOPBP1, but not MDC1, disperses fragmented chromosomes during mitosis.
a) Quantification of Y chromosome-positive signals in WT and CIP2A KO cells. Data represent median with 5-95 percentiles; ****P ≤ 0.0001 by two-tailed t-test compared to WT controls; WT: n = 214, CIP2A KO sg3: n = 113, CIP2A KO sg4: n = 84 cells pooled from 2 independent experiments. b) Immunoblot of CIP2A, TOPBP1, and MDC1 depletion in WT DLD-1 cells using two or three independent small interfering RNAs. Whole-cell extracts were collected 96 h after transfection. c) Images of fragmented Y chromosomes in mitotic WT DLD-1 cells depleted of CIP2A, TOPBP1, or MDC1 prior to DOX/IAA induction. Scale bar, 5 μm. d) Quantification of fragment clustering and dispersion from (c). Data represent the mean ± SEM of n = 5 (siCtrl) or 3 (all other conditions) independent experiments; *P = 0.0495, **P = 0.001, ****P ≤ 0.0001 by one-way ANOVA with multiple comparisons test compared to siControl sample; siControl = 450, siCIP2A-1 = 145, siCIP2A-2 = 178, siTOPBP1-1 = 138, siTOPBP1-2 = 133, siMDC1-1 = 298, siMDC1-2 = 386, siMDC1-3 = 281 cells. e) Live-cell images of dCas9-SunTag signals from nocodazole-arrested DLD-1 cells showing increased SunTag-positive fragments following CIP2A depletion. Scale bar, 5 μm. f) Quantification of the number of SunTag-positive signals from (e). Individual data points represent a single cell; data pooled from 3 independent experiments; two-tailed unpaired t-test with Welch’s correction. g) Metaphase spreads were collected from DLD-1 cells treated with DOX/IAA and hybridized to Y chromosome FISH probes. Examples of intact and fragmented Y chromosomes are shown along with dispersion index (see Methods for measurements). Scale bar, 10 μm. h) Quantification of metaphase fragment dispersion from (g). Data represent individual metaphase spreads with an intact or fragmented Y chromosome; intact: n = 19, fragmented: n = 79 metaphases from 3 independent experiments. i) Distribution of dispersion indices for intact and fragmented Y chromosomes from data shown in (h); intact: n = 19, fragmented: n = 79 metaphases from 3 independent experiments. j) CIP2A KO cells exhibit increased fragment dispersion on metaphase chromosome spreads. Data represent median with 5-95 percentiles; **P = 0.0042, ***P = 0.0002 by one-way ANOVA with multiple comparisons test compared to WT control sample; WT: n = 83, sg3: n = 54, sg4: n = 44 metaphases from 3 independent experiments. k) CIP2A or TOPBP1 depletion increases fragment dispersion on metaphase chromosome spreads. Data represent median with 5-95 percentiles; *P ≤ 0.05; **P ≤ 0.01 by one-way ANOVA with multiple comparisons test compared to siControl sample; siControl: n = 57, siCIP2A-1: n = 38, siCIP2A-2: n = 52, siTOPBP1-1: n = 63, siTOPBP1-2: n = 49 metaphases from 3 independent experiments. Source Data
Extended Data Fig. 5
Extended Data Fig. 5. CIP2A-mediated mitotic clustering in additional human cell lines with distinct sources of micronuclei.
a) Immunoblot confirmation of RPE-1 cells depleted of CIP2A 72 h after transfection. b) Image of RPE-1 cell harbouring a micronucleus containing chromosome 1. RPE-1 cells were arrested in mitosis using nocodazole, released into interphase, and hybridized to the indicated chromosome paint probes by FISH. Scale bar, 10 μm. c) Quantification of micronuclei frequencies in nocodazole-arrested RPE-1 cells depleted of CIP2A. Data represent mean ± SEM; not significant (ns), P > 0.05 by two-tailed t-test compared to siCtrl; n = 3 independent experiments; siCtrl = 1,230, siCIP2A = 1,096 cells. d) Proportion of micronuclei containing chromosome 1. Data represent mean ± SEM; not significant (ns), P > 0.05 by two-tailed t-test compared to siCtrl; n = 3 independent experiments; siCtrl = 334, siCIP2A = 359 micronuclei. Dotted line represents frequency expected by random chance. e) Schematic to measure mitotic clustering of chromosome 1 fragments following CIP2A depletion and induction of chromosome 1 micronuclei in RPE-1 cells. f) Images of mitotic cells containing an intact chromosome 1 or dispersed chromosome 1 fragments. Scale bar, 5 μm. g) Proportion of mitotic RPE-1 cells with visible chromosome 1 fragments following induction of chromosome 1 micronuclei. Data represent mean ± SEM; P-value derived from two-tailed t-test compared to siCtrl; n = 3 independent experiments; siCtrl = 997, siCIP2A = 1,361 mitotic cells. h) Immunoblot confirmation of RPTEC populations transduced with the indicated CRISPR lentiviruses. i) Image of RPTEC harbouring a micronucleus containing chromosome 3p. Cas9 ribonucleoproteins were delivered into RPTECs to induce a DSB on the chromosome 3p arm near the centromere in the presence of a DNA-PK inhibitor. Scale bar, 5 μm. j) Images of mitotic cells containing an intact chromosome 3p or dispersed chromosome 3p fragments. Scale bar, 5 μm. k) Proportion of mitotic RPTECs with visible chromosome 3p fragments following induction of chromosome 3p micronuclei. Data represent mean ± SEM; P-values derived from one-way ANOVA with multiple comparisons test compared to WT cells; n = 3 independent experiments; WT = 1,050, sg3 = 1,223, sg4 = 1,236 mitotic cells. Source Data
Extended Data Fig. 6
Extended Data Fig. 6. Premature interphase recruitment of CIP2A-TOPBP1 to ruptured micronuclei.
a) Examples of CIP2A localization patterns in ruptured (γH2AX-positive) micronuclei of DLD-1 cells. Intensity measurements shown in Fig. 3a. Scale bar, 10 μm. b) Examples of CIP2A localization patterns in ruptured micronuclei in DLD-1 cells expressing cGAS-GFP and immunostained for cGAS accumulation (top) or the lack of acetylated H3K9 (bottom) in RPE-1 cells. Scale bar, 10 μm. c) Intensity measurements of distinct CIP2A localization patterns in micronuclei compared to the cytoplasm in the indicated cell lines. Box plot represents interquartile range with min-max; HeLa: none, n = 322, diffuse, n = 48, puncta, n = 30; RPTEC: none, n = 91, diffuse, n = 100, puncta, n = 69; RPE-1: none, n = 317, diffuse, n = 86, puncta, n = 34; RPE-1 H2AX–/–: none, n = 274, diffuse, n = 47, puncta, n = 40 micronuclei pooled from 3-5 independent experiments. d) Frequency of CIP2A localization patterns in ruptured (γH2AX-positive, cGAS-positive, or H3K9ac-negative) micronuclei across a panel of human cell lines. Data represent mean; from left to right, n = 218, 99, 169, 134, 119, 76, 111, 211, 196, 92, 121, and 67 micronuclei pooled from 2 (RPE-1 H2AX–/–) or 3 (all other conditions) independent experiments. e) Examples of TOPBP1 localization patterns in ruptured (γH2AX-positive) micronuclei of DLD-1 cells. Scale bar, 10 μm. f) Examples of TOPBP1 localization patterns in ruptured micronuclei in DLD-1 cells expressing cGAS-GFP and immunostained for cGAS accumulation (top) or the lack of acetylated H3K9 (bottom) in RPE-1 cells. Scale bar, 10 μm. g) Frequency of TOPBP1 localization patterns in ruptured (γH2AX-positive, cGAS-positive, or H3K9ac-negative) micronuclei across a panel of human cell lines. Data represent mean; from left to right, n = 323, 120, 172, 133, 143, 87, 160, 295, 221, 82, 230, and 88 micronuclei pooled from 3 independent experiments. For (d) and (g), DLD-1 cells were treated with DOX/IAA to induce Y chromosome micronuclei, HeLa and RPE-1 cells were treated with CENP-E/Mps1 inhibitors to induce random micronuclei, and RPTECs were transfected with Cas9 ribonucleoproteins targeting the chromosome 3p arm near the centromere to induce chromosome 3p micronuclei. Source Data
Extended Data Fig. 7
Extended Data Fig. 7. Mitotic localization of CIP2A-TOPBP1 on pulverized chromosomes.
a) Mitotic DLD-1 cells stained for CIP2A and H2AX and hybridized to chromosome paint probes. In untreated cells, CIP2A specifically co-localizes with spontaneous DNA lesions. Scale bar, 5 μm. b) Mitotic DLD-1 cell stained for CIP2A and TOPBP1 and hybridized to chromosome paint probes showing co-localization between CIP2A-TOPBP1 with the Y chromosome. Scale bar, 5 μm. c) Mitotic WT or CIP2A KO DLD-1 cells stained for TOPBP1 and H2AX and hybridized to chromosome paint probes. CIP2A loss prevents TOPBP1 recruitment to dispersed Y chromosome fragments. Scale bar, 5 μm. d) Quantification of (c). Data represent the mean of n = 2 independent experiments; left to right: 330, 114, 94, 124, 308, and 153 cells. e) Quantification of CIP2A localization to clustered mitotic chromosome fragments following MDC1 depletion. Data represent the mean ± SEM of n = 3 independent experiments; left to right: 153, 123, 162, and 116 cells. f) Quantification of TOPBP1 localization to clustered mitotic chromosome fragments following MDC1 depletion. Data represent the mean ± SEM of n = 3 independent experiments; left to right: 136, 125, 155, and 137 cells. Source Data
Extended Data Fig. 8
Extended Data Fig. 8. CIP2A-TOPBP1 does not associate with acentric extrachromosomal DNA (ecDNA) elements.
a) DAPI-stained metaphase spreads showing abundant ecDNAs in PC3 cells but not control HeLa S3 cells. Scale bar, 5 μm. b) CIP2A and TOPBP1 are not recruited to mitotic chromosomes in PC3 cells with ecDNAs in the absence of DNA damage. Examples of untreated and irradiated PC3 and HeLa cells arrested in mitosis and immunostained for CIP2A or TOPBP1. Scale bar, 5 μm. c) Quantification of CIP2A and TOPBP1 foci in (b). Data represent the mean ± SEM; P = 0.8768 (ns) for CIP2A; from left to right, n = 24, 23, 15, and 14 mitotic cells; P = 0.1437 (ns) for TOPBP1; from left to right, n = 18, 21, 20, and 12 mitotic cells; P-values calculated by two-tailed t-test comparing non-irradiated PC3 and HeLa S3 cells. Source Data
Extended Data Fig. 9
Extended Data Fig. 9. Dispersed nuclear and cytoplasmic DNA fragments activate DNA damage signalling and inflammatory responses, respectively.
a) 53BP1 immunostaining reveals engagement of clustered (top) and dispersed (bottom) nuclear fragments by the DNA damage response. b) Frequency of cells with 53BP1-positive Y chromosomes, as determined by IF-FISH. Data represent mean ± SEM of n = 3 independent experiments; WT: 770, sg3: 735, sg4: 502 cells. c) Examples of cytoplasmic DNA foci that are positive (yellow box, see magnified inset) or negative (white box) for the nuclear membrane marker lamin B1. Scale bar, 5 μm. d) Fluorescent intensity line scan analysis between the indicated arrows depicted in (c) showing examples of cytoplasmic DNA foci with and without lamin B1. e) Proportion of cytoplasmic DNA foci with and without lamin B1 staining from (c). Pie charts represent mean; n = number of foci pooled from 2 independent experiments. f) Gene set enrichment analysis of bulk RNA sequencing of two HeLa cell populations individually transduced with two CIP2A sgRNAs (sgCIP2A) versus a non-targeting control sgRNA (sgNTC) with and without the induction of micronuclei using CENP-E/Mps1 inhibitors. Hallmark pathways with false-discovery rate (FDR) q-values < 0.25 are shown in ranked order. RNA sequencing was performed on three independent replicates per condition. g) Single-cell clonogenic growth assays showing that CIP2A KO cells, but not WT cells, are sensitive to the induction of micronuclei. Data represent mean ± SEM of n = 3 biological replicates. Source Data
Extended Data Fig. 10
Extended Data Fig. 10. Examples of balanced chromothripsis events in cancer genomes.
a) Example of a canonical chromothripsis event affecting the q-arm of chromosome 22 in liver hepatocellular carcinoma exhibiting the characteristic pattern of DNA copy number oscillations (indicated by the red arrows). b–f) Additional examples of balanced chromothripsis events detected in liver cancer (b–c), glioblastoma (d), melanoma (e), and prostate adenocarcinoma (f). g–h) Examples of balanced chromothripsis events causing inactivation of PTEN (g) and generating a TMPRSS2-ERG gene fusion (h) in prostate adenocarcinomas.
Extended Data Fig. 11
Extended Data Fig. 11. Mitotic clustering underlies distinct patterns of rearrangements following chromothripsis in micronuclei.
CIP2A-TOPBP1-mediated mitotic clustering of pulverized chromosomes from micronuclei facilitates balanced rearrangements in one of the daughter cells following mother cell division. In the absence of CIP2A-TOPBP1, pulverized fragments disperse throughout the mitotic cytoplasm and stochastically partition into both daughter cells.

References

    1. Stephens PJ, et al. Massive genomic rearrangement acquired in a single catastrophic event during cancer development. Cell. 2011;144:27–40. doi: 10.1016/j.cell.2010.11.055. - DOI - PMC - PubMed
    1. Zhang CZ, et al. Chromothripsis from DNA damage in micronuclei. Nature. 2015;522:179–184. doi: 10.1038/nature14493. - DOI - PMC - PubMed
    1. Ly P, et al. Chromosome segregation errors generate a diverse spectrum of simple and complex genomic rearrangements. Nat. Genet. 2019;51:705–715. doi: 10.1038/s41588-019-0360-8. - DOI - PMC - PubMed
    1. Umbreit, N. T. et al. Mechanisms generating cancer genome complexity from a single cell division error. Science368, eaba0712 (2020). - PMC - PubMed
    1. Kneissig, M. et al. Micronuclei-based model system reveals functional consequences of chromothripsis in human cells. eLife8, e50292 (2019). - PMC - PubMed

Publication types