Comparative Study
. 2023 May;617(7962):785-791.
doi: 10.1038/s41586-023-06053-0. Epub 2023 May 10.

A pan-grass transcriptome reveals patterns of cellular divergence in crops

Affiliations
Comparative Study

A pan-grass transcriptome reveals patterns of cellular divergence in crops

Bruno Guillotin et al. Nature. 2023 May.

Abstract

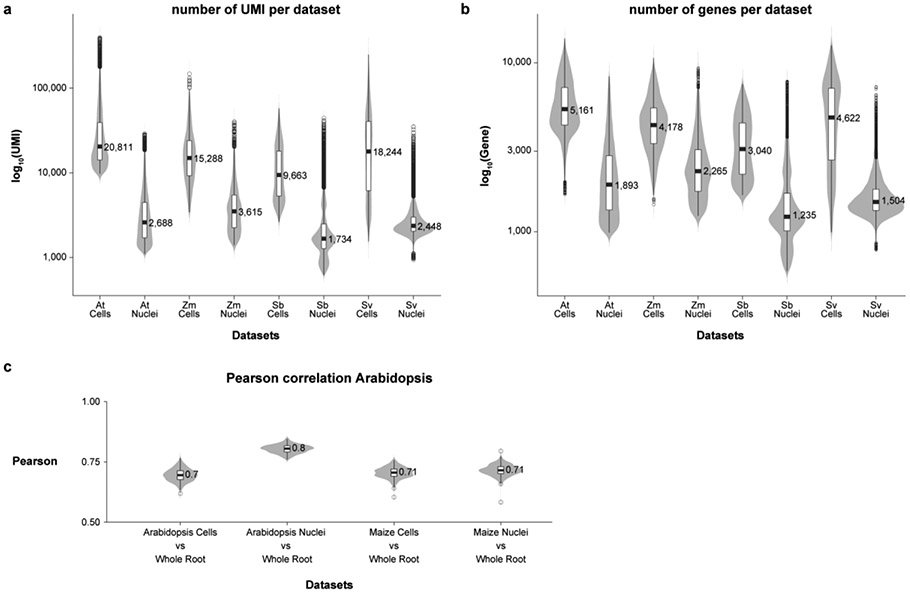
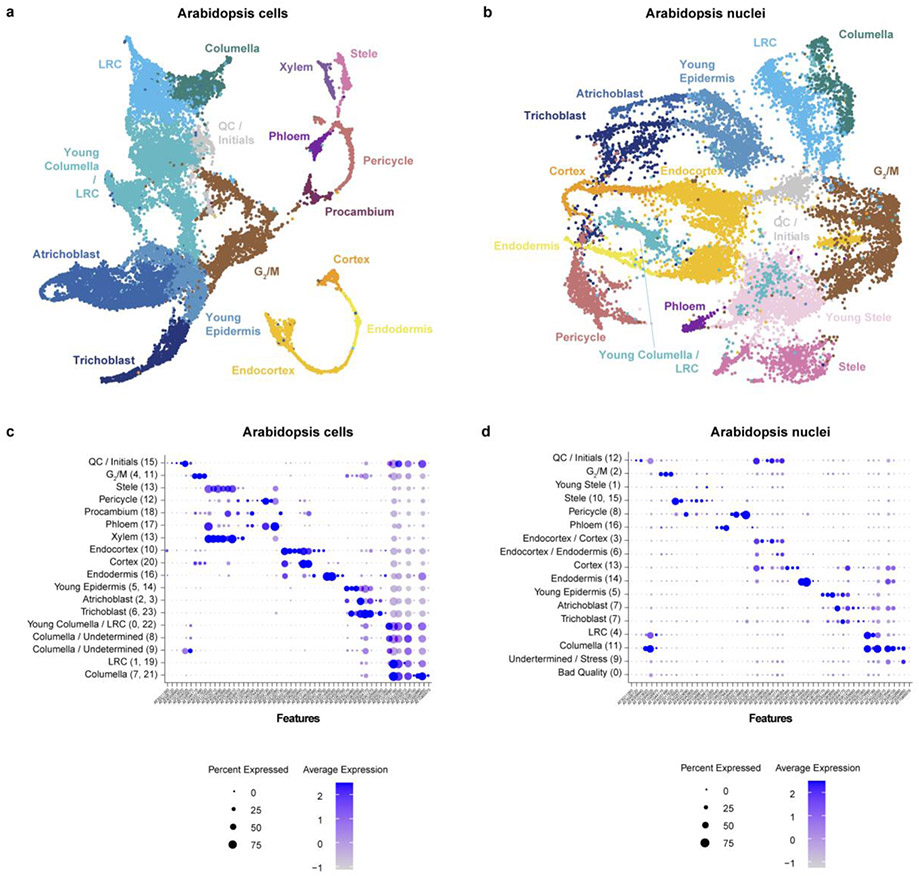
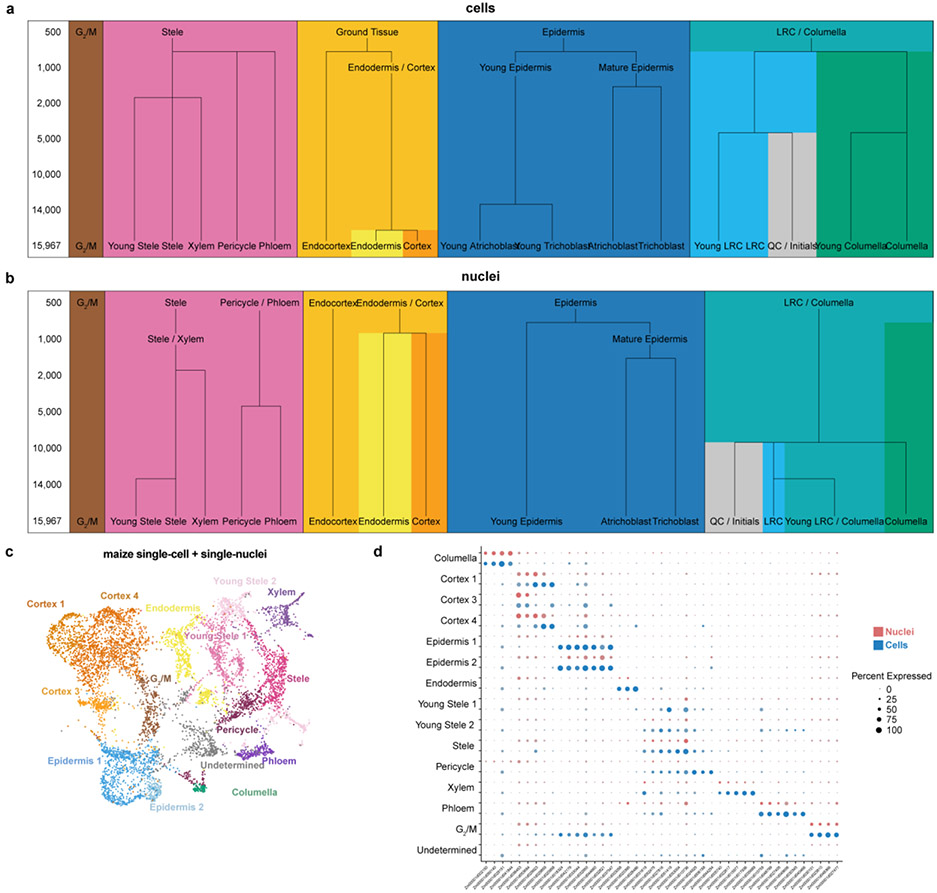
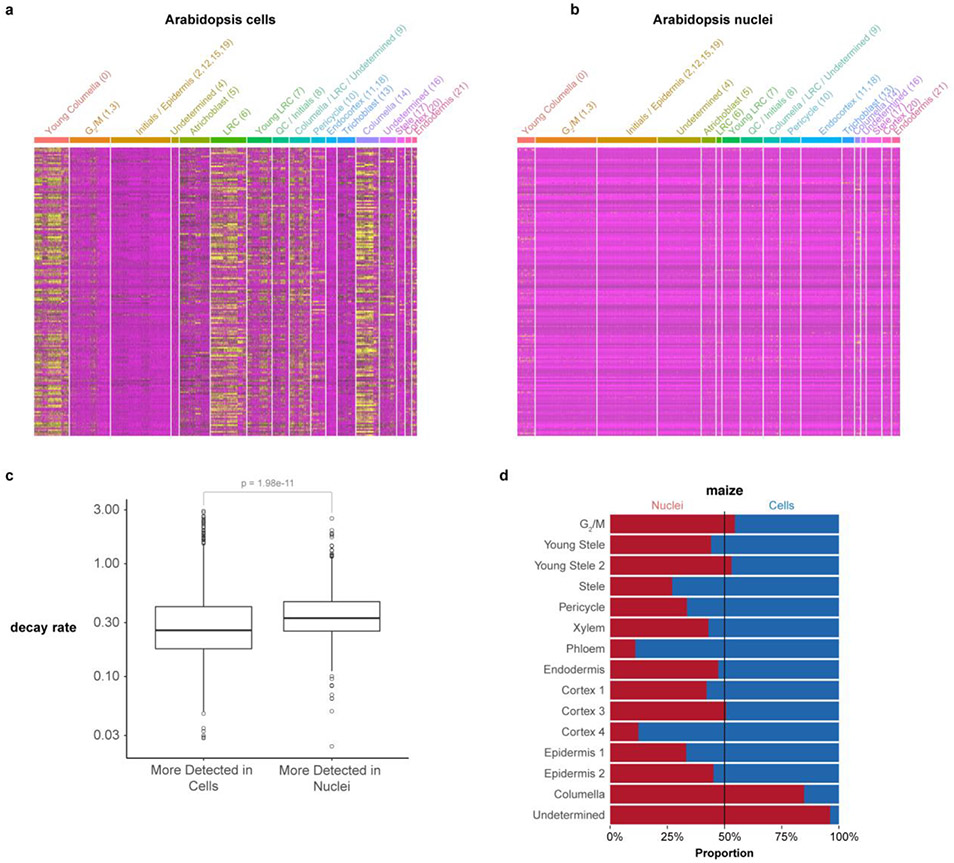
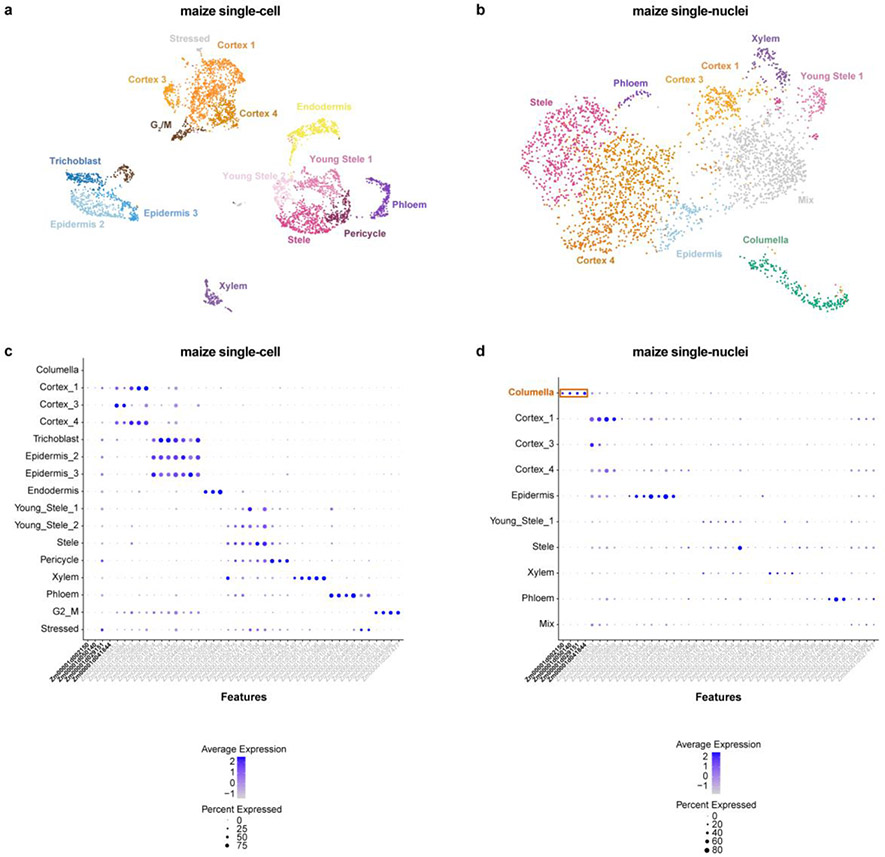
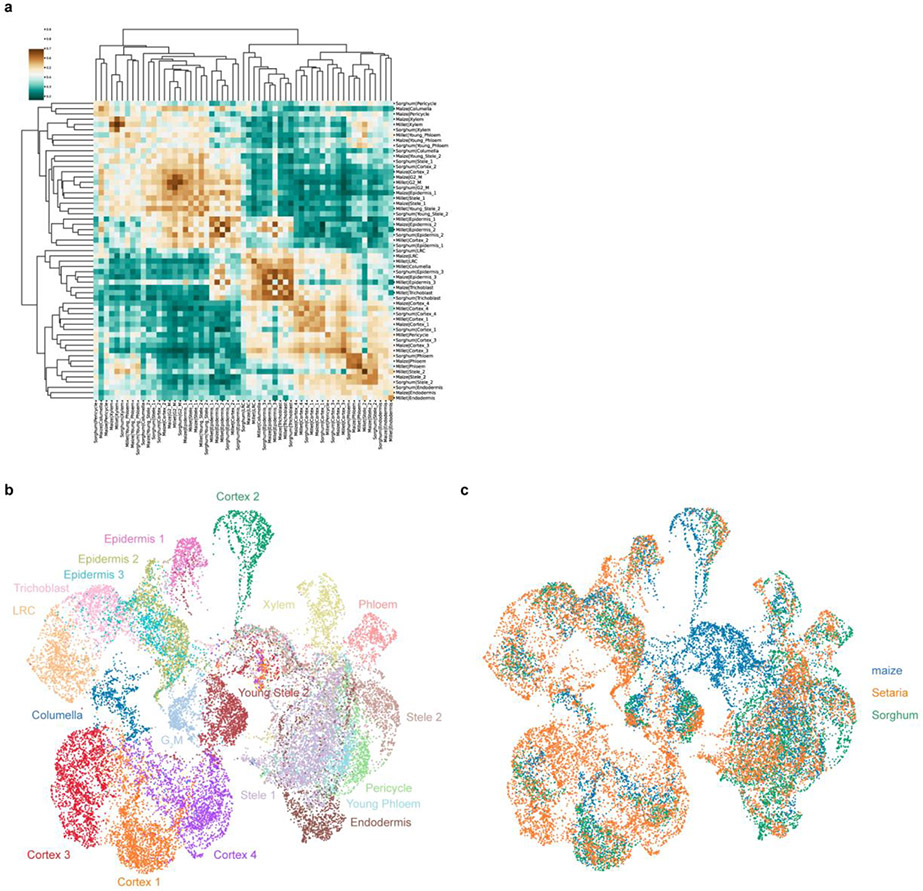
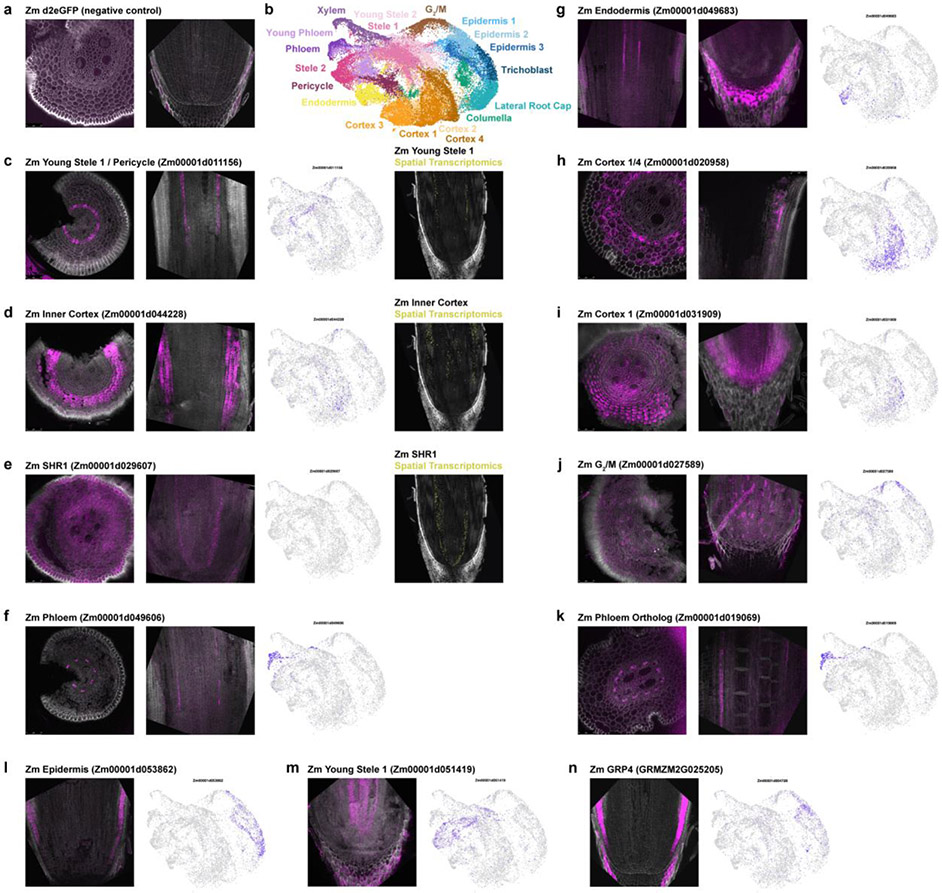
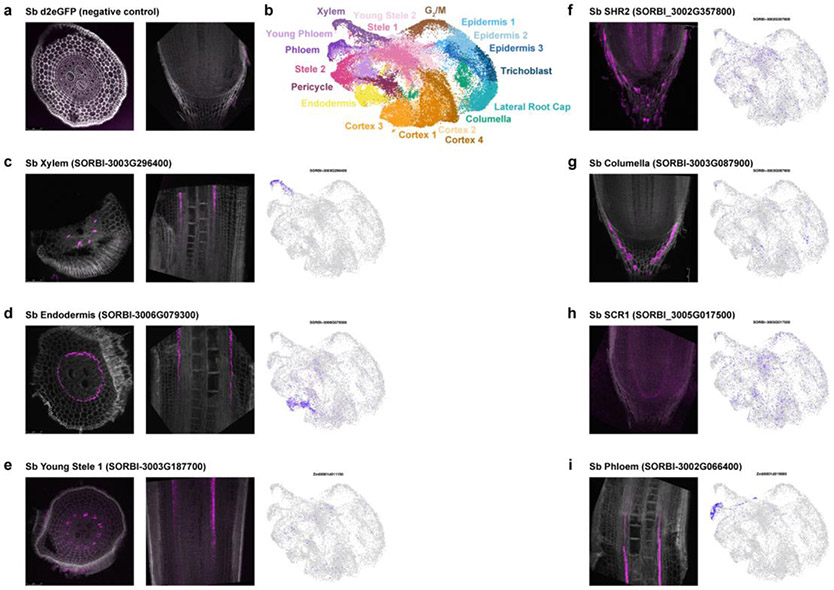
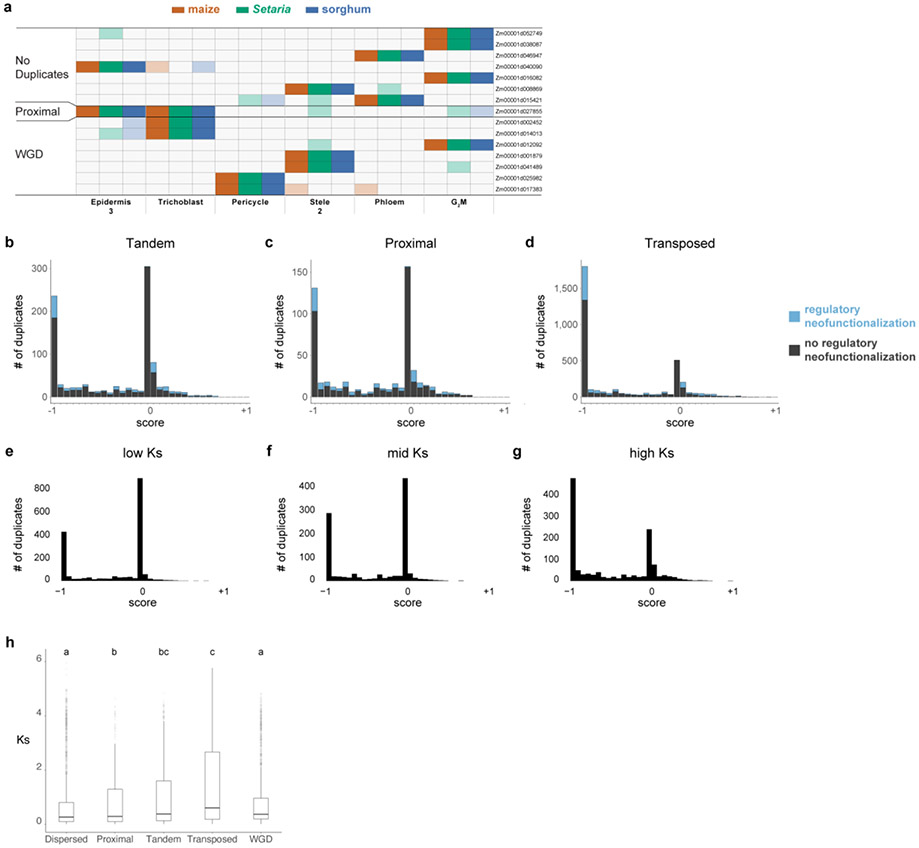
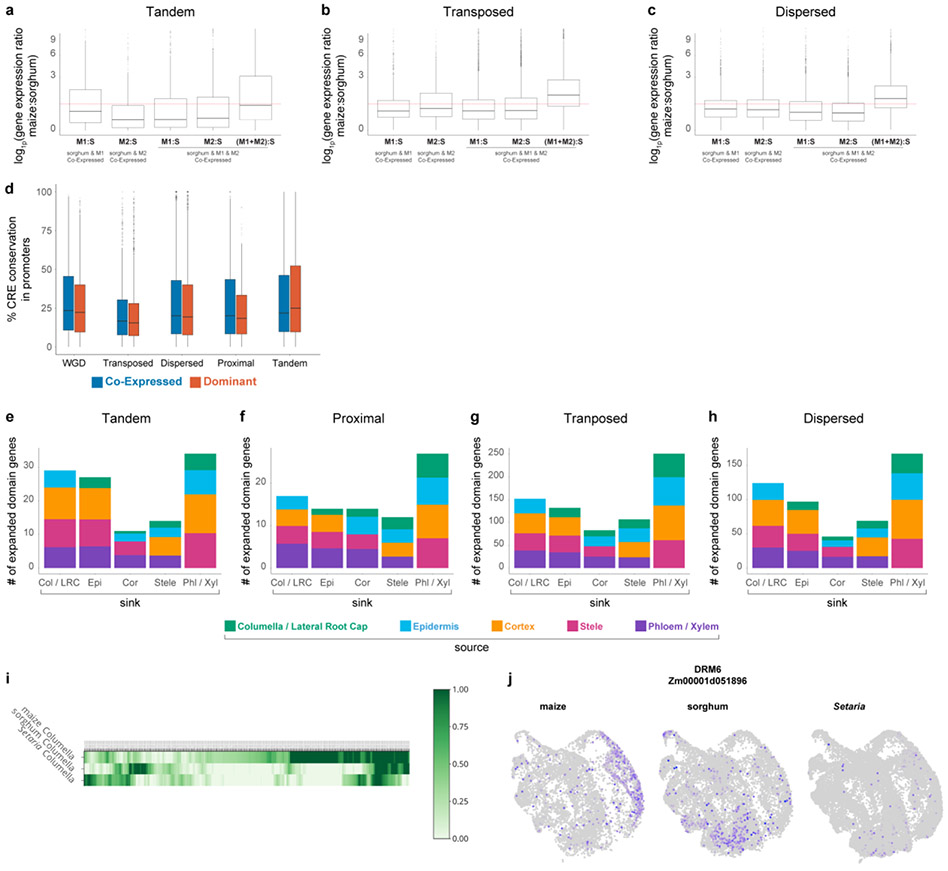
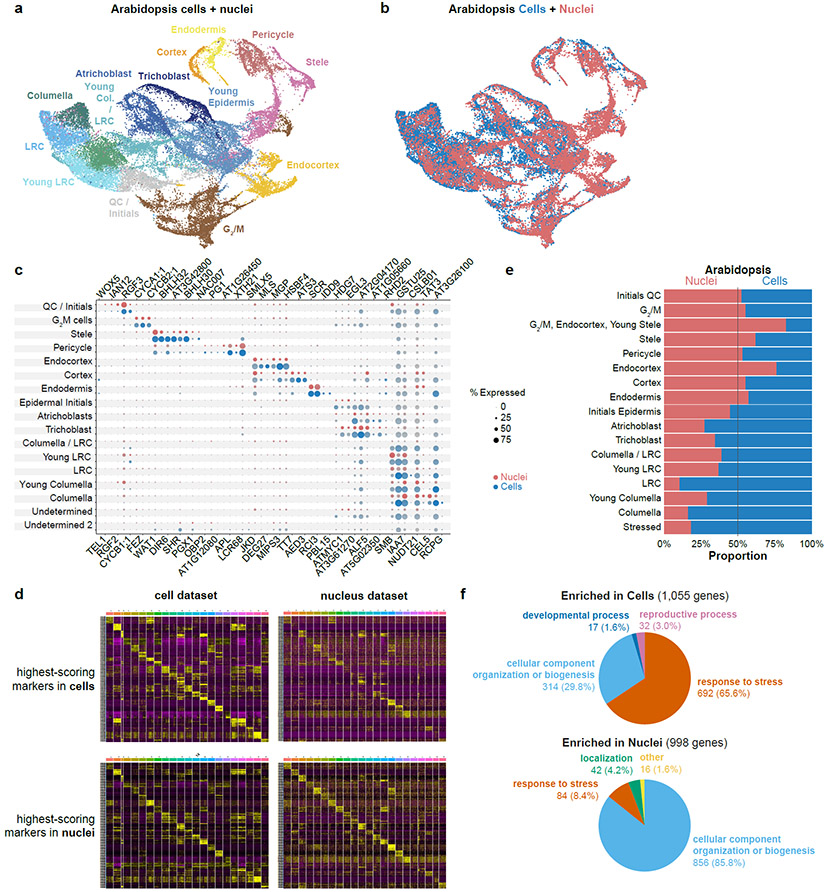
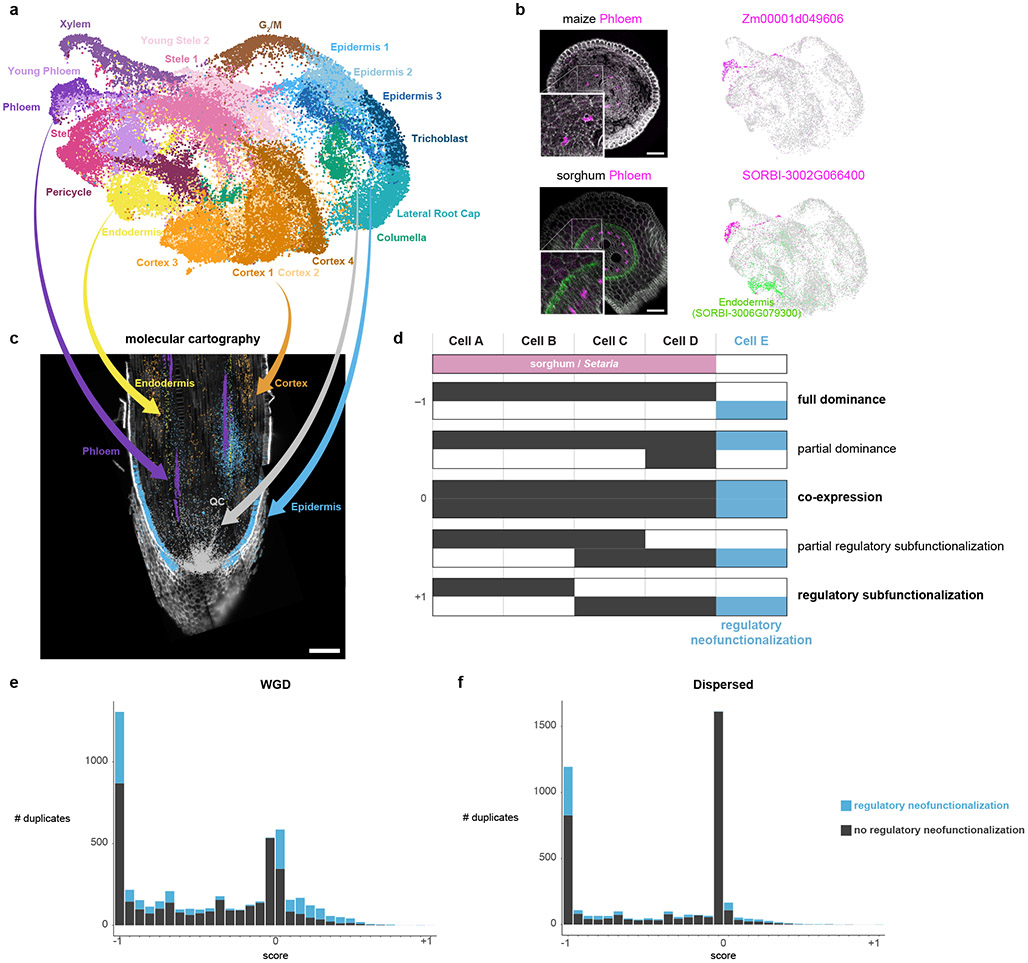
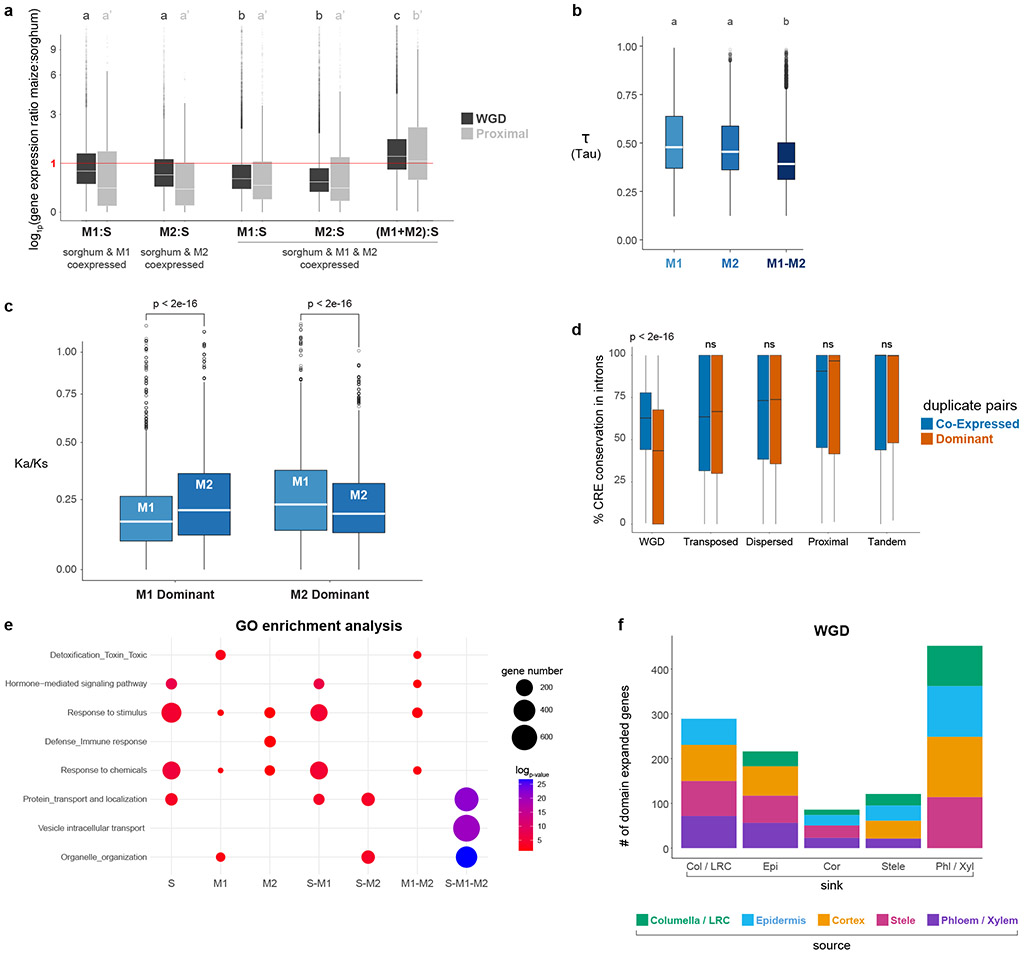
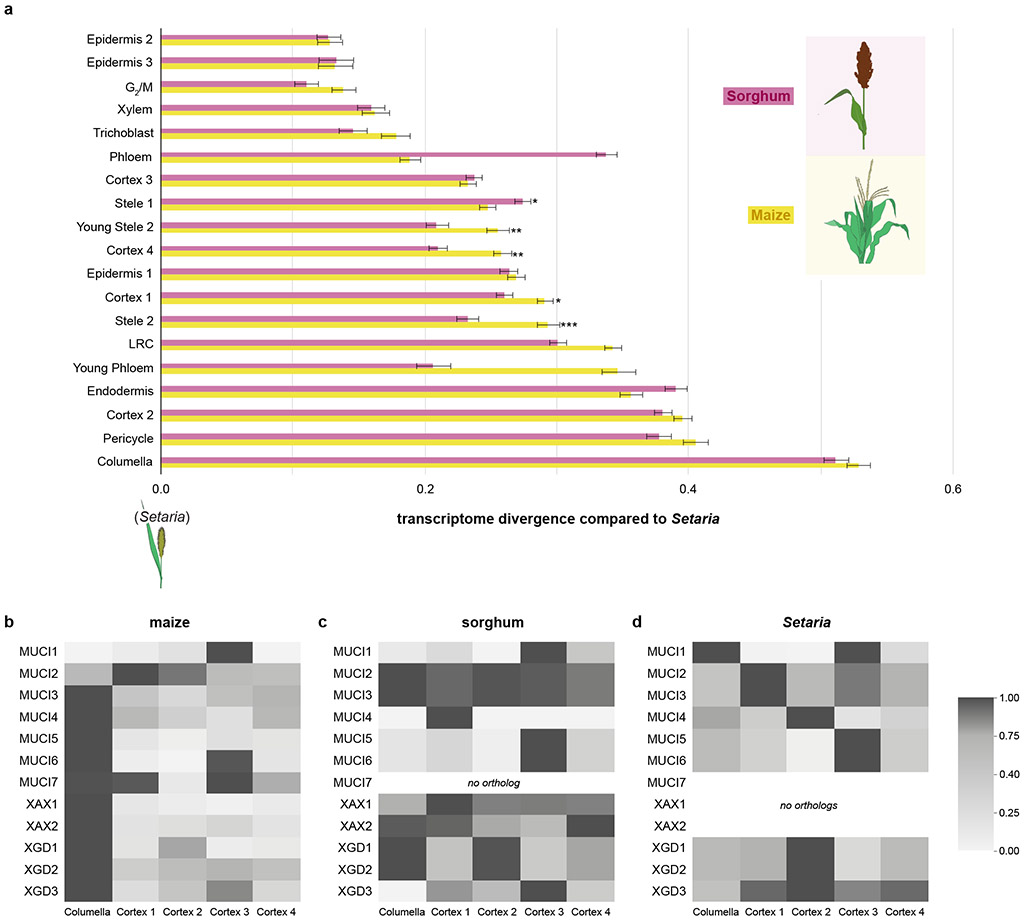
Different plant species within the grasses were parallel targets of domestication, giving rise to crops with distinct evolutionary histories and traits1. Key traits that distinguish these species are mediated by specialized cell types2. Here we compare the transcriptomes of root cells in three grass species-Zea mays, Sorghum bicolor and Setaria viridis. We show that single-cell and single-nucleus RNA sequencing provide complementary readouts of cell identity in dicots and monocots, warranting a combined analysis. Cell types were mapped across species to identify robust, orthologous marker genes. The comparative cellular analysis shows that the transcriptomes of some cell types diverged more rapidly than those of others-driven, in part, by recruitment of gene modules from other cell types. The data also show that a recent whole-genome duplication provides a rich source of new, highly localized gene expression domains that favour fast-evolving cell types. Together, the cell-by-cell comparative analysis shows how fine-scale cellular profiling can extract conserved modules from a pan transcriptome and provide insight on the evolution of cells that mediate key functions in crops.


Figures

Extended Data Fig. 1:
Extended Data Fig. 1:. Quality control and fidelity analysis of RNA-seq profiles using violin plots.
a Distribution of the number of UMI detected among cells vs. nuclei. b Distribution of the number of genes detected among cells vs. nuclei. c Pearson correlation distributions of gene expression from single-cell or single-nucleus compared to whole-root RNAseq data in Arabidopsis and maize. The distributions are derived by randomly sampling 2,000 genes for correlation analysis between cells and nuclei. The random sampling was repeated 250 times to generate the distribution of correlation values. Violin plots display show the kernel probability density of the data at different values, boxplot inside display as the middle black line is the median, exact media is displayed on the graphs, the lower and upper hinges correspond to the first and third quartiles (Q1,Q3), extreme line shows Q3+1.5xIQR to Q1-1.5xIQR (interquartile range-IQR). Dots beyond the extreme lines shows potential outliers.
Extended Data Fig. 2:
Extended Data Fig. 2:. Evaluation of agreement in nuclear and cell type profiles.
a, b UMAP clustering in Arabidopsis single-cells (a) and single-nuclei (b) clustered independently, showing clusters with the same diagnosed cell identities. c, d Dot plots showing expression levels per cluster and expression in percent of cells of the same set of cell-type specific markers in cells (c) or nuclei (d). The markers are in the same order in both plots.
Extended Data Fig. 3:
Extended Data Fig. 3:. Analysis of sensitivity of nuclear and cell profiles in distinguishing clusters and identifying markers.
a Arabidopsis down sampling analysis shows the number of cells needed to resolve different clusters. A branch signifies that a new cluster with a known cell type identity was distinguished at a given sample size. b A similar analysis using the single nucleus RNA-seq dataset, showing that more nuclei are needed to resolve the same number of clusters compared to cells in (a). Tracking the branches of graphs in (a) vs. (b) leads to a rule-of-thumb that two-fold more nuclei than cells are needed to identify clusters. c UMAP of the combined maize single-cell and -nuclei datasets, clusters are colored by cell type identity. d Dotplot of maize marker genes in cells (blue) or in nuclei (red), showing overall concordance of marker gene expression in the two datasets.
Extended Data Fig. 4:
Extended Data Fig. 4:. Analysis of differentially regulated genes and cell capture efficiency in nuclear vs. cellular profiles.
a, b Heatmaps of genes known to be induced by protoplast generation (Birnbaum et al., 2003) showing their expression in cells (a) vs. nuclei (b). The analysis shows that stress-induced genes also have higher expression in cells vs. nuclei, with a bias in specific cell types. c Distribution of expression levels of genes annotated for mRNA decay in cells or in nuclei, decay values from Sorenson et al., 2018. A significant increase in expression of mRNA decay-related genes was detected in nuclei, (n=1965 genes, Wilcoxon rank sum test, two-sided, p-value = 1.98e-11), the boxplots display the middle line is the median, the lower and upper hinges correspond to the first and third quartiles (Q1,Q3), extreme line shows Q3+1.5xIQR to Q1-1.5xIQR (interquartile range-IQR). Dots beyond the extreme lines shows potential outliers. d Proportion of cells vs nuclei present in each cell type cluster.
Extended Data Fig. 5:
Extended Data Fig. 5:. Analysis of marker gene identification in maize single nucleus vs. cell profiles.
a, b UMAPs of maize single-cell and single-nucleus RNA-seq data clustered independently. Only the single nucleus RNA-seq dataset displays a cluster annotated as columella, which is absent in the single-cell dataset. c, d Dotplot of maize marker genes for each cell type cluster, showing expression in cells (c) and in nuclei (d) datasets independently. Markers for columella outlined in the red box are only present in the single nucleus dataset.
Extended Data Fig. 6:
Extended Data Fig. 6:. Analysis of overall expression similarity among all cellular and nuclear clusters in the three monocot species studied.
a AUROC test comparing every cell type in all species for both cell and nuclei datasets, showing that clusters discovered in either cell or nuclei group by like cell type and not by either species or source of material (cells or nuclei). b-c UMAPs generated by additional integration of the dataset using a Python supervised integration method scGen. This method uses a variational autoencoder to learn the underlying latent space for the cell types. b Different colors represent the clusters identified by the Seurat integration mapped onto the new scGen integration, showing Seurat classification was in relative agreement with the scGen classification. i.e., scGEN clusters have relatively homogenous coloration. c The same UMAP as in (b), this time showing the species distribution. Overall, each cluster has cells from each of the three species.
Extended Data Fig. 7:
Extended Data Fig. 7:. In-situ hybridization corroborating evidence for marker localization in single cell/nuclei RNA-seq profiles in maize.
a-n in situ hybridization using Hairpin Chain Reaction (HCR) probes labeling various transcripts. Cross sections are on the left and longitudinal sections are on the right. UMAPs showing each transcript’s cluster localization are displayed next to each probe’s fluorescent image. Additionally, spatial transcriptomics imaging data of the same probe is shown in the right column for (c-e). The minimum/maximum values for each fluorescence channel (grey: autofluorescence, magenta: HCR probes) have been adjusted to show the localization more clearly in the merged image.
Extended Data Fig. 8:
Extended Data Fig. 8:. In-situ hybridization corroborates evidence for localization of marker gene expression from single-cell RNA-seq profiles in sorghum.
a-i In situ hybridization using Hairpin Chain Reaction (HCR) probes labeling various transcripts. Cross sections are on the left and longitudinal sections on the right (a,c,d,e). Longitudinal sections are shown in (f,g,h,i). UMAPs showing each transcript’s cluster localization are shown next to each probe’s fluorescent image. The minimum/maximum values for each fluorescence channel (grey: autofluorescence, magenta: HCR probes) have been adjusted to show the localization more clearly in the merged image.
Extended Data Fig. 9:
Extended Data Fig. 9:. Regulon conservation across species, and distribution of gene pair expression patterns.
a Conserved regulons found using MINI-EX and their pattern of expression. The regulon is labeled by the transcription factor that putatively regulates it in each row. b-d Distribution of genes pairs on the dominance vs. regulatory subfunctionalization scale for transposed, tandem and proximal duplicate pairs. In blue, neofunctionalized duplicates are shown as a percentage of the bar. e-g Distribution on the dominance to regulatory subfunctionalization scale for dispersed gene duplicate pairs binned in thirds by their Ks value. The graphs suggest that duplicates tend to lose co-expressed patterns and gain dominance over time. h Boxplot of Ks values showing the distribution among all the duplicate classes used in the analysis. In h, statistical analysis was performed using a Kruskal-Wallis one-way ANOVA followed by the Tukey test for all pairwise comparisons. Not sharing a letter represents statistical significance at p < 0.05. In boxplots the middle line is the median, the lower and upper hinges correspond to the first and third quartiles (Q1,Q3), extreme line shows Q3+1.5xIQR to Q1-1.5xIQR (interquartile range-IQR). Dots beyond the extreme lines shows potential outliers. h. n=10,104 WGD, n=860 Proximal, n=3,154 Transposed, n=7,552 Dispersed, n=1,448 Tandem.
Extended Data Fig. 10:
Extended Data Fig. 10:. Overall analysis of expression conservation in duplicate classes and analysis of columella expression across species.
a-c Dosage compensation analysis representing the expression ratios of maize over sorghum orthologous genes in tandem, transposed, and dispersed duplicate pairs. The first two boxplots represent cases in which a sorghum ortholog is expressed in the same homologous cell type as only a single maize duplicate (either M1 or M2). The third and fourth boxplots represent cases in which both homeologs are expressed in the same cell and a sorghum homolog is expressed in a homologous cell type. The last boxplot shows the ratio when both of the co-expressed homeologs are added together in the numerator, showing a mean ratio close to 1. The higher expression in the first two boxplots compared to the second two indicates dosage compensation. d Conservation rate of cis-regulatory elements between WGD homeolog pairs in promoters. The plot shows no major differences between co-expressed and dominant gene pairs, and no major differences among the different classes of duplication. e-h Distribution of maize genes displaying regulatory neofunctionalization of expression into new cell types. Colors signify the cell type of origin. i Heatmap of maize columella markers, with the orthologous gene expression in the maize cluster of the other two species. j Example of the gene DMR6 switching its expression between columella in maize to epidermis / cortex in sorghum. a-c, statistical analysis was performed using ANOVA followed by the Tukey test for all pairwise comparisons, Not sharing a letter represents statistical significance at p < 0.05. In boxplots the middle line is the median, the lower and upper hinges correspond to the first and third quartiles (Q1,Q3), extreme line shows Q3+1.5xIQR to Q1-1.5xIQR (interquartile range-IQR). Dots beyond the extreme lines shows potential outliers. a-h: n=10,104 WGD, n=860 Proximal, n=3,154 Transposed, n=7,552 Dispersed, n=1,448 Tandem.
Fig. 1:
Fig. 1:. Cell and nucleus profiles identify the same markers but show different sensitivities and artifacts.
a, b UMAP of combined Arabidopsis cells and nuclei with clusters colored according to assigned cell identity (a) or cell vs. nuclei origin (b). c Dot plots of Arabidopsis marker genes in cells (blue) or nuclei (red), showing all the cell types defined from clusters in this study. d Heatmaps of the 10 highest-scoring marker genes for each cell type found using Seurat. Upper row shows highest scoring markers found in the single-cell dataset (left) with their expression in the single nucleus dataset shown (right). Lower row shows highest-scoring markers found in single nucleus dataset (left) and their expression in the single cell dataset (right). e Proportion cells vs nuclei present in each cell type cluster. f Pie charts showing the difference in the prevalence of Gene Ontology (GO) terms among differentially expressed genes in each cluster between cells (top) vs. nuclei (bottom).
Fig. 2:
Fig. 2:. Mapping cell identities from maize to sorghum and gene duplicate analysis.
a UMAP of combined maize cell and nucleus profiles. Clusters are colored and labeled according to cell identity. b In-situ hybridization in maize (top) and sorghum (bottom). The maize phloem marker is orthologous to the sorghum phloem marker. Cyan coloration in the lower panel corresponds to a sorghum endodermal marker that highlights the stele boundary. The minimum/maximum values for each channel in the fluorescence images have been adjusted to show the localization more clearly in the merged image. UMAPs next to images show the respective expression of each gene in the maize-sorghum co-clustered single-cell profiles, which were used initially to determine their expression pattern. c Molecular Cartography, which allows simultaneous hybridization of multiple probes to a tissue section, here showing markers used for the cell-cluster annotation of clusters in maize. d Conceptual schematic of hypothetical expression patterns between duplicate gene pairs following a metric with a scale ranging from full dominance (−1) to equal co-expression (0) to regulatory subfunctionalization (1). Example intermediate states are also shown. Blue shows regulatory neofunctionalization. e-f Distribution of duplicate gene expression patterns using the metric described in (d) for WGD homeologs (e) and dispersed duplicate (f) pairs having similar with median Ks. Number of genes: 10,104 (WGD homeologs); 7,552 (dispersed duplicates).
Fig. 3:
Fig. 3:. Detection of dosage compensation and cellular destination of regulatory neofunctionalized genes.
a Dosage compensation analysis with expression ratios of maize over sorghum orthologous genes in the two duplication classes. The first two boxplots represent cases where a sorghum ortholog is expressed in the same cell type as a single maize homeolog (either M1 or M2). The third and fourth boxplots represent cases in which both homeologs are expressed in the same cells. The last boxplot shows the ratio when both of the co-expressed homeologs are added in the numerator over sorghum expression level in the denominator. Dosage compensation is inferred from a pattern in which lone expression of a homeolog is higher than co-expressed homeologs. b Tau (τ) value reflecting degree of cell specificity in different expression categories within a cell, if M1 or M2 is dominant or if M1 and M2 are co-expressed. c Ka/Ks distribution of WGD homeologs, when either M1 or M2 is dominant in a cell type they display stronger purifying selection than the non-dominant homeolog. d Cis-regulatory element conservation rate between duplicate pairs in introns split into co-expressed and dominant categories. e GO-terms enriched within each category expression category. S, M1, M2 = unique expression of the sorghum ortholog or one maize homeolog. S-M1 or S-M2 = one maize homeolog expressed in the same cell type as the sorghum ortholog. S-M1-M2 = both homeologs expressed in the same cell type as the sorghum ortholog. f Regulatory neofunctionalized genes categorized by their new expression domains. Colors within a bar graph show their ancestral cell-type domain (Methods). In a-d, n=10,104 WGD, n=860 Proximal, n=3,154 Transposed, n=7,552 Dispersed,n=1,448 Tandem. In a,b, statistical analysis was performed using an one-way ANOVA followed by the Tukey test for all pairwise comparisons, Not sharing a letter represents statistical significance at p < 0.05, in c Wilcoxson test, two-sided, in d, Wilcoxon signed-rank test, two-sided, with pvalue adjusted with Benjamini & Hochberg (1995) (BH). In boxplots the middle line is the median, the lower and upper hinges correspond to the first and third quartiles (Q1,Q3), extreme line shows Q3+1.5xIQR to Q1−1.5xIQR (interquartile range-IQR). Dots beyond the extreme lines shows potential outliers.
Fig. 4:
Fig. 4:. Differential divergence of cell types in maize compared to Setaria.
a MetaNeighbor analysis showing a quantification of transcriptome divergence among cell types in maize and sorghum compared to the outgroup Setaria. Statistical significance between maize and sorghum was performed using the two-sided Hanley McNeil test (Methods, p *<0.05,**<0.01,***<0.001). Error bars, s.e. b, c Mucilage gene expression heatmaps for maize (b) and sorghum (c) and Setaria (d) in their respective columella cells and cortex layers.

References

    1. Woodhouse MR & Hufford MB Parallelism and convergence in post-domestication adaptation in cereal grasses. Philos. Trans. R. Soc. B Biol. Sci 374, (2019). - PMC - PubMed
    1. Rich-Griffin C et al. Single-Cell Transcriptomics: A High-Resolution Avenue for Plant Functional Genomics. Trends Plant Sci. 25, 186–197 (2020). - PubMed
    1. Marioni JC & Arendt D How Single-Cell Genomics Is Changing Evolutionary and Developmental Biology. Annu. Rev. Cell Dev. Biol 33, 537–553 (2017). - PubMed
    1. Shafer MER Cross-Species Analysis of Single-Cell Transcriptomic Data. Front. Cell Dev. Biol 7, 175 (2019). - PMC - PubMed
    1. Kajala K et al. Innovation, conservation, and repurposing of gene function in root cell type development. Cell 184, 3333–3348.e19 (2021). - PubMed

Methods References

    1. Efroni I, Ip P-L, Nawy T, Mello A & Birnbaum KD Quantification of cell identity from single-cell gene expression profiles. Genome Biol. 16, 9 (2015). - PMC - PubMed
    1. Stuart T et al. Comprehensive Integration of Single-Cell Data. Cell 177, 1888–1902 e21 (2019). - PMC - PubMed
    1. Hafemeister C & Satija R Normalization and variance stabilization of single-cell RNA-seq data using regularized negative binomial regression. Genome Biol. 20, 296 (2019). - PMC - PubMed
    1. Hernández Coronado M et al. Repel or Repair: Plant Glutamate Receptor-Like Channels Mediate a Defense vs. Regeneration Tradeoff. SSRN Electron. J (2021). doi:10.2139/ssrn.3818443 - DOI
    1. Raju SKK, Ledford SM & Niederhuth CE DNA methylation signatures of duplicate gene evolution in angiosperms. bioRxiv 2020.08.31.275362 (2021). - PMC - PubMed

Publication types