Comparative Study
. 2023 Jun;618(7964):333-341.
doi: 10.1038/s41586-023-06054-z. Epub 2023 May 10.

Pan-cancer whole-genome comparison of primary and metastatic solid tumours

Affiliations
Comparative Study

Pan-cancer whole-genome comparison of primary and metastatic solid tumours

Francisco Martínez-Jiménez et al. Nature. 2023 Jun.

Abstract

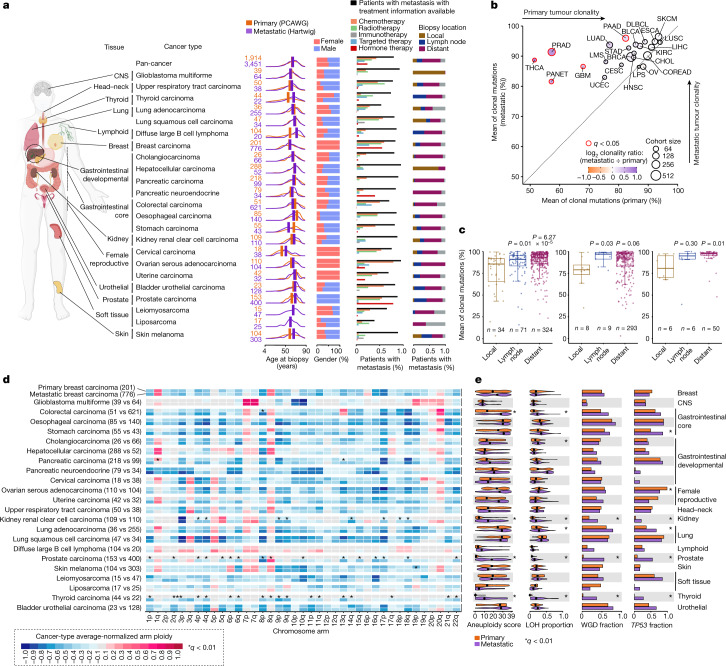
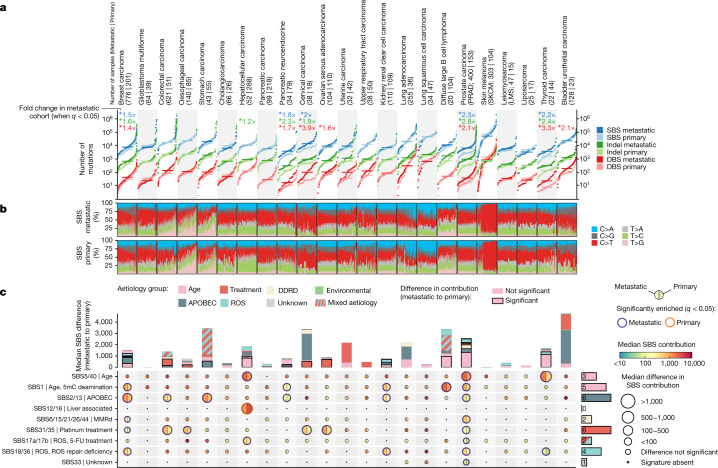
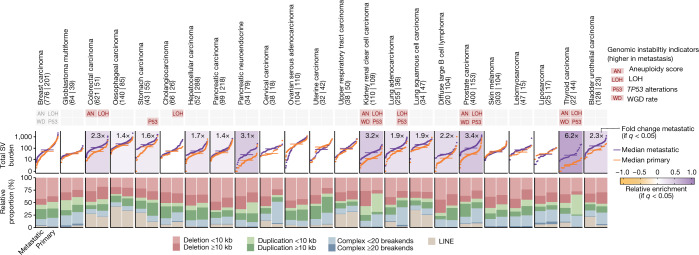
Metastatic cancer remains an almost inevitably lethal disease1-3. A better understanding of disease progression and response to therapies therefore remains of utmost importance. Here we characterize the genomic differences between early-stage untreated primary tumours and late-stage treated metastatic tumours using a harmonized pan-cancer analysis (or reanalysis) of two unpaired primary4 and metastatic5 cohorts of 7,108 whole-genome-sequenced tumours. Metastatic tumours in general have a lower intratumour heterogeneity and a conserved karyotype, displaying only a modest increase in mutations, although frequencies of structural variants are elevated overall. Furthermore, highly variable tumour-specific contributions of mutational footprints of endogenous (for example, SBS1 and APOBEC) and exogenous mutational processes (for example, platinum treatment) are present. The majority of cancer types had either moderate genomic differences (for example, lung adenocarcinoma) or highly consistent genomic portraits (for example, ovarian serous carcinoma) when comparing early-stage and late-stage disease. Breast, prostate, thyroid and kidney renal clear cell carcinomas and pancreatic neuroendocrine tumours are clear exceptions to the rule, displaying an extensive transformation of their genomic landscape in advanced stages. Exposure to treatment further scars the tumour genome and introduces an evolutionary bottleneck that selects for known therapy-resistant drivers in approximately half of treated patients. Our data showcase the potential of pan-cancer whole-genome analysis to identify distinctive features of late-stage tumours and provide a valuable resource to further investigate the biological basis of cancer and resistance to therapies.


Conflict of interest statement

The authors declare no competing interests.

Figures

Fig. 1
Fig. 1. Database overview and global genomic features.
a, Anatomical location of the 23 cancer types, ordered by tissue or origin, included in this study. From left to right: sample size, age at biopsy, gender, treatment type and biopsy site of the cohort with metastatic tumours. CNS, central nervous system. The image in a was created using BioRender (https://biorender.com). b, Mean percentage of clonal mutations in primary (x axis) and metastatic (y axis) tumours. The dots are coloured according to the log2 of the clonality ratio (metastatic divided by primary). The size of the dots is proportional to the total number of samples (primary and metastatic). The red edge lines represent a two-sided Mann–Whitney adjusted P < 0.05. BLCA, bladder urothelial carcinoma; BRCA, breast carcinoma; CESC, cervical carcinoma; CHOL, cholangiocarcinoma; COREAD, colorectal carcinoma; DLBCL, diffuse large B cell lymphoma; ESCA, oesophageal carcinoma; GBM, glioblastoma multiforme; HNSC, upper respiratory tract carcinoma; KIRC, kidney renal clear cell carcinoma; LIHC, hepatocellular carcinoma; LMS, leiomyosarcoma; LPS, liposarcoma; LUAD, lung adenocarcinoma; LUSC, lung squamous cell carcinoma; PAAD, pancreatic carcinoma; PANET, pancreatic neuroendocrine tumour; PRAD, prostate carcinoma; OV, ovarian serous adenocarcinoma; SKCM, skin melanoma; STAD, stomach carcinoma; THCA, thyroid carcinoma; UCEC, uterine carcinoma. c, Tumour clonality according to the metastatic biopsy location in breast (left), colorectal (middle) and oesophageal (right) carcinomas. n Refers to the number of samples. P refers to Mann–Whitney two-sided P value. For boxplots, the centre line indicates the median; the box limits denote the first and third quartiles; and the whiskers indicate the lowest or highest data points at the first quartile minus or plus 1.5× the interquartile range. d, Heatmap representing the normalized mean chromosome arm ploidy gains and losses relative to the expected 2n ploidy status in primary (top) and metastatic (bottom) tumours. *Adjusted P < 0.01 (two-sided Mann–Whitney). e, Comparison of four genomic instability indicators between primary (top) and metastatic (bottom) tumours. From left to right: aneuploidy score from ref. , the proportion of genome undergoing LOH, and the fraction of samples bearing whole-genome duplication (WGD) and TP53 alterations. The black dots represent the median values. *Adjusted P < 0.01 using two-sided Fisher’s exact test for WGD and TP53, and two-sided Mann–Whitney test for the continuous features.
Fig. 2
Fig. 2. TMB and mutational processes.
a, Cumulative distribution function plot (samples were ranked independently for each variant type) of TMB for each cancer type for SBS (blue), IDs (green) and DBS (red). The horizontal lines represent median values. The fold-change labels are included only when two-sided Mann–Whitney comparison renders a significant adjusted P < 0.05. b, SBS mutational spectra of patients with metastatic (top) and primary (bottom) tumours. Patients are ordered according to their TMB. DDRD, DNA damage repair deficiency; ROS, reactive oxygen species. c, Moon plot representing the SBS mutational burden differences attributed to each mutational signature in metastatic (main plot, left) and primary (main plot, right) tumours. The edge thickness and colours represent significant differences (two-sided Mann–Whitney adjusted P < 0.05, ±1.4× fold change) and the direction of the enrichment, respectively. The size of the circles are proportionate to the mutation burden difference. The bars on the right indicate the number of metastatic cancer types with a mutational signature with significant enrichment. The top stacked bars represent the cumulative signature exposure difference. The thicker bar edge lines represent significance. Bars are coloured according to the annotated aetiology. Only mutational signatures with known aetiology or with at least one cancer type with significant metastatic enrichment are included. 5-FU, 5-fluorouracil; 5mC, 5-methylcytosine; MMRd, mismatch repair deficiency.
Fig. 3
Fig. 3. SV burden.
The top rectangles represent the four genomic instability features defined in Fig. 1e. The red background represents significant enrichment in the metastatic cohort (two-sided Mann–Whitney adjusted P < 0.01). S-plots and cumulative distribution function plots (samples ranked independently for each SV type) of the aggregated SV burden for each cancer type. The horizontal lines represent median values. Backgrounds are coloured according to the relative enrichment, defined as: log10(median SV-type burden in metastatic tumours + 1) − log10(median SV-type burden in primary tumours + 1). Fold-change labels and coloured backgrounds are displayed when Mann–Whitney comparison renders a significant q < 0.05. Fold-change labels are displayed with ‘>’ when the SV burden for primary tumours is 0 (see Methods for more details). For each cancer type, the bottom bar plots represent the relative fraction of each SV type in the metastatic (left) and primary (right) datasets. LINE, long interspersed nuclear element.
Fig. 4
Fig. 4. Driver alterations in primary and metastatic tumours.
a, Cancer-type-specific distribution of the number of driver alterations per patient in primary (top) and metastatic (bottom) tumours. The black dots represent the mean values. Labels display mean differences (metastatic to primary) in cancer types with a significant difference (two-sided Mann–Whitney adjusted P < 0.01). b, Heatmap representing the cancer genes displaying significant mutational frequency differences between primary and metastatic tumours (two-sided Fisher’s exact test adjusted P < 0.01). Circles denote mutation frequency enrichment in both cohorts, whereas triangles facing upwards and downwards represent drivers that are exclusively enriched in metastatic and primary cohorts, respectively. Colours represent the direction of the enrichment.
Fig. 5
Fig. 5. TEDs.
a, Workflow representing the number of treatment groups in each step of the analysis. For the external layers of the pie chart, the number of treatments with identified TEDs is coloured by cancer type. For the internal layers of the pie chart, the category of the corresponding treatment is shown. n Refers to the number of treatment groups with at least one TED. MSS, microsatellite stable; TNB, triple negative breast cancer. b, Volcano plots displaying the identified TEDs. Each dot represents one cancer gene alteration type in one treatment group. The x axis displays the effect size (as log2(odds ratio)) and the y axis shows the significance (−log10(q value)). The circle markers denote TEDs exclusively mutated in the treatment group (squared makers are used otherwise). Markers are coloured according to the type of alteration. The thicker edge lines indicate known resistance drivers. CNA, copy number alteration; UTR, untranslated region. c, Global proportion of patients with TEDs treated for metastasis. d, Mean number of driver alterations per patient with a metastatic tumour before (purple circle) and after (purple square) excluding TEDs compared with patients with primary tumours (orange square). The vertical lines indicate s.d. The mean number of driver alterations are labelled. n Metastatic and n primary denote the number of metastatic and primary samples, respectively.
Extended Data Fig. 1
Extended Data Fig. 1. Cohort overview and global genomic features.
a) Workflow of the unified processing pipeline used in this study for Hartwig (left) and PCAWG (right) WGS samples. First, PCAWG tumor and matched normal raw sequencing files were gathered and re-processed using the Hartwig tumor analytical pipeline. Next, the output of tumor samples that were correctly processed by the pipeline were further subjected to a strict quality control filtering. As a result, a total of 7,108 samples from 71 cancer types compose the harmonized dataset. 5,365 patient tumor samples from 23 cancer types with sufficient representation in both primary and metastatic datasets were selected for this study. b) Tumor clonality according to the metastatic biopsy location in kidney renal clear cell carcinoma, lung adenocarcinoma, prostate carcinoma and skin melanoma. N, number of samples in the group. p, two-sided Mann-Whitney p-value. Box-plots: center line, median; box limits, first and third quartiles; whiskers, lowest/highest data points at first quartile minus/plus 1.5× IQR. c) Left, similar to Fig. 1d only including non-WGD tumors. Right, similar to Fig. 1e for non-WGD tumors. d) Equivalent to c), but limited to WGD tumors. ‘*’, two-sided Mann-Whitney adjusted p-value < 0.01 for continuous variables and two-sided Fisher’s exact test adjusted p-value < 0.01 for TP53.
Extended Data Fig. 2
Extended Data Fig. 2. Mutation burden and mutational signatures.
a) double-base substitutions (DBSs, top) and indels (IDs, bottom) mutational spectra of metastatic and primary tumors. Patients are ordered according to their TMB burden. b) Moon plot representing the DBS burden differences attributed to each mutational signature in metastatic (left) and primary (right) tumors. Edge thickness and colors represent significant differences (Mann-Whitney adjusted p-value<0.05, ±1.4x fold change) and the direction of the enrichment, respectively. The size of circles are proportionate to the mutation burden difference. Right bars, number of metastatic cancer types with a mutational signature significant enrichment. Top stacked bars represent the cumulative signature exposure difference. Thicker bar edge lines represent significance. Bars are coloured according to the annotated etiology. Only mutational signatures with known etiology or with at least one cancer type with significant metastatic enrichment are included. c) analogous representation for IDs. d) Volcano plot representing the mutational signature hypermutation (>10,000 mutations for SBS, >500 for DBS, and >1000 for ID) prevalence comparison between primary and metastatic tumor patients. Y-axis, log10(two-sided Mann-Whitney adjusted p-value). X-axis, effect size as Cramer’s V. Each dot represents a mutational signature in a cancer type. Dots are coloured according to the mutation type. Diff., difference. Muts. mutations. Sig., mutational signature. Mut. mutational. Susp., suspected. Def., deficiency.
Extended Data Fig. 3
Extended Data Fig. 3. Mutational signature relative contribution comparison.
a) From top to bottom, moon plot representing the SBS, DBS and ID relative contribution differences attributed to each mutational signature. The size of circles are proportional to the relative mutation burden difference. Top stacked bars represent the relative signature exposure difference. Thicker bar edge lines represent significance (two-sided Mann-Whitney adjusted p-value < 0.05 and ≥1% difference in relative contribution). Bars are coloured according to the annotated etiology. Right bars, number of metastatic cancer types with a mutational signature significant enrichment. Only mutational signatures with known etiology or with at least one cancer type with significant enrichment are included. Diff., difference. Muts. mutations. Sig., mutational signature. Mut. mutational. Susp., suspected. Def., deficiency.
Extended Data Fig. 4
Extended Data Fig. 4. Age-corrected SBS1 mutation burden in primary and metastatic tumors.
a) Linear regression of the SBS1 mutation burden (y-axis) and patient’s age at biopsy (x-axis) in primary and metastatic cancer across the 23 cancer types. The median trendline and 99% confidence intervals of the linear regression are represented as a solid line and the adjacent shaded area, respectively. The mean fold change, mean SBS1 increase per year and one sided Mann-Whitney p-value are only displayed in cancer types with an age-independent significantly different primary and metastatic distribution. Red labels, significant increase in metastatic tumors. Blue, control cancer types. Rmet and Rprim, Pearson correlation coefficient of the metastatic and primary linear regressions, respectively. b) Analogous representation for independent linear regressions for breast cancer subtypes. c) Relative to a) for ploidy corrected SBS1 in the tumor types of interest. d) Relative to a) for ploidy corrected SBS5/40 counts in the tumor types of interest. e) Depiction illustrating the potential effect of an increased cell division rate in metastatic tumors compared to primary and its expected impact on the SBS1 variant allele frequency (VAF) distribution. Partially created BioRender.com. f) Comparison of global SBS1 clonality ratios between primary and metastatic in breast, prostate, kidney renal clear cell, thyroid, colorectal and ovarian serous carcinomas. Boxplots are defined as in Fig. 1. P, two-sided Mann-Whitney p-value. N, number of samples. g) Spearman correlation analysis of the mean SBS1 year burden of primary tumors (y-axis) and the mean metastatic SBS1 fold change (x-axis) across the 15 cancer types with linear association between age and SBS1 accumulation. Vertical error bars represent the 25th and 75th percentile, respectively. Horizontal error bars represent the standard deviation of the mean fold change (metastatic divided by primary) of the SBS1 yearly mutation burden. The median trendline and 99% confidence intervals of the linear regression are represented as a solid line and the adjacent shaded area, respectively. Cancer types with a significantly different SBS1 mutation rate are marked by thicker marker borders and with red labels. Blue labels represent the control cancer types. h) Similar but using SBS1 year mutation rate from ref. . To derive vertical and horizontal error bars in panels g) and h) all tumor samples from the primary and metastatic cohorts from panel a) (see Methods for inclusion criteria) were included in the analysis. The number of included samples per cancer type and cohort are available in Supplementary Table 4. Muts, mutations.
Extended Data Fig. 5
Extended Data Fig. 5. Structural variant burden.
a) Top rectangles represent the four genomic instability features defined in Fig. 1e. A red background represents significant enrichment in the metastatic cohort (two-sided Mann-Whitney adjusted p-value <0.01). S-plots, cumulative distribution function plot (samples ranked independently for each SV type) of tumor mutation burden for each cancer type for (from top to the bottom) the aggregated structural variant (SV) burden, small deletions (<10kb), large deletions (>=10kb), small duplications (<10kb), large duplications (>=10kb), complex events (<20 breakpoints), complex events (>=20 breakpoints) and LINEs insertions. Horizontal lines represent median values. Backgrounds are coloured according to the relative enrichment, defined as: log10(median SV type burden in metastatic tumors + 1) − log10(median SV type burden in primary tumors + 1). Fold change labels and coloured backgrounds are displayed when Mann-Whitney comparison renders a significant q-value < 0.05. Fold change labels are displayed with ‘>’ when the SV burden for primary tumors is 0 (see Methods for more details). For each cancer type, bottom bar plots represent the relative fraction of each SV type in the metastatic (left) and primary (right) datasets. b) SV length frequency distribution of deletions (left panel) and duplications (middle panel). Right panel shows the frequency distribution of the number of linked breakpoints for complex SVs. Dashed vertical lines represent the chosen threshold to separate between short and large deletions, duplications and complex SVs, respectively.
Extended Data Fig. 6
Extended Data Fig. 6. Structural variant burden associated genomic features.
a) Volcano plot representing the cancer type-specific regression coefficients (x-axis) and significance (y-axis, measured by the linear regression model coefficient p-value) of clinical and genomic features against the number of small deletions. Each dot represents one feature in one cancer type. Labels are coloured according to the feature category. Dots are coloured by the frequency enrichment in metastatic (purple) or primary (orange) patients. Analogous panels are displayed for b) large deletions, c) short duplications, d) large duplications, e) short complex SVs, f) large complex SVs and g) LINEs. h) Lollipop plots representing the regression coefficients (left, relative to panel b. x-axis) and metastatic enrichment (right, relative to dots colour from panel b.) of features associated with small deletions. Only significant features (LM>0.0, LM coefficient p-value < 0.01 and with independent significance in primary or metastatic tumors) enriched in metastatic tumor patients (enrichment > 0.0) are displayed. i), j) and k) are identical but referring to large deletions, small duplications and large duplications, respectively. LM, linear model. Coef, coefficient.
Extended Data Fig. 7
Extended Data Fig. 7. Driver landscape and drivers per patient.
a) Cancer type-specific distribution of number of driver alterations, amplifications, deletions and mutations per patient in primary (top) and metastatic (bottom). Black dots represent the mean values. Labels display mean differences (metastatic - primary) in cancer types with a significant difference. “*”, two-sided Mann-Whitney adjusted p-value < 0.01. b) Volcano plots representing the cancer type-specific enrichment (x-axis) and significance (y-axis, FDR adjusted two-tailed Fisher’s exact test p-value) of driver genes between primary and metastatic cohorts. From left to right, amplification drivers, biallelically deleted drivers and mutated driver genes. BRCA, Breast carcinoma. KIRC, kidney renal clear cell carcinoma. OV, Ovarian serous adenocarcinoma. PRAD, Prostate carcinoma. SKCM, Skin melanoma. THCA, Thyroid carcinoma. LIHC, Hepatocellular carcinoma. PANET, pancreatic neuroendocrine.
Extended Data Fig. 8
Extended Data Fig. 8. Therapeutic actionability of variants.
a) Cancer type-specific fraction of primary (top) and metastatic (bottom) patients with reported therapeutically actionable variants. For each patient the variant with the greatest level of evidence was considered. Bars are coloured according to the variant actionability tiers. Fold change (i.e., metastatic divided by primary fraction) labels are displayed in cancer types with a significant proportional increase (two-sided Fisher’s exact test adjusted p-value < 0.05). Purple edgelines highlight significant increase in metastatic A-on label fraction patients. b) Primary (left) and metastatic (right) alteration frequency of actionable variants with a high discrepancy (>5% frequency difference) from cancer types with a global significant increase of actionable variants in metastatic tumor patients from panel a). “*”, a two-sided Fisher’s exact test adjusted p-value < 0.05. Text boxes include the associated treatments for alterations with a significant mutation frequency increase in metastatic tumor patients.
Extended Data Fig. 9
Extended Data Fig. 9. Treatment enriched drivers.
a) Visual depiction of the analytical framework to identify treatment enriched drivers (TEDs). Example, identification of TEDs in the 354 breast carcinoma patients treated with aromatase inhibitors. (1), identification of cancer driver genes from coding mutations (green), non-coding mutations (soft green), copy number amplifications (red) and deletions (blue). (2), for each driver gene, comparison of the alteration frequency in treated and untreated patients. (3) and (4), annotation of TEDs with type of enrichment and orthogonal evidence b) Side by side alteration frequency comparison between treated (right bar) and untreated (left bar) patients for all treatment-exclusive and c) treatment-enriched TEDs. d) Distribution of mutations along the AR protein sequence in prostate cancer patients treated with androgen deprivation (top) and untreated (bottom). Pfam domains are represented as rectangles. Mutations are coloured according to the consequence type. e) Distribution of focal copy number gains in chromosome X in prostate untreated patients (bottom) and treated with androgen deprivation (top). AR coding region and the promoter region are highlighted. f) Distribution of mutations along the ESR1 protein sequence in breast carcinoma patients treated with aromatase inhibitors (top) and untreated (bottom). g) Distribution of mutations along the EGFR protein in lung adenocarcinoma patients treated with EGFR inhibitors (top) and untreated (bottom). Pfam domains are represented as rectangles. h) Distribution of focal copy number gains in chromosome 7 in lung adenocarcinoma untreated patients (bottom) and treated with anti-EGFR (top). EGFR, MET and CDK6 genomic locations are highlighted. i) Distribution of focal copy number gains in chromosome chr18p:1Mb-8Mb in breast carcinoma untreated patients (bottom) and treated with pyrimidine antagonists (top). TYMS genomic location is highlighted. j) Similar to f) but representing ultra-focal (shorter than 3Mbs) MYC and PRNCR1 amplifications in chromosome 8q. In all copy number gain plots each bin represents 100Kbs. Mb, megabase. Kb, kilobase.
Extended Data Fig. 10
Extended Data Fig. 10. Pan-cancer differences between primary and metastatic tumors.
a) Stacked plot representing the qualitative differences of the eight studied genomic features across the 23 cancer types included in this study. Cancer types are sorted in ascending order according to the cumulative number of diverging genomic features between primary and metastatic tumors. Each horizontal track represents a genomic feature. The presence (and height) of each feature for a specific cancer type correlates with the magnitude of the observed differences.

Comment in

References

    1. Lambert AW, Pattabiraman DR, Weinberg RA. Emerging biological principles of metastasis. Cell. 2017;168:670–691. - PMC - PubMed
    1. Massagué J, Obenauf AC. Metastatic colonization by circulating tumour cells. Nature. 2016;529:298–306. - PMC - PubMed
    1. Welch DR, Hurst DR. Defining the hallmarks of metastasis. Cancer Res. 2019;79:3011–3027. - PMC - PubMed
    1. ICGC/TCGA Pan-Cancer Analysis of Whole Genomes Consortium. Pan-cancer analysis of whole genomes. Nature. 2020;578:82–93. - PMC - PubMed
    1. Priestley P, et al. Pan-cancer whole-genome analyses of metastatic solid tumours. Nature. 2019;575:210–216. - PMC - PubMed

Publication types

Substances