. 2023 May;617(7961):540-547.
doi: 10.1038/s41586-023-06046-z. Epub 2023 May 10.

Widespread somatic L1 retrotransposition in normal colorectal epithelium

Affiliations

Widespread somatic L1 retrotransposition in normal colorectal epithelium

Chang Hyun Nam et al. Nature. 2023 May.

Abstract

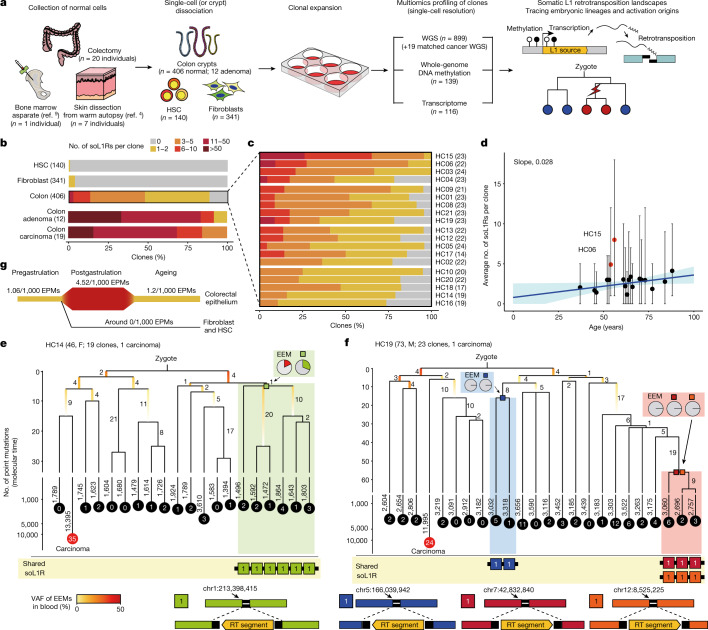
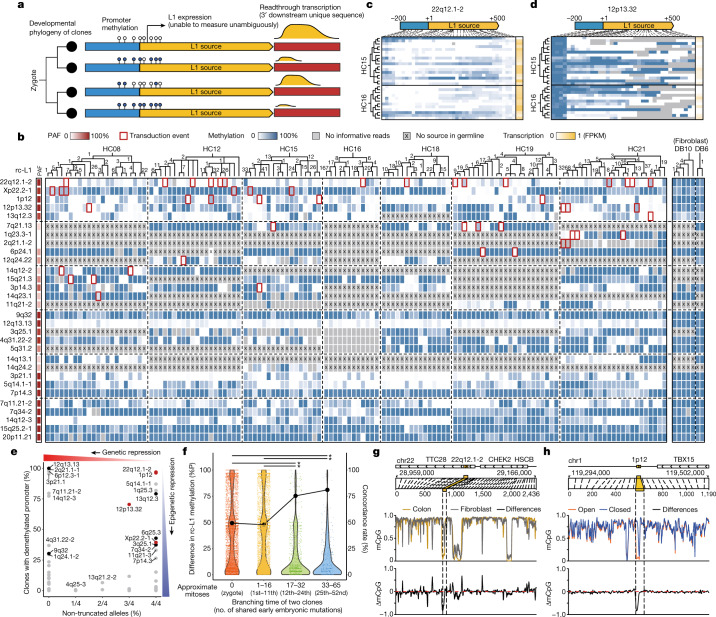
Throughout an individual's lifetime, genomic alterations accumulate in somatic cells1-11. However, the mutational landscape induced by retrotransposition of long interspersed nuclear element-1 (L1), a widespread mobile element in the human genome12-14, is poorly understood in normal cells. Here we explored the whole-genome sequences of 899 single-cell clones established from three different cell types collected from 28 individuals. We identified 1,708 somatic L1 retrotransposition events that were enriched in colorectal epithelium and showed a positive relationship with age. Fingerprinting of source elements showed 34 retrotransposition-competent L1s. Multidimensional analysis demonstrated that (1) somatic L1 retrotranspositions occur from early embryogenesis at a substantial rate, (2) epigenetic on/off of a source element is preferentially determined in the early organogenesis stage, (3) retrotransposition-competent L1s with a lower population allele frequency have higher retrotransposition activity and (4) only a small fraction of L1 transcripts in the cytoplasm are finally retrotransposed in somatic cells. Analysis of matched cancers further suggested that somatic L1 retrotransposition rate is substantially increased during colorectal tumourigenesis. In summary, this study illustrates L1 retrotransposition-induced somatic mosaicism in normal cells and provides insights into the genomic and epigenomic regulation of transposable elements over the human lifetime.


Conflict of interest statement

Y.S.J. is a cofounder and chief executive officer of Genome Insight, Inc. The remaining authors declare no competing interests.

Figures

Fig. 1
Fig. 1. Somatic L1 retrotranspositions in normal cells.
a, Experimental design of the study. HSC, haematopoietic stem and progenitor cells. b, Proportion of clones with various numbers of soL1Rs across different cell types (number of clones shown in parentheses). c, Proportion of normal colorectal clones with various numbers of soL1Rs across 19 individuals (number of clones shown in parentheses). d, Linear regression of the average number of soL1Rs per clone on age in 19 individuals with normal colorectal clones. Vertical line crossing each dot indicates the range of soL1R burden per clone in each individual. Blue line represents the regression line, and shaded areas indicate its 95% confidence interval. Two outlier individuals (HC15 and HC06) are highlighted in red. e,f, Early clonal phylogenies of HC14 (e) and HC19 (f) reconstructed by somatic point mutation. Branch lengths are proportional to the numbers of somatic mutations, which are shown by numbers next to the branches. Early embryonic branches are coloured by variant allele fraction (VAF) of early embryonic mutations (EEMs) in the blood. The numbers of soL1Rs detected are shown in the filled circles at the tips of branches. Pie charts indicate the proportion of blood cells harbouring the EEM or soL1R. RT segment, retrotransposed segment. g, Normalized soL1R rates in various stages and cell types.
Fig. 2
Fig. 2. Dynamics of L1 source element activity.
a, Schematic diagram of three classes of L1 retrotransposition: solo-L1, partnered transduction and orphan transduction. b, The landscape of transduction events with the features of 34 rc-L1s. TD, transduction; AFR, Africans; EUR, Europeans; EAS, East Asians; SAS, South Asians; AMR, Americans. c, Relationship between the population allele frequency of rc-L1s and their normalized retrotransposition activity. Green dots indicate private sources found in just one individual; red dots indicate prevalent-active sources; black and grey dots indicate common sources contributing any and no transduction events in our study, respectively. Blue line represents the regression line of active, but not prevalent, sources and shaded areas indicate its 95% confidence interval. TPAM, number of transductions per L1 allele per 1 million endogenous point mutations of molecular time. d, Proportion of L1 subfamily and prevalence of truncating mutations of rc-L1 sources across their PAF. Groups with PAF < 25, 25 < PAF < 75 and PAF > 75 have ten, 34 and 90 L1 sources, respectively.
Fig. 3
Fig. 3. Regulation of L1 source element activity.
a, Schematic diagram of the multidimensional analysis. b, Panorama of DNA methylation status of 30 rc-L1s with developmental phylogenies for 132 normal colorectal clones and seven fibroblast clones from nine individuals. It includes 14 rc-L1s contributing any transduction events in these clones and 16 additional rc-L1s showing demethylated promoters in at least five clones. Numbers of branch-specific point mutations are shown in the phylogenies. c,d, DNA methylation status and readthrough transcription level of rc-L1 at 22q12.1-2 (c) and 12p13.32 (d). e, Proportion of non-truncation and promoter demethylation of 90 population-prevalent rc-L1s. Red dots, prevalent-active sources; black and grey dots, common sources showing any and no transduction events in our study, respectively. f, Differences in rc-L1 promoter methylation in clone pairs according to their embryonic branching time. The top 30 rc-L1s showing substantial variation in promoter methylation were considered. A fixed mutation rate was used to convert mutation time to embryonic cell generation. %P, percentage point; *P < 2.2 × 10−16 (two-sample Kolmogorov–Smirnov test). g,h, Methylation profile of 100 kb upstream and downstream regions of rc-L1 at 22q12.1-2 (g) and 1p12 (h). The rc-L1 loci are highlighted by yellow rectangles. Top, genomic coordinates and order of CpG sites. Middle, fraction of methylated CpG in colorectal (gold) and fibroblast (silver) clones (g), and in colorectal clones with open (orange) and closed (blue) promoters (h). Bottom, differences in fraction of methylated CpG depicted in middle panel. mCpG, methylated CpG.
Fig. 4
Fig. 4. Breakpoint and rate acceleration of somatic L1 retrotranspositions.
a,b, Schematic diagrams of genomic structures of canonical and complex L1 insertions (a) and underlying mechanisms (b). RT body, retrotransposed body; DSB, double-strand break. c, Phylogeny of MUTYH-associated adenomatous clones with normalized L1 rates in groups of lineages classified by driver mutations. Branch lengths are proportional to molecular time, as measured by the number of somatic point mutations. Numbers of branch-specific soL1Rs and branch-specific driver mutations are shown.
Fig. 5
Fig. 5. Landscape of somatic L1 retrotranspositions.
Schematic diagram illustrating factors influencing the soL1R landscape. Genetic composition of rc-L1s is inherited from the parents. The methylation landscape of rc-L1 promoters is predominantly determined by global DNA demethylation, followed by remethylation processes in the developmental stages. Then, when an rc-L1 is promoter demethylated in a specific cell lineage, the source expresses L1 transcripts thus making possible the induction of soL1Rs.
Extended Data Fig. 1
Extended Data Fig. 1. Clones for detection of soL1Rs.
a, A scatter plot showing mean sequencing coverage of clones and peak VAF of somatic mutations. Most clones showed their peak VAFs around 0.5, indicating that they were established from a single founder cell. b, Chromosome level copy number changes of the 887 normal clones. No significant genome-wide aneuploidy was detected, supporting genomic stability during clonal expansion of normal single cells. c, A Venn diagram showing the number of soL1Rs detected by each bioinformatics tool. d, A schematic plot describing two genomic footprints of retrotransposition, the poly-A tail and target site duplication. RT body, retrotransposed body; TSD, target site duplication. e, The distribution of target site lengths at insertion sites. Positive and negative target site lengths indicate target site duplication and deletion, respectively. soL1R, somatic L1 retrotransposition. f, Number of structural variations in 406 clones from normal colon epithelial cells. T-T inversion, tail-to-tail inversion; H-H inversion, head-to-head inversion.
Extended Data Fig. 2
Extended Data Fig. 2. Associations between soL1R burden and other genomic features of clones.
a, Linear regression between the average number of endogenous point mutations in the colorectal clones and the age of sampling in 19 individuals. Blue line represents the regression line (44.6 point mutations per year), and shaded areas indicate its 95% confidence interval. The rate is consistent with the rate previously estimated in the colon (43.6 mutations per year from Lee-Six et al., Ref. ). b,c, Comparison of the average number of soL1Rs per individual across sex (b) and anatomical location of the colorectal crypts (c) in 19 individuals with normal colorectal clones with two-sided Wilcoxon rank-sum test. Box plots illustrate median values with interquartile ranges (IQR) with whiskers (1.5 x IQRs). ns, not significant. di, Relationship between the number of soL1R for each colorectal clone and the number of somatic point mutations (d), telomere length (e), the number of somatic SBS1 SNVs (f, clock-like mutations by deamination of 5-methylcytosine), the number of somatic SBS5+SBS40 SNVs (g, clock-like mutations by unknown process), the number of somatic SBS18 SNVs (h, possibly damage by reactive oxygen species), and the number of somatic SBS88 SNVs (i, damage by colibactin from pks+ E. coli). No obvious association was found. j, Number of LCM-based patches with various numbers of soL1Rs across different organs. LCM, laser-capture microdissection.
Extended Data Fig. 3
Extended Data Fig. 3. SoL1Rs on the developmental phylogenies of the clones from the seven individuals with early embryonic soL1R events.
Early phylogenies of colorectal clones and the matched cancer tissue are shown in seven individuals who have shared soL1Rs among clones. Branch lengths are proportional to the molecular time measured by the number of somatic point mutations. The numbers of branch-specific point mutations are shown with numbers. The filled circles at the ends of branches represent normal clones (black-filled circles) and cancer clones (red-filled circles). The numbers within the filled circles show the number of soL1Rs detected from the clones. Shaded areas indicate somatic lineages with shared soL1Rs. The genomic location of the shared soL1R insertions and the proportion of the blood cells carrying the soL1Rs are shown by genomic coordinates and pie charts. Coloured bars on the right side represent the proportion of mutational signatures attributable to the somatic point mutations. Orange diamonds show L1 sources (origin), which caused transduction events across the colorectal clones.
Extended Data Fig. 4
Extended Data Fig. 4. SoL1Rs on the developmental phylogenies of the clones from the 12 individuals without early embryonic soL1R events.
Early phylogenies of colorectal clones and the matched cancer tissue are shown in 12 individuals who have no shared soL1Rs among clones. Branch lengths are proportional to the molecular time measured by the number of somatic point mutations. The numbers of branch-specific point mutations are shown with numbers. The filled circles at the ends of branches represent normal clones (black-filled circles) and cancer clones (red-filled circles). The numbers within the filled circles show the number of soL1Rs detected from the clones. Shaded area indicates somatic lineages with shared Alu insertion. The genomic location of the shared Alu insertion and the proportion of the blood cells carrying the Alu insertion are shown by genomic coordinates and a pie chart. Coloured bars on the right side represent the proportion of mutational signatures attributable to the somatic point mutations. Orange diamonds show L1 sources (origin), which caused transduction events across the colorectal clones.
Extended Data Fig. 5
Extended Data Fig. 5. An example of a soL1R event induced from a somatically acquired L1 source.
HC05 tumour has a rc-L1 in 22q12.1 (middle) which is not found in the germline of HC05 (blood; left). The rc-L1 (22q12.1-1) caused a transduction event at 5q31.1 (right) in the tumour, suggesting secondary transduction from the new somatically acquired rc-L1. The proposed order of events is summarised in the lower-left panel. SoL1R, somatic L1 retrotransposition.
Extended Data Fig. 6
Extended Data Fig. 6. Relationship between DNA methylation status and readthrough RNA expression levels.
Relationship between DNA methylation status in the promoter region and readthrough RNA expression level of rc-L1s, which have variable methylation and expression levels, is described in each individual. It only includes cases where there are more than 10 clones with information on methylation and expression levels for a specific rc-L1 in an individual. Correlation coefficient and P-value from Pearson’s test is described. Blue line represents the regression line, and the shaded areas indicate its 95% confidence interval. FPKM, fragments per kilobase of transcript per million.
Extended Data Fig. 7
Extended Data Fig. 7. Panorama of DNA methylation status and readthrough RNA expression levels of 48 rc-L1s.
DNA methylation status, readthrough RNA expression levels, and developmental phylogenies of 48 rc-L1s in 132 normal colorectal clones and 7 fibroblast clones from 9 patients are displayed. It includes 27 rc-L1s that were active in our colorectal cohort and 21 rc-L1s that harbour demethylated promoters in at least five colorectal clones. The phylogenies are shown on the left side with the number of point mutations (molecular time). PAF, population allele frequency; FPKM, fragments per kilobase of transcript per million; rc-L1, retrotransposition-competent L1.
Extended Data Fig. 8
Extended Data Fig. 8. DNA methylation levels in various tissues and differences in DNA methylation in the regions nearby source elements and whole-genomes of colorectal clones.
a, Average level of L1 promoter DNA methylation across different tissues from ENCODE. Among 30 rc-L1s described in Fig. 3b, only 12 rc-L1s with sufficient reads in all tissues were selected. b, Methylation profiles of 100 kb upstream and downstream regions of 6 reference rc-L1s with variable methylation levels in colorectal clones. The region for rc-L1 is highlighted with yellow boxes. The genomic coordinates and order of CpG sites are depicted in the top panel. Middle panel shows the fraction of methylated CpG in colorectal clones with open (orange) and closed (blue) promoters. Bottom panel shows the differences in the fraction of methylated CpG depicted in the middle panel. mCpG, methylated CpG. c, A scatter plot showing genome-wide methylation levels of normal colorectal clones in each individual.
Extended Data Fig. 9
Extended Data Fig. 9. Characteristics of soL1R insertion sites and examples of soL1Rs providing insights into the L1 dynamics in somatic cells.
a, Genome-wide distribution of soL1R target sites in normal colorectal clones and 19 matched colorectal cancers. Bars represent the number of L1 insertions in a 10 Mb sliding window with a 5-Mb-sized step. b, Association between L1 insertion rate and various genomic features. Dots represent the log value of enrichment scores calculated by comparing bins 1–3 against bin 0 for each feature. L1 EN motif, L1 endonuclease target motif; DHS, DNase I hypersensitivity site. c, Distribution of distances to the nearest gene from L1 insertion sites and those from random sites. df, Distribution of distances to the nearest point mutations (d), gene expression level (e), and methylation fraction of nearby region (f) in colorectal clones with and without L1 insertions. TPM, transcripts per million. g, An example of a soL1R co-inserted with an expressed gene in the vicinity of the insertion site. A suggestive mechanism is shown in the bottom panel. SoL1R, somatic L1 retrotransposition; TSD, target site duplication; RT body, retrotransposed body. h, An example of a clone with two transduction events at different genomic target sites but with the same length of the unique sequences. A suggestive mechanism is shown in the bottom panel.
Extended Data Fig. 10
Extended Data Fig. 10. Differences in genomic features of somatic L1 insertion between normal colorectal clones and colorectal cancers.
a, The soL1R rate is accelerated during tumourigenesis in colorectal lineages. EPM, endogenous point mutation. b, Distribution of L1 insertion size in 406 normal colorectal clones and 19 matched colorectal cancers. c, Proportion of soL1Rs events with head variations in 406 normal colorectal clones and 19 matched colorectal cancers. dg, The number of soL1Rs between colorectal cancers with or without TP53 inactivating mutations (left), microsatellite instability (middle) and genomic instability (chromosomal instability; right). Sample numbers are shown in the parentheses. P values from two-sided t-test (left, middle) and linear regression (right) were shown. Box plots illustrate median values with interquartile ranges (IQR) with whiskers (1.5 x IQRs). Blue lines represent the regression lines, and the shaded areas indicate their 95% confidence intervals. P values from two-sided multivariate regression were represented in the right space. ns, not significant. d. In 19 matched colorectal cancer tissues. e. In 19 matched colorectal cancer tissues and 52 PCAWG colorectal cancer tissues. f. In 19 matched colorecal cancer tissues and 4 cancer types (colorectal adenocarcinomas, oesophageal adenocarcinomas, lung squamous cell carcinomas, and head and neck squamous cell carcinomas) showing a higher soL1R burden among 40 histologic types in PCAWG. g. In 19 matched colorectal cancer tissues with all whitelist PCAWG samples.
Extended Data Fig. 11
Extended Data Fig. 11. SoL1Rs in cancer and classical genome instability.
Relationship between soL1R burden and classical genome instability, such as TP53-inactivating mutations and chromosomal instability, was analysed in PCAWG whitelist samples (n = 2,677) and 19 matched colorectal cancers in this study. Cancer types with less than 10 cases were not considered. a, Somatic TP53-inactivating mutations and the number of soL1R events. Box plots illustrate median values with interquartile ranges (IQR) with whiskers (1.5 x IQRs). Number of cases in each histology type were shown in parentheses. P values from two-sided t-test were shown. NA, not available. b, Linear regression between the chromosomal instability (genomic rearrangements) and the number of soL1R events in each cancer type. Blue lines represent the regression lines, and the shaded areas indicate their 95% confidence intervals. R-squared and P values from linear regression were represented in each panel.

References

    1. Stratton MR, Campbell PJ, Futreal PA. The cancer genome. Nature. 2009;458:719–724. doi: 10.1038/nature07943. - DOI - PMC - PubMed
    1. Behjati S, et al. Genome sequencing of normal cells reveals developmental lineages and mutational processes. Nature. 2014;513:422–425. doi: 10.1038/nature13448. - DOI - PMC - PubMed
    1. Ju YS, et al. Somatic mutations reveal asymmetric cellular dynamics in the early human embryo. Nature. 2017;543:714–718. doi: 10.1038/nature21703. - DOI - PMC - PubMed
    1. Park S, et al. Clonal dynamics in early human embryogenesis inferred from somatic mutation. Nature. 2021;597:393–397. doi: 10.1038/s41586-021-03786-8. - DOI - PubMed
    1. Coorens THH, et al. Extensive phylogenies of human development inferred from somatic mutations. Nature. 2021;597:387–392. doi: 10.1038/s41586-021-03790-y. - DOI - PubMed

Publication types