. 2023 May;617(7960):325-334.
doi: 10.1038/s41586-023-05895-y. Epub 2023 May 10.

Increased mutation and gene conversion within human segmental duplications

Collaborators, Affiliations

Increased mutation and gene conversion within human segmental duplications

Mitchell R Vollger et al. Nature. 2023 May.

Abstract

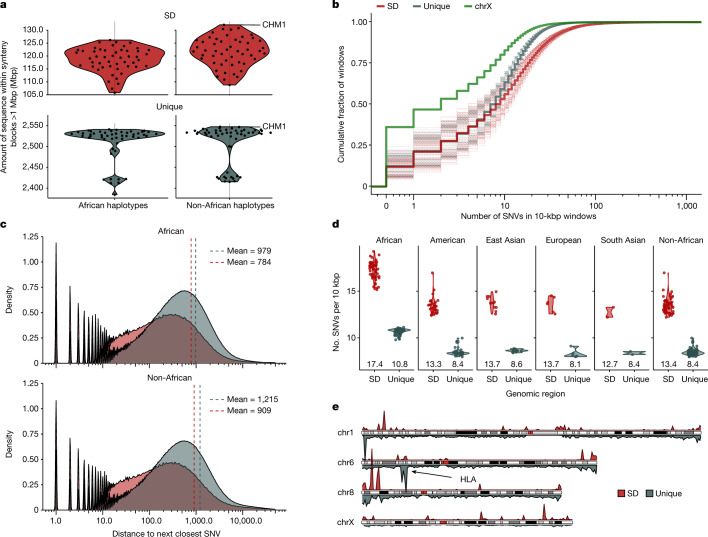
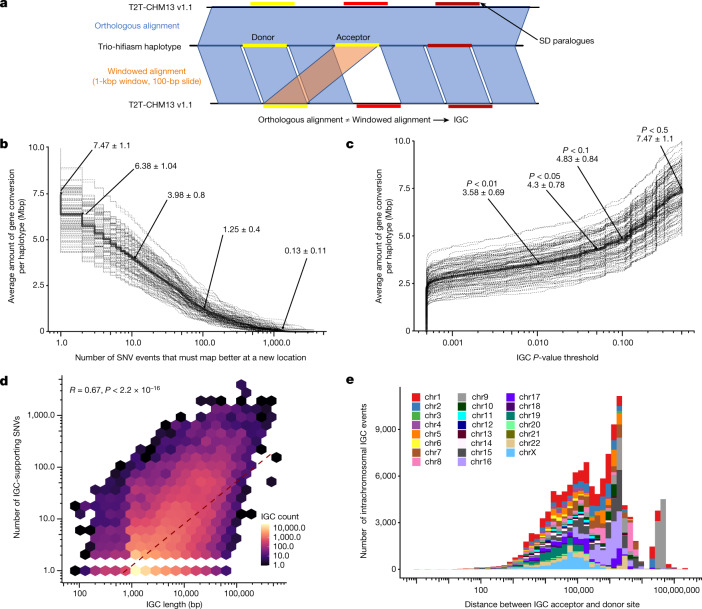
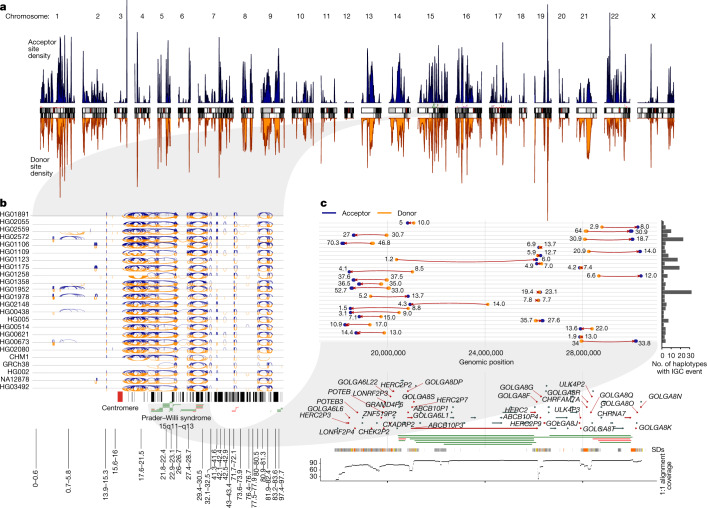
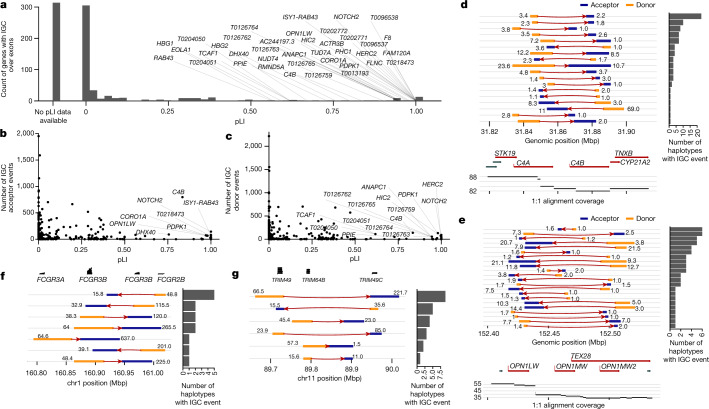
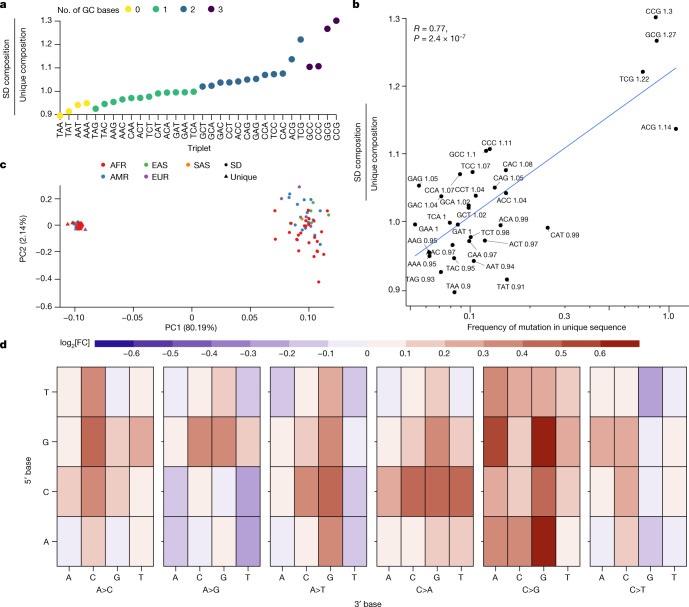
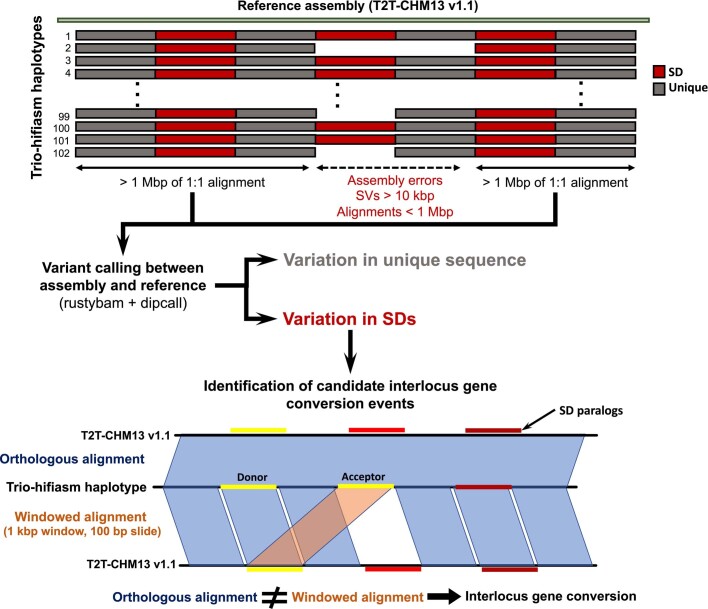
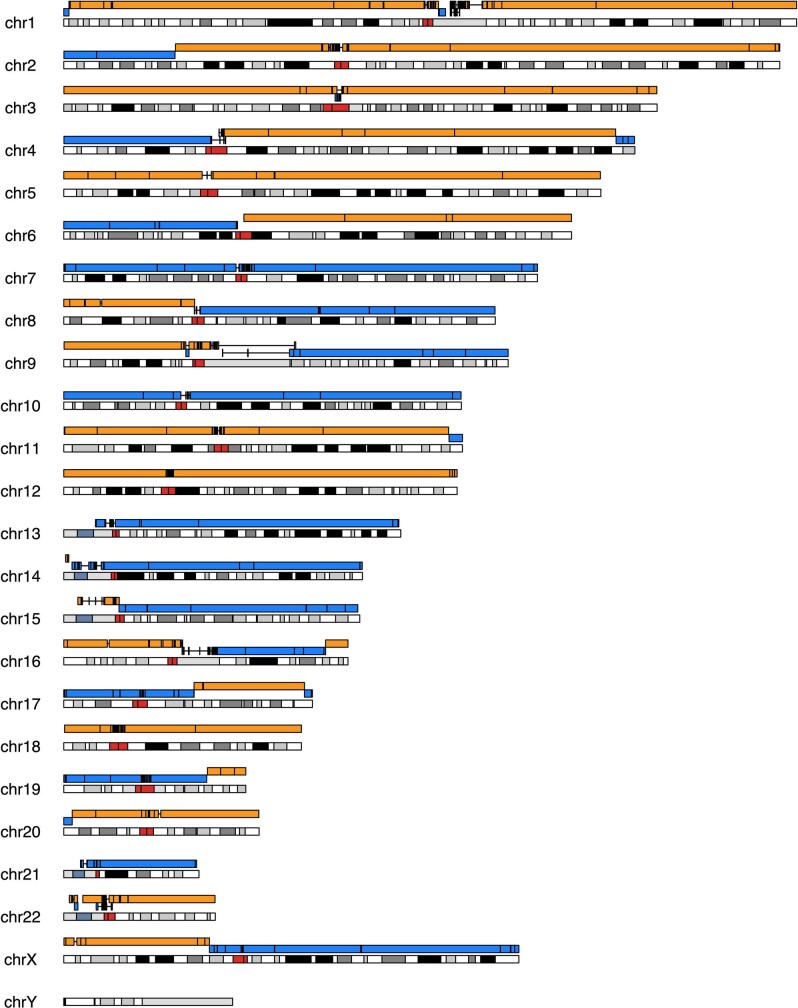
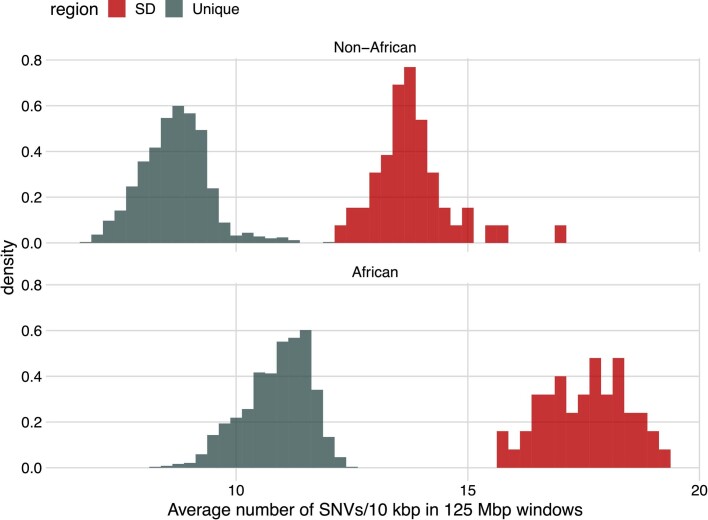
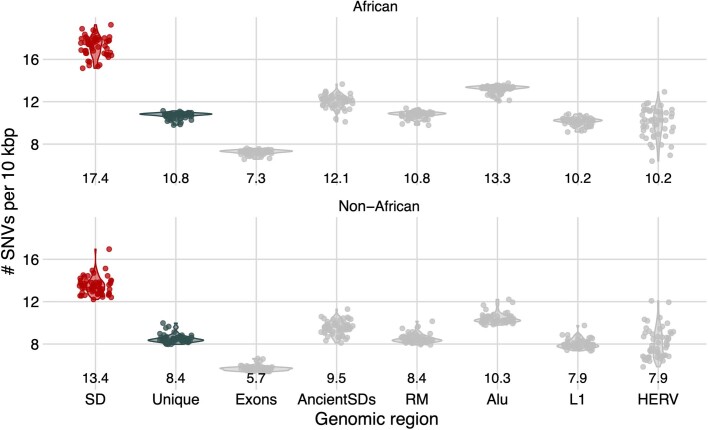
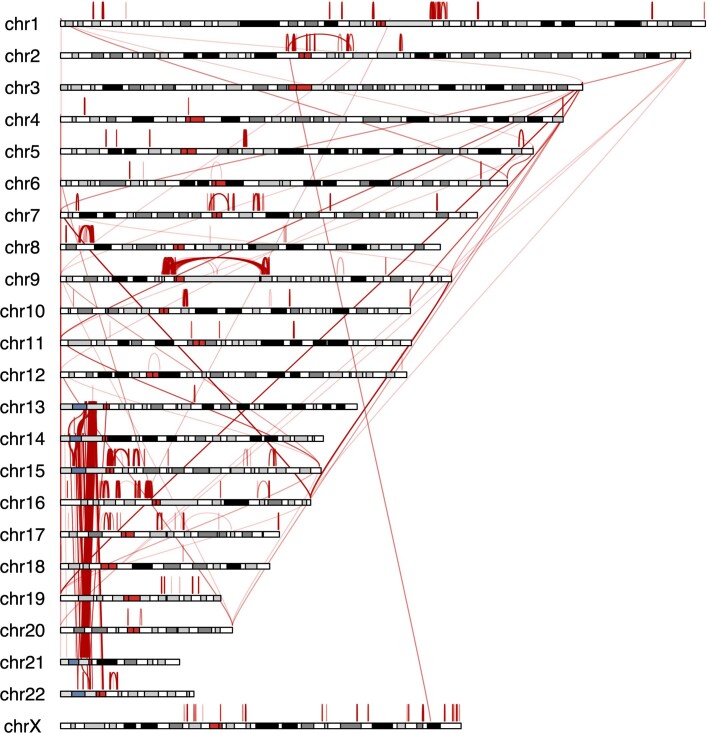
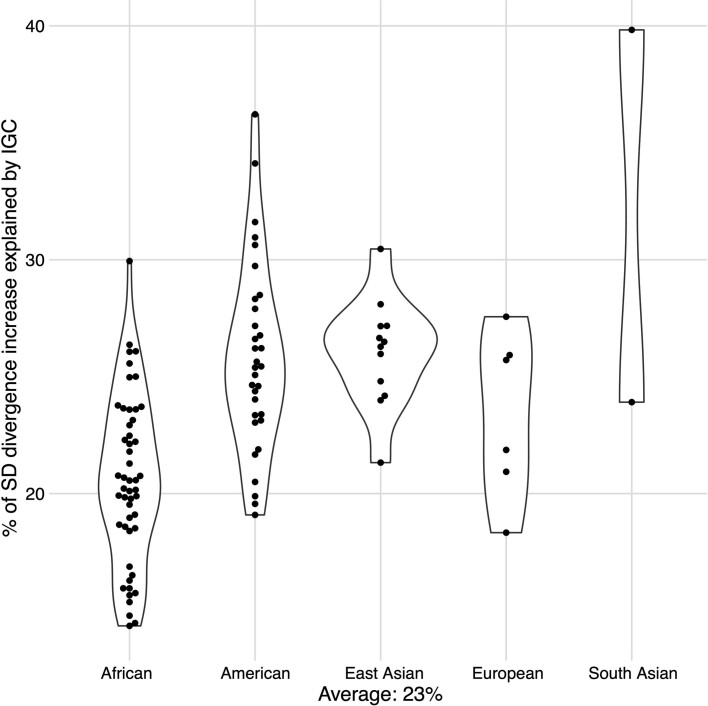
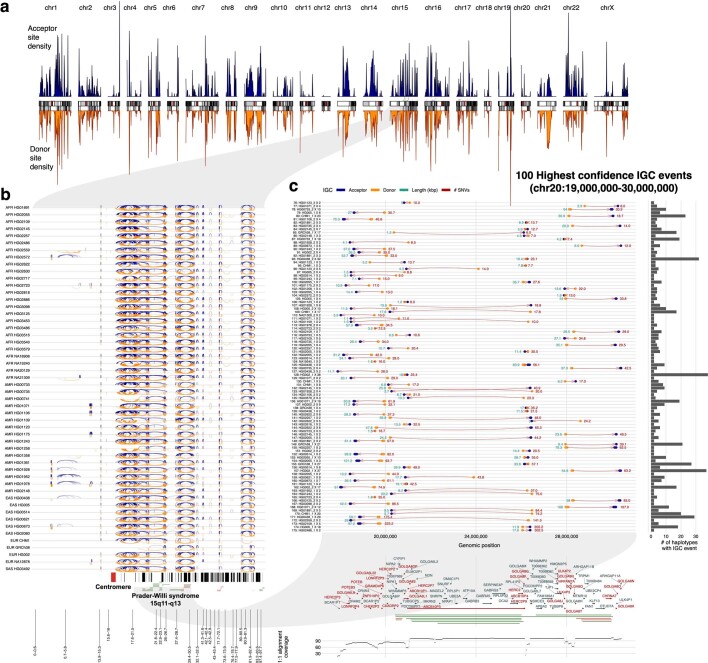
Single-nucleotide variants (SNVs) in segmental duplications (SDs) have not been systematically assessed because of the limitations of mapping short-read sequencing data1,2. Here we constructed 1:1 unambiguous alignments spanning high-identity SDs across 102 human haplotypes and compared the pattern of SNVs between unique and duplicated regions3,4. We find that human SNVs are elevated 60% in SDs compared to unique regions and estimate that at least 23% of this increase is due to interlocus gene conversion (IGC) with up to 4.3 megabase pairs of SD sequence converted on average per human haplotype. We develop a genome-wide map of IGC donors and acceptors, including 498 acceptor and 454 donor hotspots affecting the exons of about 800 protein-coding genes. These include 171 genes that have 'relocated' on average 1.61 megabase pairs in a subset of human haplotypes. Using a coalescent framework, we show that SD regions are slightly evolutionarily older when compared to unique sequences, probably owing to IGC. SNVs in SDs, however, show a distinct mutational spectrum: a 27.1% increase in transversions that convert cytosine to guanine or the reverse across all triplet contexts and a 7.6% reduction in the frequency of CpG-associated mutations when compared to unique DNA. We reason that these distinct mutational properties help to maintain an overall higher GC content of SD DNA compared to that of unique DNA, probably driven by GC-biased conversion between paralogous sequences5,6.


Conflict of interest statement

E.E.E. is a scientific advisory board member of Variant Bio, Inc. All other authors declare no competing interests.

Figures

Fig. 1
Fig. 1. Increased single-nucleotide variation in SDs.
a, The portion of the human genome analysed for SD (red) and unique (blue) regions among African and non-African genomes. Shown are the number of megabase pairs aligned in 1:1 syntenic blocks to T2T-CHM13 v1.1 for each assembled haplotype. Data are shown as both a single point per haplotype originating from a single individual and a smoothed violin plot to represent the population distribution. b, Empirical cumulative distribution showing the number of SNVs in 10-kbp windows in the syntenic regions stratified by unique (grey), SD (red) and the X chromosome (chrX; green). Dashed lines represent individual haplotypes and thick lines represent the average trend of all the data. c, Distribution of the average distance to the next closest SNV in SD (red) and unique (grey) space separating African (top) and non-African (bottom) samples. Dashed vertical lines are drawn at the mean of each distribution. d, Average number of SNVs per 10-kbp window in SD (red) versus unique (grey) space by superpopulation and with mean value shown underneath each violin. The non-African column represents an aggregation of the data from all non-African populations in this study. e, Density of SNVs in 10 bp of each other for SD (top, red) and unique (bottom, grey) regions for chromosomes 1, 6, 8 and X comparing the relative density of known (for example, HLA) and new hotspots of single-nucleotide variation.
Fig. 2
Fig. 2. Candidate IGC events.
a, Method to detect IGC. The assembled human haplotype query sequence from 1:1 syntenic alignments was fragmented into 1-kbp windows in 100-bp increments and realigned back to T2T-CHM13 v1.1 independent of the flanking sequence information using minimap2 v2.24 to identify each window’s single best alignment position. These alignments were compared to their original syntenic alignment positions, and if they were not overlapping, we considered them to be candidate IGC windows. Candidate IGC windows were then merged into larger intervals and realigned when windows were overlapping in both the donor and the acceptor sequence. We then used the CIGAR string to identify the number of matching and mismatching bases at the ‘donor’ site and compared that to the number of matching and mismatching bases at the acceptor site determined by the syntenic alignment to calculate the number of supporting SNVs. b, The amount of SDs (in megabase pairs) predicted to be affected by IGC per haplotype, as a function of the minimum number of SNVs that support the IGC call. Dashed lines represent individual haplotypes and the solid line represents the average. c, Empirical cumulative distribution of the megabase pairs of candidate IGC observed in HPRC haplotypes, as a function of the minimum underlying P-value threshold used to define the IGC callset (see Methods for IGC P-value calculation). Dashed lines represent individual haplotypes and the solid line represents the average. d, Correlation between IGC length and the number of supporting SNVs. e, Distribution of the distance between predicted IGC acceptor and donor sites for intrachromosomal events by chromosome.
Fig. 3
Fig. 3. IGC hotspots.
a, Density of IGC acceptor (top, blue) and donor (bottom, orange) sites across the ‘SD genome’. The SD genome consists of all main SD regions (>50 kbp) minus the intervening unique sequences. b, All intrachromosomal IGC events on 24 human haplotypes analysed for chromosome 15. Arcs drawn in blue (top) have the acceptor site on the left-hand side and the donor site on the right. Arcs drawn in orange (bottom) are arranged oppositely. Protein-coding genes are drawn as vertical black lines above the ideogram, and large duplication (blue) and deletion (red) events associated with human diseases are drawn as horizontal lines just above the ideogram. c, Zoom of the 30 highest confidence (lowest P value) IGC events on chromosome 15 between 17 and 31 Mbp. The number to the left of each event shows its length (kbp) and that to the right shows its number of SNVs. Genes with IGC events are highlighted in red and associate with the breakpoint regions of Prader–Willi syndrome. An expanded graphic with all haplotypes is included in Extended Data Fig. 7.
Fig. 4
Fig. 4. Protein-coding genes affected by IGC.
a, Number of putative IGC events intersecting exons of protein-coding genes as a function of a gene’s pLI. Of the 799 genes, 314 (39.3%) did not have a pLI score and are shown in the column labelled No pLI data available. b,c, Number of times a gene exon acts as an acceptor (b) or a donor (c) of an IGC event. d,e, IGC events at the complement factor locus, C4A and C4B (d), and the opsin middle- and long-wavelength-sensitive genes associated with colour blindness (OPN1MW and OPN1LW locus; e). Predicted donor (orange) and acceptor (blue) segments by length (number to left of event) and average number of supporting SNVs (number to right of event) are shown. The number of human haplotypes supporting each configuration is depicted by the histograms to the right. f,g, IGC events that reposition entire gene models for the FCGR (f) and TRIM (g) loci.
Fig. 5
Fig. 5. Sequence composition and mutational spectra of SD SNVs.
a, Compositional increase in GC-containing triplets in SD versus unique regions of the genome (coloured by GC content). b, Correlation between the enrichment of certain triplets in SDs compared to the mutability of that triplet in unique regions of the genome. Mutability is defined as the sum of all SNVs that change a triplet divided by the total count of that triplet in the genome. The enrichment ratio of SD over unique regions is indicated in text next to each triplet sequence. The text (upper left) indicates the value of the Pearson’s correlation coefficient and the P value from a two-sided t-test without adjustment for multiple comparisons. c, PCA of the mutational spectra of triplets in SD (circles) versus unique (triangles) regions polarized against a chimpanzee genome assembly and coloured by the continental superpopulation of the sample. AFR, African; AMR, American; EAS, East Asian; EUR, European; SAS, South Asian. d, The log[fold change] in triplet mutation frequency between SD and unique sequences. The y axis represents the 5′ base of the triplet context; the first level of the x axis shows which central base has changed and the second level of the x axis shows the 3′ base: heatmap depicts the log[fold change]. As an example, the top left corner shows the log[fold change] in frequency of TAA>TCA mutations in SD versus unique sequences.
Extended Data Fig. 1
Extended Data Fig. 1. Analysis schema for variant and IGC calling.
Whole-genome alignments were calculated for the HPRC assemblies against T2T-CHM13 v1.1 with a copy of GRCh38 chrY using minimap2 v2.24. The alignments were further processed to remove alignments that were redundant in query sequence or that had structural variants over 10 kbp in length. After these steps, the remaining alignments over 1 Mbp were defined to be syntenic and used in downstream analyses. We then counted all pairwise single-nucleotide differences between the haplotypes and the reference and stratified these results into unique regions versus SD regions based on the SD annotations from T2T-CHM13 v1.1. All variants intersecting tandem repeats were filtered to avoid spurious SNV calls. To detect candidate regions of IGC, the query sequence with syntenic alignments was fragmented into 1 kbp windows with a 100 bp slide and realigned back to T2T-CHM13 v1.1 independent of the flanking sequence using minimap2 v2.24 to identify each window’s single best alignment position. These alignments were compared to their original syntenic alignment positions, and if they were not overlapping, we considered them to be candidate IGC windows. Candidate IGC windows were then merged into larger intervals and realigned when windows were overlapping in both the donor and the acceptor sequence. We then used the CIGAR string to identify the number of matching and mismatching bases at the “donor” site and compared that to the number of matching and mismatching bases at the acceptor site determined by the syntenic alignment to calculate the number of supporting SNVs.
Extended Data Fig. 2
Extended Data Fig. 2. Ideogram of an assembly of CHM1 aligned to T2T-CHM13.
The ideogram depicts the contiguity (alternating blue and orange contigs) of a CHM1 assembly generated by Verkko as compared to T2T-CHM13. The overall contig N50 is 105.2 Mbp providing near chromosome arm contiguity with the exception of breaks at the centromere (red) and other large satellite arrays. Because the sequence is derived from a monoploid complete hydatidiform mole, there is no opportunity for assembly errors due to inadvertent haplotype switching.
Extended Data Fig. 3
Extended Data Fig. 3. Increased variation in SD sequences and African haplotypes.
Histograms of the average number of SNVs per 10 kbp over all 125 Mbp bins of unique (blue) and SD (red) sequence for all haplotypes. African haplotypes (bottom) are compared separately to non-African (top) haplotypes. All SD bins (125 Mbp each) have more SNVs than any unique bin irrespective of human superpopulation.
Extended Data Fig. 4
Extended Data Fig. 4. Average number of SNVs across different repeat classes.
Shown are the average number of SNVs per 10 kbp within SDs (red), unique (blue), and additional sequence classes (gray) across the HPRC haplotypes. These classes include exonic regions, ancient SDs (SD with <90% sequence identity) and all elements identified by RepeatMasker (RM) with Alu, L1 LINE, and HERV elements broken out separately. Below each sequence class we show the average number of SNVs per 10 kbp for the median haplotype. Standard deviations and measurements for additional repeat classes are provided in Table S3.
Extended Data Fig. 5
Extended Data Fig. 5. Largest IGC events in the human genome.
The ideogram depicts as red arcs the positions of the largest IGC events between and within human chromosomes (top 10% of the length distribution).
Extended Data Fig. 6
Extended Data Fig. 6. Percent of increased single-nucleotide variation explained by IGC.
Shown is the fraction of the increased SNV diversity in SDs that can be attributed to IGC for each of the HPRC haplotypes stratified by global superpopulation. In text is the average across all haplotypes (23%).
Extended Data Fig. 7
Extended Data Fig. 7. IGC hotspots.
a) Density of IGC acceptor (top, blue) and donor (bottom, orange) sites across the “SD genome”. The SD genome consists of all main SD regions (>50 kbp) minus the intervening unique sequences. b) All intrachromosomal IGC events from 102 human haplotypes analyzed for chromosome 15. Arcs drawn in blue (top) have the acceptor site on the left-hand side and the donor site on the right. Arcs drawn in orange (bottom) are arranged oppositely. Protein-coding genes are drawn as vertical black lines above the ideogram, and large duplication (blue) and deletion (red) events associated with human diseases are drawn as horizontal lines just above the ideogram. c) Zoom of the 100 highest confidence (lowest p-value) IGC events identified on chromosome 15 between 17 and 31 Mbp. Genes that are intersected by IGC events are highlighted in red.

Comment in

References

    1. Bailey JA, Yavor AM, Massa HF, Trask BJ, Eichler EE. Segmental duplications: organization and impact within the current human genome project assembly. Genome Res. 2001;11:1005–1017. doi: 10.1101/gr.187101. - DOI - PMC - PubMed
    1. Fredman D, et al. Complex SNP-related sequence variation in segmental genome duplications. Nat. Genet. 2004;36:861–866. doi: 10.1038/ng1401. - DOI - PubMed
    1. Liao, W.-W. et al. A draft human pangenome reference. Nature, 10.1038/s41586-023-05896-x (2023). - PMC - PubMed
    1. Ebert P, et al. Haplotype-resolved diverse human genomes and integrated analysis of structural variation. Science. 2021;372:eabf7117. doi: 10.1126/science.abf7117. - DOI - PMC - PubMed
    1. Duret L, Galtier N. Biased gene conversion and the evolution of mammalian genomic landscapes. Annu. Rev. Genomics Hum. Genet. 2009;10:285–311. doi: 10.1146/annurev-genom-082908-150001. - DOI - PubMed

Publication types