. 2023 May;617(7960):335-343.
doi: 10.1038/s41586-023-05976-y. Epub 2023 May 10.

Recombination between heterologous human acrocentric chromosomes

Collaborators, Affiliations

Recombination between heterologous human acrocentric chromosomes

Andrea Guarracino et al. Nature. 2023 May.

Abstract

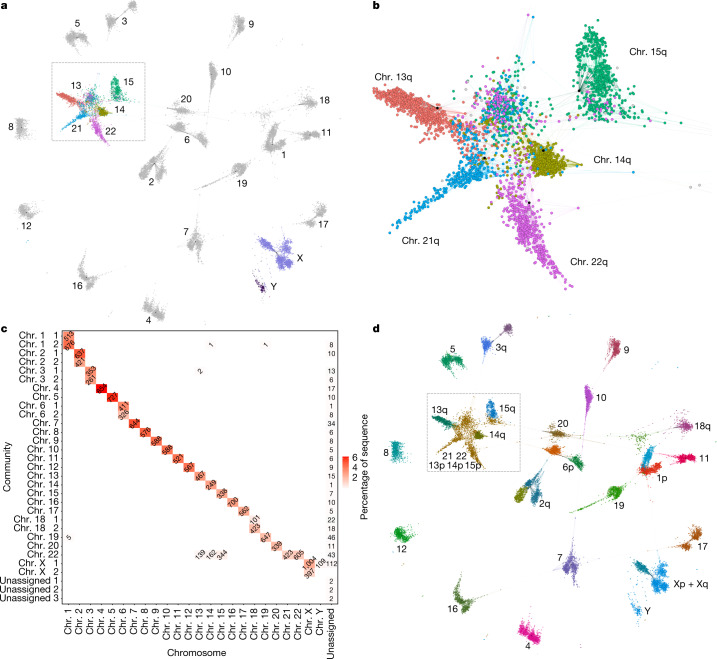
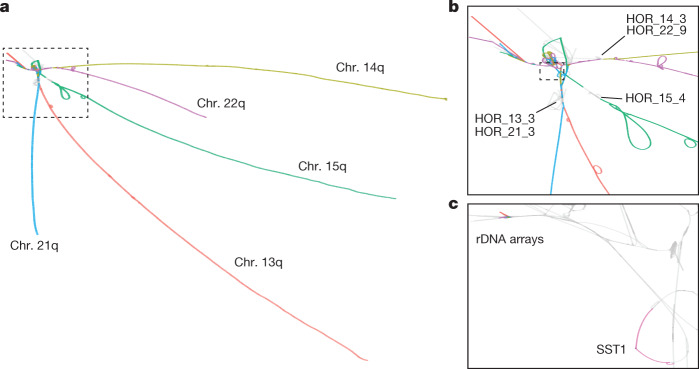
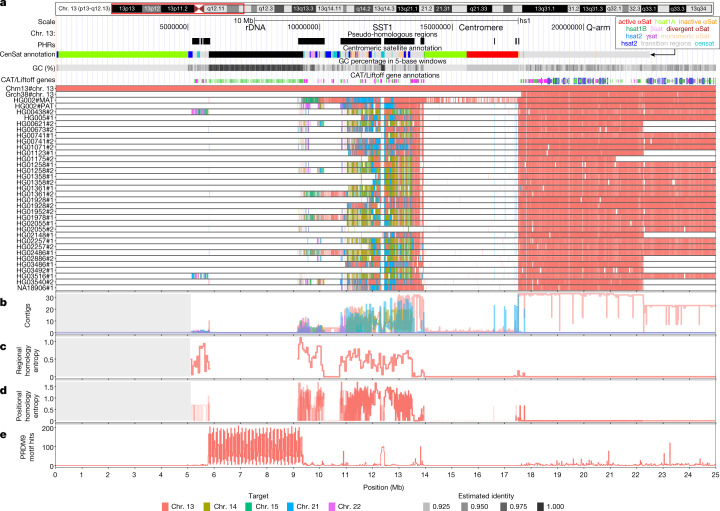
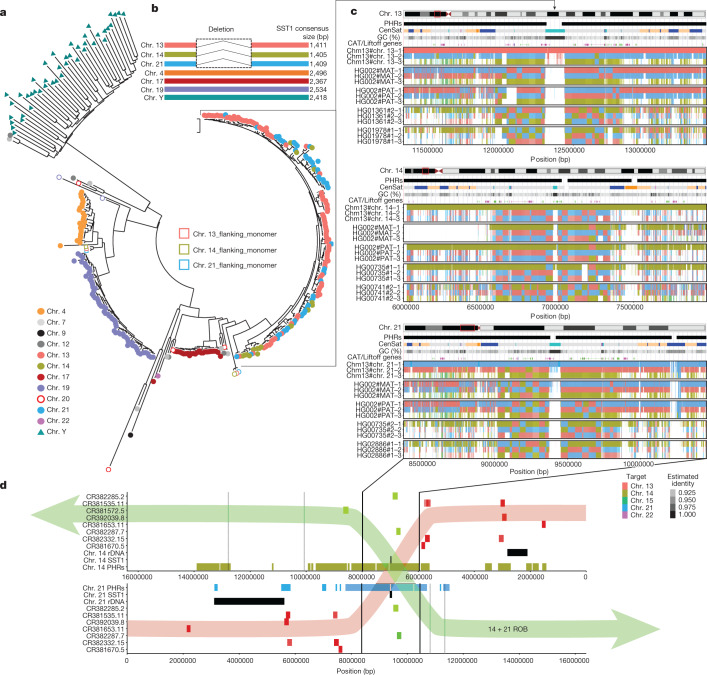
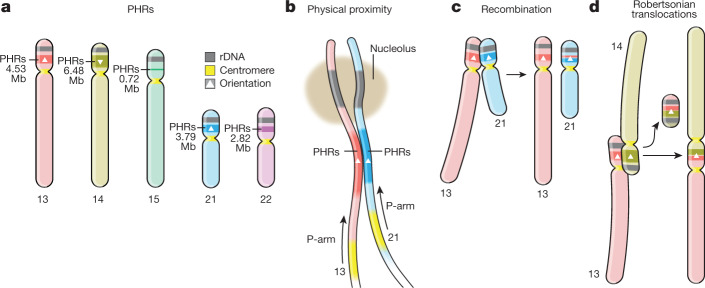
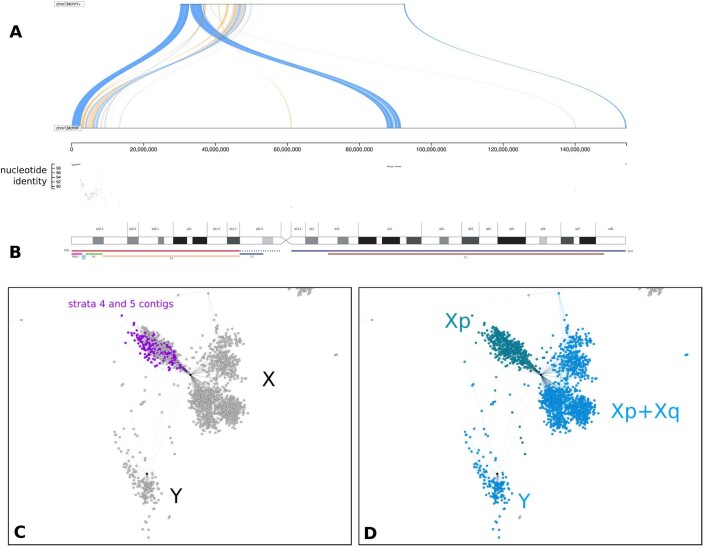
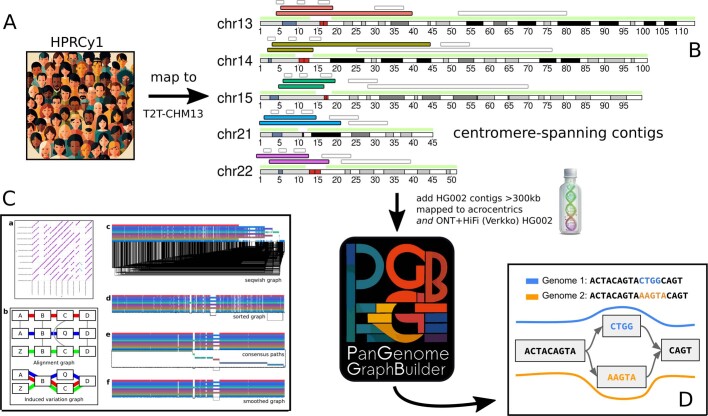
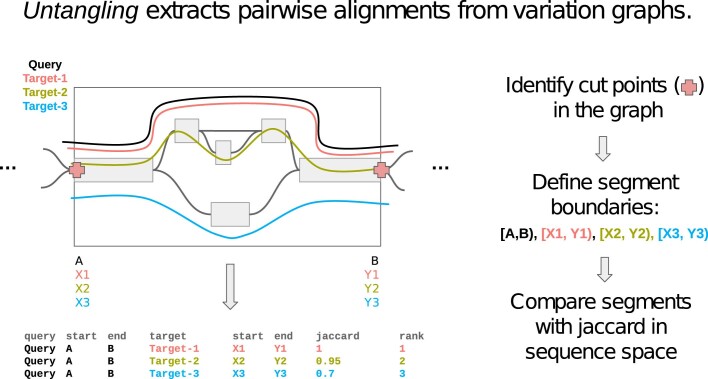
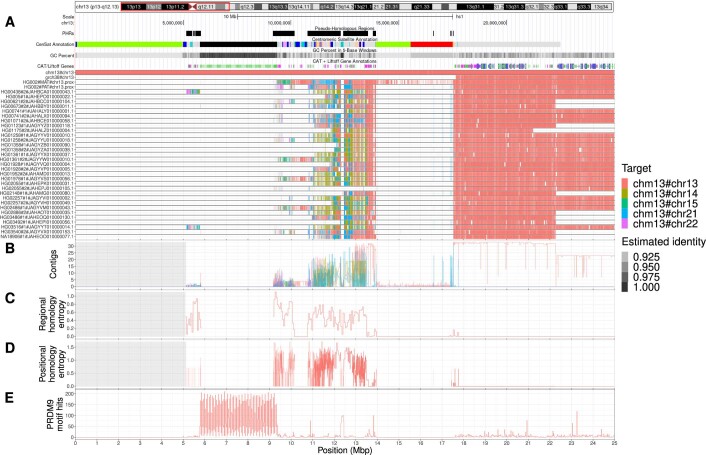
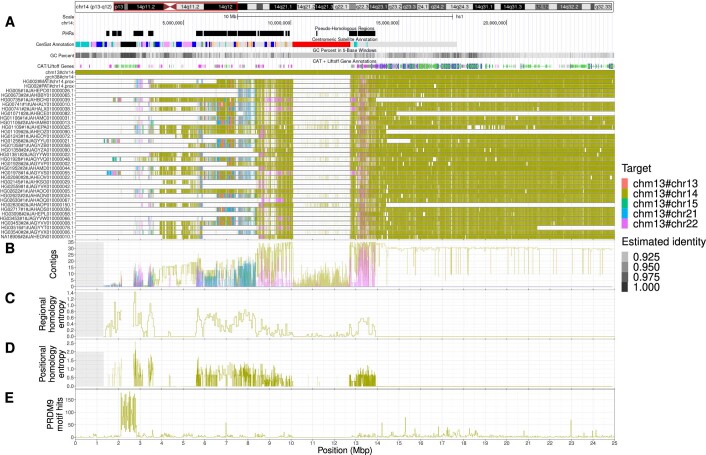
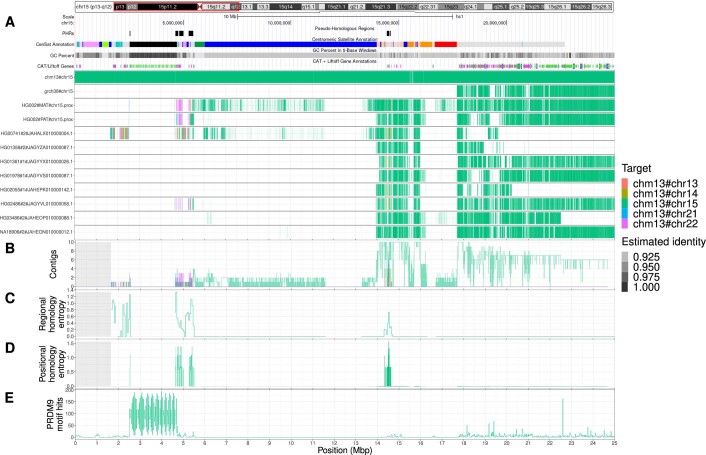
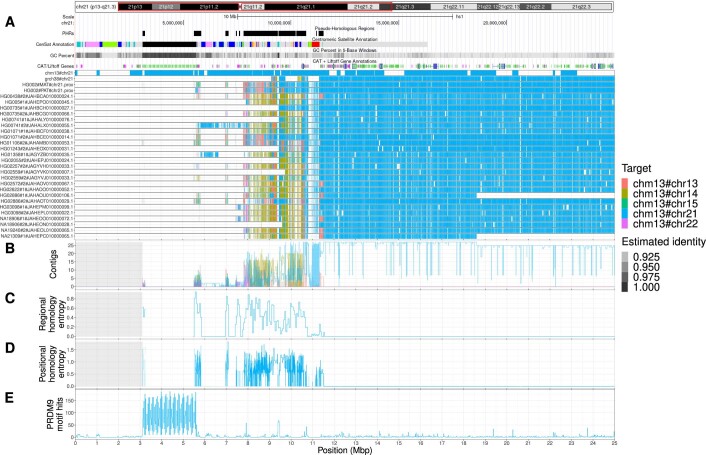
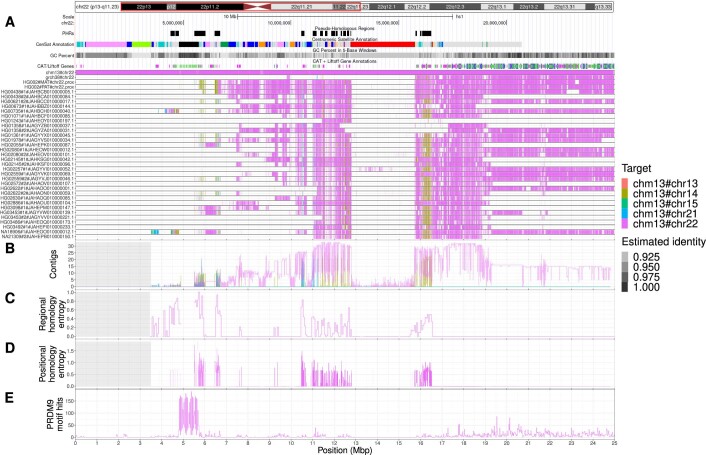
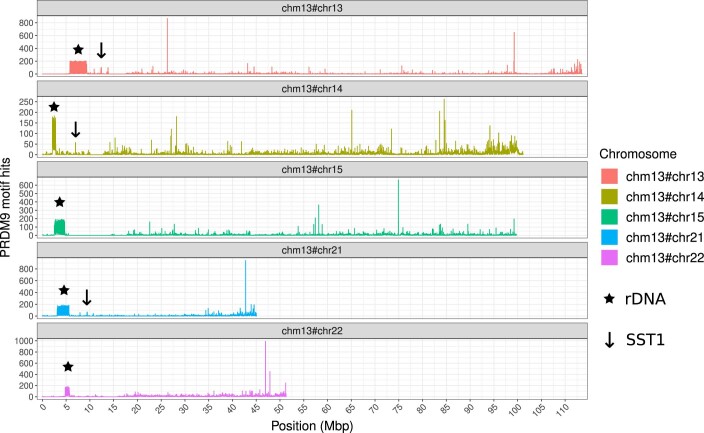
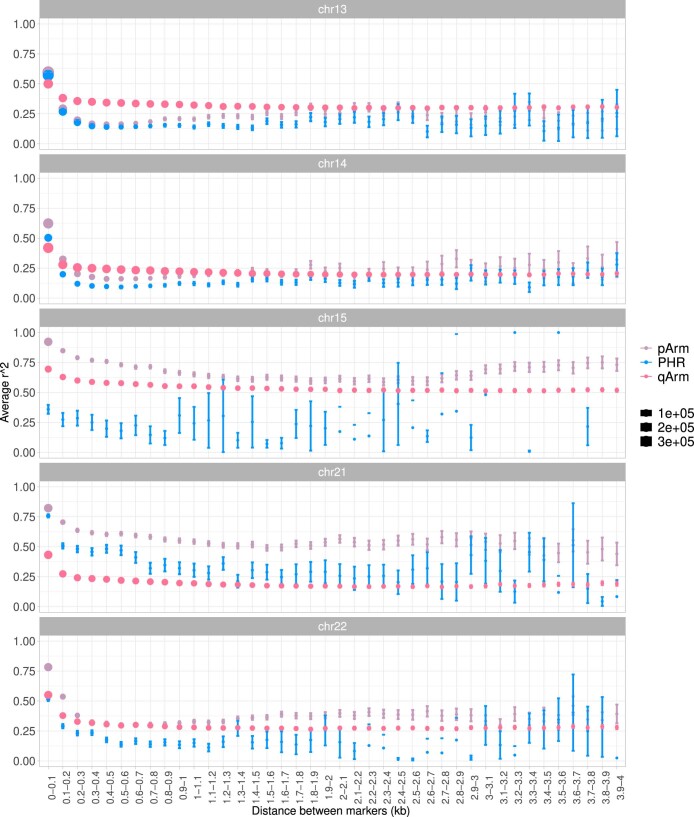
The short arms of the human acrocentric chromosomes 13, 14, 15, 21 and 22 (SAACs) share large homologous regions, including ribosomal DNA repeats and extended segmental duplications1,2. Although the resolution of these regions in the first complete assembly of a human genome-the Telomere-to-Telomere Consortium's CHM13 assembly (T2T-CHM13)-provided a model of their homology3, it remained unclear whether these patterns were ancestral or maintained by ongoing recombination exchange. Here we show that acrocentric chromosomes contain pseudo-homologous regions (PHRs) indicative of recombination between non-homologous sequences. Utilizing an all-to-all comparison of the human pangenome from the Human Pangenome Reference Consortium4 (HPRC), we find that contigs from all of the SAACs form a community. A variation graph5 constructed from centromere-spanning acrocentric contigs indicates the presence of regions in which most contigs appear nearly identical between heterologous acrocentric chromosomes in T2T-CHM13. Except on chromosome 15, we observe faster decay of linkage disequilibrium in the pseudo-homologous regions than in the corresponding short and long arms, indicating higher rates of recombination6,7. The pseudo-homologous regions include sequences that have previously been shown to lie at the breakpoint of Robertsonian translocations8, and their arrangement is compatible with crossover in inverted duplications on chromosomes 13, 14 and 21. The ubiquity of signals of recombination between heterologous acrocentric chromosomes seen in the HPRC draft pangenome suggests that these shared sequences form the basis for recurrent Robertsonian translocations, providing sequence and population-based confirmation of hypotheses first developed from cytogenetic studies 50 years ago9.


Conflict of interest statement

The authors declare no competing interests.

Figures

Fig. 1
Fig. 1. Community detection in the HPRCy1 pangenome.
a, The reduced all-to-all mapping graph of HPRCy1 against itself, with contigs represented as nodes and mappings as edges. Colours distinguish the acrocentric or sex chromosome to which each contig was assigned by competitive mapping against T2T-CHM13 and GRCh38, with text labels indicating the chromosome for each visual cluster. b, A close-up view of the region indicated in a and d containing nearly all contigs that match acrocentric chromosomes. c, Results of community assignment on the mapping graph. The x-axis shows the chromosome to which contigs belong, based on competitive mapping to T2T-CHM13 and GRCh38; the y-axis indicates the community, which is named according to the chromosome that contributes the largest number of contigs to it. In the squares, the numbers indicate how many contigs belong each specific chromosome and community and the shade indicates the percentage of the total assembly sequence present in the set. The sex chromosomes and the acrocentric chromosomes participate in the only clusters that mix many (more than 100) contigs belonging to different chromosomes. d, The reduced homology mapping graph in a, coloured according to community assignment (colours do not correlate with those in a or b). The p-arms of chr. 13, chr. 14 and chr. 15, and all of chr. 21 and chr. 22 form one community, and chr. Y and most of chr. X form another.
Fig. 2
Fig. 2. The acro-PVG derived from the HPRCy1 assembly.
a, The major component of the acro-PVG, shown with nodes in T2T-CHM13 chromosomes labelled with the colour scheme from Fig. 1a. The acrocentric q-arms are almost completely separated, whereas the p-arms unite in a tangle adjacent to the rDNA array. b, A close-up view of the SAAC junction, showing the separation of centromeric high-order repeats of chr. 15 (HOR_15_4) from the other chromosomes, whereas chr. 13 and chr. 21, and chr. 14 and chr. 22 share substantial homology in their arrays, which causes them to collapse in the PVG. A few assemblies span the rDNA array into its distal junction, which presents as a single homologous region across all chromosomes, and then fray into diverse sequences visible as tips in the top left. c, Closer view of the outlined region in b, focusing on the segmentally duplicated core centred in the SST1 array and the rDNA arrays, as labelled in T2T-CHM13. The highlighted region around the SST1 array is in the same orientation on T2T-CHM13 chr. 13p11.2 and chr. 21p11.2, and is inverted on chr. 14p11.2; these 3 regions have a pairwise identity of more than 99%.
Fig. 3
Fig. 3. Characteristics of the PHRs of acrocentric chromosomes.
a, We focus on the first 25 Mb of chr. 13, shown here as a red box over T2T-CHM13 cytobands. PHRs are highlighted relative to T2T-CHM13 genome annotations for centromere and satellite repeats (CenSat annotation), GC percentage and genes (CAT/Liftoff genes). Top, regions of interest described in the main text: rDNA, the SST1 array, the centromere and q-arm. Bottom, relative homology mosaics based on the T2T-CHM13 assembly for each chr. 13-matched contig from HPRCy1-acro, with colours indicating the most similar reference chromosome (target). b,c,d, Aggregated untangle results in the SAACs. b, The count of HPRCy1 q-arm-anchored contigs mapping to each acrocentric chromosome (Contigs) aggregated by target chromosome and (c) the regional (50 kb) untangle entropy metric (Regional homology entropy) computed over the contigs’ untangling relative to T2T-CHM13. d, By considering the multiple untangling of each HPRCy1-acro contig, we develop a point-wise metric that captures diversity in homology patterns relative to T2T-CHM13 (Positional homology entropy), leading to our definition of the PHRs. e, The patterns of homology mosaicism suggest ongoing recombination exchange in the SAACs. A scan over T2T-CHM13 reveals that the rDNA and SST1 array units are enriched for PRDM9 binding motifs, and thus may host frequent double-stranded breaks during meiosis. In bd, the grey background indicates regions with missing data due to the lack of non-T2T-CHM13 contigs.
Fig. 4
Fig. 4. PHRs of chr. 13, chr. 14 and chr. 21, centred on the SST1 array.
a, Maximum likelihood phylogenetic analysis of SST1 full-length elements indicates a recent homogenization process of acrocentric arrays. Coloured circles next to chromosome labels indicate individual monomers retrieved from the T2T-CHM13 assembly. Coloured triangles indicate SST1 full-length monomers retrieved from the HG002 chr. Y assembly. Partial or chimeric monomers flanking chr. 13, chr. 14 and chr. 21 arrays (located around 250 kb from the main array) are labelled as open circles or squares, respectively, coloured according to the corresponding chromosome. b, Schematic representation of SST1 consensus alignments, indicating a deletion that is present only in the SST1 unit from arrays on chr. 13, chr. 14 and chr. 21. c, Multiple untangling of T2T-CHM13, HG002-Verkko haplotypes and HPRCy1-acro contigs versus T2T-CHM13. Three of the five acrocentric chromosomes are represented. The degree of transparency indicates the estimated identity of the mappings. All mappings above 90% estimated pairwise identity are shown. To enable the display of simultaneous hits to all acrocentric regions, each grouping shows the first three best alternative mappings. SST1 arrays described in a are at the centre of a PHR that displays chequerboard patterns indicative of recombination between heterologous acrocentric chromosomes (black arrows link the SST1 arrays in all panels). These patterns are less common on chr. 15 and chr. 22 (Supplementary Figs. 20 and 22). d, The PHRs on T2T-CHM13 (yellow and light blue) in relation to BACs localized cytogenetically to recurrent chr. 14–chr. 21 ROB breakpoints. BACs shown in green are found in dicentric Robertsonian chromosomes, whereas those in red are not. Chr. 14 is shown in an inverted orientation aligned to chr. 21 at the breakpoint region suggested experimentally. In a transparent overlay, we propose a retained dicentric chromosome (14+21 ROB, green) and lost (red) products of the studied recurrent translocations.
Fig. 5
Fig. 5. The PHRs of human acrocentric chromosomes.
a, PHRs are found on the rDNA-proximal regions of the SAACs chr. 13, chr. 14, chr. 15, chr. 21 and chr. 22. b, PHRs physically co-locate owing to their proximity to the nucleolar organizing regions and rDNA, encouraging sequence exchange. b, Patterns of sequence similarity observed in the PHRs indicate ongoing recombination exchange between heterologous chromosomes, in particular chr. 13, chr. 14 and chr. 21, which may be mediated by both non-crossover recombination or crossover of the telomeric ends of heterologous chromosomes. d, The PHR surrounding the SST1 arrays on chr. 13, chr. 14 and chr. 21 is nearly identical on all three chromosomes, but is typically inverted on chr. 14 relative to chr. 13 and chr. 21 (triangles). Owing to the inversion, crossover type recombination between PHRs in chr. 14 and chr. 13 or chr. 21 produce an ROB.
Extended Data Fig. 1
Extended Data Fig. 1. (A) Evolutionary strata 5 and 4.
Visualization with Saffire (https://mrvollger.github.io/SafFire/) of the alignment between T2T-CHM13 X and Y reveals that strata 5 and 4 feature low identity (~90%), numerous inversions, and some rearrangements; (B) X chromosome ideogram according to. On the bottom, its evolutionary domains: the X-added region (XAR), the X-conserved region (XCR; dotted region in proximal Xp does not appear to be part of the XCR), the pseudoautosomal region PAR1, and evolutionary strata S5–S1. (C) The reduced all-to-all mapping graph of HPRCy1 versus itself, with contigs represented as nodes and mappings as edges. In red contigs covering the evolutionary strata 5 and 4 on chromosome X; (D) Coloring the reduced homology mapping graph in C with community assignments. Panels C and D use the same layout as Fig. 1 but focus only on the X and Y region of the visualization.
Extended Data Fig. 2
Extended Data Fig. 2. An overview of our approach to build a PVG for HPRCy1 contigs that can be anchored to a specific acrocentric q-arm.
(A) As input, we take the entire HPRCy1 and map it to T2T-CHM13. (B) This yields mappings to acrocentric chromosomes, which we filter to select contigs that map across the centromeres (red cytobands) between non-centromeric regions (over-labeled green). We include two HG002 assemblies based on standard HiFi (from HPRCy1) and on both HiFi and ONT data (from Verkko). (C) We then apply PGGB to build a PVG from the HPRCy1-acro collection. PGGB first obtains an all-to-all alignment of the input (C.a.), which is converted to a variation graph with SEQWISH (C.b.), then normalized with sorting and multiple sequence alignment steps in SMOOTHXG (C.c-f). (D) The resulting PVG expresses genomes as paths, or walks, through a common sequence graph. This model thus contains all input sequences and their relative alignments to all others—in the example we see a CTGG/AAGTA block substitution between genomes 1 and 2.
Extended Data Fig. 3
Extended Data Fig. 3. Scheme of the graph untangling.
We applied ODGI UNTANGLE to obtain a mapping from segments of all PVG paths onto T2T-CHM13. The segmentation cuts the graph into regular-sized regions whose boundaries occur at structural variant breakpoints. For each query subpath through a graph segment, we use a Jaccard metric over the sequence space of the subpaths to find the best-matching reference segment.
Extended Data Fig. 4
Extended Data Fig. 4. Characteristics of the pseudo-homologous regions of acrocentric chromosomes on chromosome 13.
(A) We focus on the first 25 Mbp of chromosome 13, shown here as a red box over T2T-CHM13 cytobands. Pseudo-homologous regions (PHRs), where diverse sets of acrocentric chromosomes recombine, are highlighted relative to T2T-CHM13 genome annotations for repeats, GC percentage, and genes. Above, we indicate regions of interest described in the main text: rDNA, SST1 array, centromere, and q-arm. Below, we show T2T-CHM13-relative homology mosaics for each chromosome 13 matched contig from HPRCy1-acro, with the most-similar reference chromosome at each region shown using the given colors (Target). (B) Aggregated untangle results in the SAACs. For each acrocentric chromosome, we show the count of its HPRCy1 q-arm-anchored contigs mapping itself and all other acrocentrics (Contigs), (C) as well as the regional (50kbp) untangle entropy metric (Regional homology entropy) computed over the contigs’ T2T-CHM13-relative untanglings. (D) By considering the multiple untangling of each HPRCy1-acro contig, we develop a point-wise metric that captures diversity in T2T-CHM13-relative homology patterns (Positional homology entropy), leading to our definition of the PHRs. (E) The patterns of homology mosaicism suggest ongoing recombination exchange in the SAACs. A scan over T2T-CHM13 reveals that the rDNA units are enriched for PRDM9 binding motifs, and thus may host frequent double stranded breaks during meiosis. In (B-D) a gray background indicates regions with missing data due to the lack of non-T2T-CHM13 contigs. We provide the Centromeric Satellite Annotation (CenSat Annotation) track legend in Extended Data Table 1.
Extended Data Fig. 5
Extended Data Fig. 5. Characteristics of the pseudo-homologous regions of acrocentric chromosomes on chromosome 14.
(A) We focus on the first 25 Mbp of chromosome 14, shown here as a red box over T2T-CHM13 cytobands. Pseudo-homologous regions (PHRs), where diverse sets of acrocentric chromosomes recombine, are highlighted relative to T2T-CHM13 genome annotations for repeats, GC percentage, and genes. Above, we indicate regions of interest described in the main text: rDNA, SST1 array, centromere, and q-arm. Below, we show T2T-CHM13-relative homology mosaics for each chromosome 13 matched contig from HPRCy1-acro, with the most-similar reference chromosome at each region shown using the given colors (Target). (B) Aggregated untangle results in the SAACs. For each acrocentric chromosome, we show the count of its HPRCy1 q-arm-anchored contigs mapping itself and all other acrocentrics (Contigs), (C) as well as the regional (50kbp) untangle entropy metric (Regional homology entropy) computed over the contigs’ T2T-CHM13-relative untanglings. (D) By considering the multiple untangling of each HPRCy1-acro contig, we develop a point-wise metric that captures diversity in T2T-CHM13-relative homology patterns (Positional homology entropy), leading to our definition of the PHRs. (E) The patterns of homology mosaicism suggest ongoing recombination exchange in the SAACs. A scan over T2T-CHM13 reveals that the rDNA units are enriched for PRDM9 binding motifs, and thus may host frequent double stranded breaks during meiosis. In (B-D) a gray background indicates regions with missing data due to the lack of non-T2T-CHM13 contigs. We provide the Centromeric Satellite Annotation (CenSat Annotation) track legend in Extended Data Table 1.
Extended Data Fig. 6
Extended Data Fig. 6. Characteristics of the pseudo-homologous regions of acrocentric chromosomes on chromosome 15.
(A) We focus on the first 25 Mbp of chromosome 15, shown here as a red box over T2T-CHM13 cytobands. Pseudo-homologous regions (PHRs), where diverse sets of acrocentric chromosomes recombine, are highlighted relative to T2T-CHM13 genome annotations for repeats, GC percentage, and genes. Above, we indicate regions of interest described in the main text: rDNA, SST1 array, centromere, and q-arm. Below, we show T2T-CHM13-relative homology mosaics for each chromosome 13 matched contig from HPRCy1-acro, with the most-similar reference chromosome at each region shown using the given colors (Target). (B) Aggregated untangle results in the SAACs. For each acrocentric chromosome, we show the count of its HPRCy1 q-arm-anchored contigs mapping itself and all other acrocentrics (Contigs), (C) as well as the regional (50kbp) untangle entropy metric (Regional homology entropy) computed over the contigs’ T2T-CHM13-relative untanglings. (D) By considering the multiple untangling of each HPRCy1-acro contig, we develop a point-wise metric that captures diversity in T2T-CHM13-relative homology patterns (Positional homology entropy), leading to our definition of the PHRs. (E) The patterns of homology mosaicism suggest ongoing recombination exchange in the SAACs. A scan over T2T-CHM13 reveals that the rDNA units are enriched for PRDM9 binding motifs, and thus may host frequent double stranded breaks during meiosis. In (B-D) a gray background indicates regions with missing data due to the lack of non-T2T-CHM13 contigs. We provide the Centromeric Satellite Annotation (CenSat Annotation) track legend in Extended Data Table 1.
Extended Data Fig. 7
Extended Data Fig. 7. Characteristics of the pseudo-homologous regions of acrocentric chromosomes on chromosome 21.
(A) We focus on the first 25 Mbp of chromosome 21, shown here as a red box over T2T-CHM13 cytobands. Pseudo-homologous regions (PHRs), where diverse sets of acrocentric chromosomes recombine, are highlighted relative to T2T-CHM13 genome annotations for repeats, GC percentage, and genes. Above, we indicate regions of interest described in the main text: rDNA, SST1 array, centromere, and q-arm. Below, we show T2T-CHM13-relative homology mosaics for each chromosome 13 matched contig from HPRCy1-acro, with the most-similar reference chromosome at each region shown using the given colors (Target). (B) Aggregated untangle results in the SAACs. For each acrocentric chromosome, we show the count of its HPRCy1 q-arm-anchored contigs mapping itself and all other acrocentrics (Contigs), (C) as well as the regional (50kbp) untangle entropy metric (Regional homology entropy) computed over the contigs’ T2T-CHM13-relative untanglings. (D) By considering the multiple untangling of each HPRCy1-acro contig, we develop a point-wise metric that captures diversity in T2T-CHM13-relative homology patterns (Positional homology entropy), leading to our definition of the PHRs. (E) The patterns of homology mosaicism suggest ongoing recombination exchange in the SAACs. A scan over T2T-CHM13 reveals that the rDNA units are enriched for PRDM9 binding motifs, and thus may host frequent double stranded breaks during meiosis. In (B-D) a gray background indicates regions with missing data due to the lack of non-T2T-CHM13 contigs. We provide the Centromeric Satellite Annotation (CenSat Annotation) track legend in Extended Data Table 1.
Extended Data Fig. 8
Extended Data Fig. 8. Characteristics of the pseudo-homologous regions of acrocentric chromosomes on chromosome 22.
(A) We focus on the first 25 Mbp of chromosome 22, shown here as a red box over T2T-CHM13 cytobands. Pseudo-homologous regions (PHRs), where diverse sets of acrocentric chromosomes recombine, are highlighted relative to T2T-CHM13 genome annotations for repeats, GC percentage, and genes. Above, we indicate regions of interest described in the main text: rDNA, SST1 array, centromere, and q-arm. Below, we show T2T-CHM13-relative homology mosaics for each chromosome 13 matched contig from HPRCy1-acro, with the most-similar reference chromosome at each region shown using the given colors (Target). (B) Aggregated untangle results in the SAACs. For each acrocentric chromosome, we show the count of its HPRCy1 q-arm-anchored contigs mapping itself and all other acrocentrics (Contigs), (C) as well as the regional (50kbp) untangle entropy metric (Regional homology entropy) computed over the contigs’ T2T-CHM13-relative untanglings. (D) By considering the multiple untangling of each HPRCy1-acro contig, we develop a point-wise metric that captures diversity in T2T-CHM13-relative homology patterns (Positional homology entropy), leading to our definition of the PHRs. (E) The patterns of homology mosaicism suggest ongoing recombination exchange in the SAACs. A scan over T2T-CHM13 reveals that the rDNA units are enriched for PRDM9 binding motifs, and thus may host frequent double stranded breaks during meiosis. In (B-D) a gray background indicates regions with missing data due to the lack of non-T2T-CHM13 contigs. We provide the Centromeric Satellite Annotation (CenSat Annotation) track legend in Extended Data Table 1.
Extended Data Fig. 9
Extended Data Fig. 9. PRDM9 binding motif in the acrocentric chromosomes.
For each T2T-CHM13 acrocentric chromosome, we show the number of human PRDM9 binding motif hits present in windows 20 kbps long.
Extended Data Fig. 10
Extended Data Fig. 10. Linkage disequilibrium decay with distance between markers per acrocentric chromosome.
Each LD decay plot shows the p-arm (purple), q-arm (pink), and PHR (blue) mean r2 (points) and 95% confidence intervals (error bars) for marker pairs binned by the given inter-marker distance range (x-axis). Dot size is proportional to the number of pairwise comparisons within a bin. LD decay is faster in PHRs for chromosomes 13, 14, and 22. No notable LD decay is observed in PHRs for chromosome 15.

Comment in

Similar articles

Cited by

References

    1. Floutsakou I, et al. The shared genomic architecture of human nucleolar organizer regions. Genome Res. 2013;23:2003–2012. doi: 10.1101/gr.157941.113. - DOI - PMC - PubMed
    1. van Sluis M, et al. Human NORs, comprising rDNA arrays and functionally conserved distal elements, are located within dynamic chromosomal regions. Genes Dev. 2019;33:1688–1701. doi: 10.1101/gad.331892.119. - DOI - PMC - PubMed
    1. Nurk S, et al. The complete sequence of a human genome. Science. 2022;376:44–53. doi: 10.1126/science.abj6987. - DOI - PMC - PubMed
    1. Liao, W.-W. et al. A draft human pangenome reference. Nature10.1038/s41586-023-05896-x (2023). - PMC - PubMed
    1. Garrison E, et al. Variation graph toolkit improves read mapping by representing genetic variation in the reference. Nat. Biotechnol. 2018;36:875–879. doi: 10.1038/nbt.4227. - DOI - PMC - PubMed

Publication types