. 2023 May 10;15(1):35.
doi: 10.1186/s13073-023-01184-5.

High level of complexity and global diversity of the 3q29 locus revealed by optical mapping and long-read sequencing

Affiliations

High level of complexity and global diversity of the 3q29 locus revealed by optical mapping and long-read sequencing

Feyza Yilmaz et al. Genome Med. .

Abstract

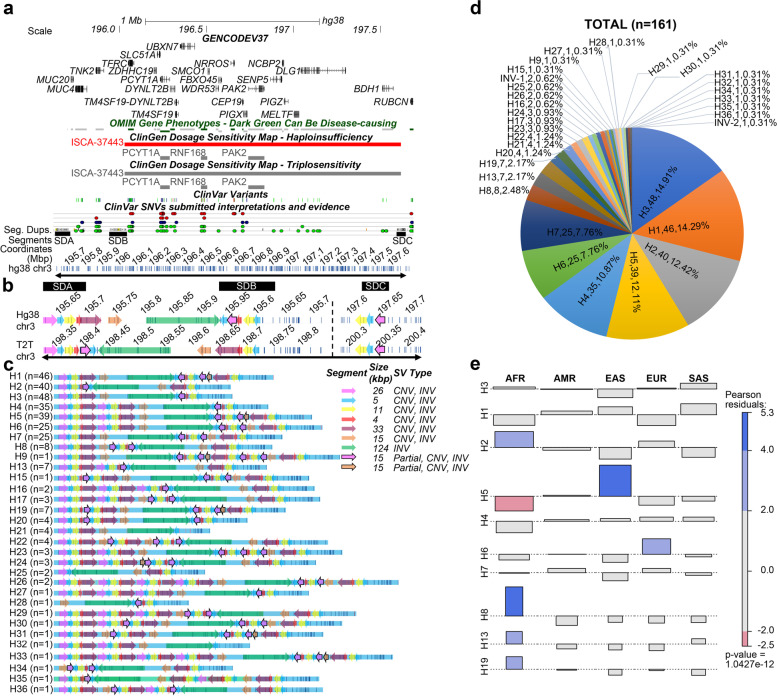
Background: High sequence identity between segmental duplications (SDs) can facilitate copy number variants (CNVs) via non-allelic homologous recombination (NAHR). These CNVs are one of the fundamental causes of genomic disorders such as the 3q29 deletion syndrome (del3q29S). There are 21 protein-coding genes lost or gained as a result of such recurrent 1.6-Mbp deletions or duplications, respectively, in the 3q29 locus. While NAHR plays a role in CNV occurrence, the factors that increase the risk of NAHR at this particular locus are not well understood.

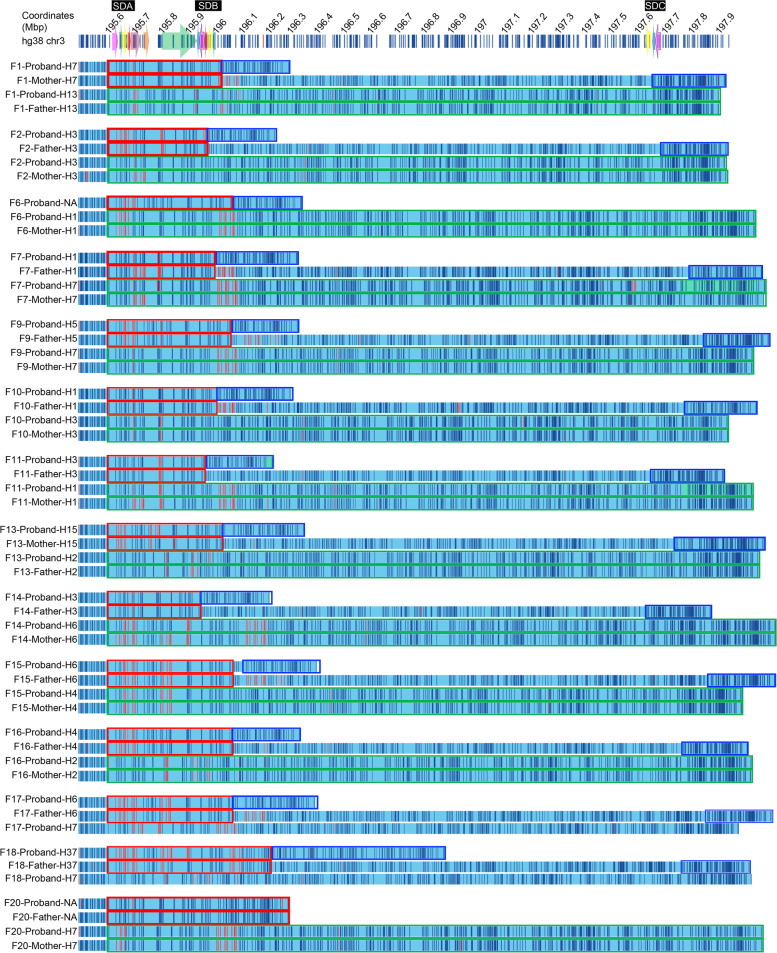
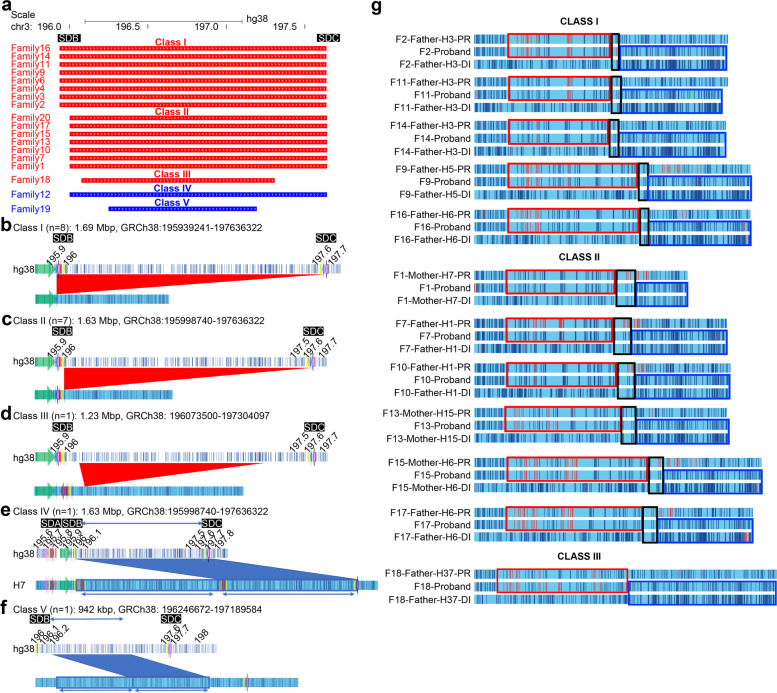
Methods: We employed an optical genome mapping technique to characterize the 3q29 locus in 161 unaffected individuals, 16 probands with del3q29S and their parents, and 2 probands with the 3q29 duplication syndrome (dup3q29S). Long-read sequencing-based haplotype resolved de novo assemblies from 44 unaffected individuals, and 1 trio was used for orthogonal validation of haplotypes and deletion breakpoints.

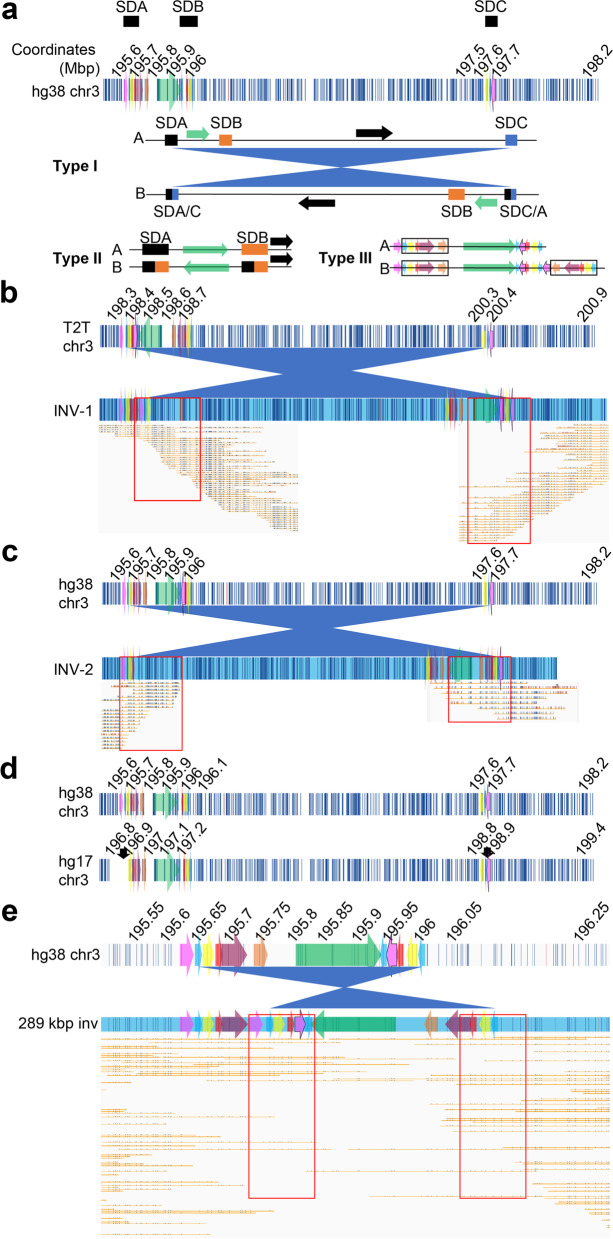
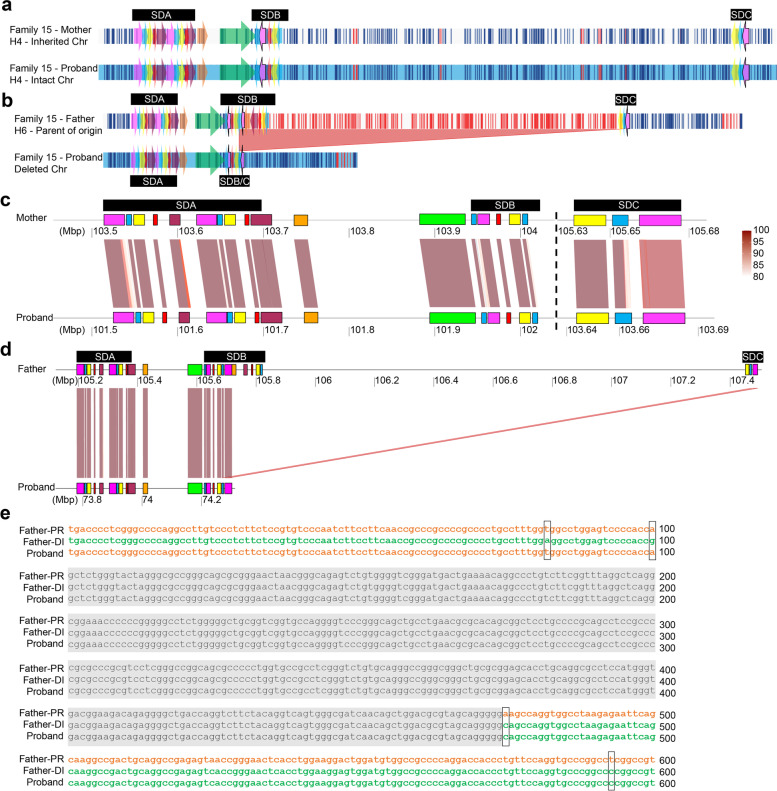
Results: In total, we discovered 34 haplotypes, of which 19 were novel haplotypes. Among these 19 novel haplotypes, 18 were detected in unaffected individuals, while 1 novel haplotype was detected on the parent-of-origin chromosome of a proband with the del3q29S. Phased assemblies from 44 unaffected individuals enabled the orthogonal validation of 20 haplotypes. In 89% (16/18) of the probands, breakpoints were confined to paralogous copies of a 20-kbp segment within the 3q29 SDs. In one del3q29S proband, the breakpoint was confined to a 374-bp region using long-read sequencing. Furthermore, we categorized del3q29S cases into three classes and dup3q29S cases into two classes based on breakpoints. Finally, we found no evidence of inversions in parent-of-origin chromosomes.

Conclusions: We have generated the most comprehensive haplotype map for the 3q29 locus using unaffected individuals, probands with del3q29S or dup3q29S, and available parents, and also determined the deletion breakpoint to be within a 374-bp region in one proband with del3q29S. These results should provide a better understanding of the underlying genetic architecture that contributes to the etiology of del3q29S and dup3q29S.

Keywords: 3q29; Copy number variant(s); Genomic disorders; NAHR; Schizophrenia; Structural variations.


Conflict of interest statement

The authors declare that they have no competing interests.

Figures

Fig. 1
Fig. 1
The segment structure of GRCh38 3q29 region and haplotypes identified in this study. a 3q29 locus with SDA, SDB, SDC, OMIM Gene Phenotypes, ClinGen Dosage Sensitivity Map—Haploinsufficiency, ClinGen Dosage Sensitivity Map—Triplosensitivity, ClinVar Variants, ClinVar SNVs, and Segmental Duplications are represented as Tracks. The 3q29 GRCh38 in silico map is represented in the last track. ClinVar Track: red dots, pathogenic; dark blue dots, variants of uncertain significance; green dots, benign variants. b 3q29 segments of GRCh38 and T2T with SDA, SDB, and SDC represented as black boxes on top overlaid on the in silico maps (white background with vertical blue lines). Dashed line: the unique region between SDB and SDC. Black arrows in panels a and b—the region included in our analyses. c The structure and prevalence of 13 known haplotypes identified among our samples (H1-H9, H13, H15-H17) and 18 novel haplotypes, which were ordered by frequency (H19-H36). Each colored arrow represents 3q29 segments. Partial, partial copy of 32q9 segments; CNV, copy number polymorphism; INV, inversion. d Prevalence of the 3q29 haplotypes represented in unaffected individuals. e Cohen-Friendly association plot depicting the relationship between haplotypes and populations. If the observed count is greater than expected, the rectangle rises above the baseline and is colored in blue. If the observed count is less than expected, the rectangle falls below the baseline and is colored in red
Fig. 2
Fig. 2
Inversions identified from the 1000GP and CIAPM samples. a The structure of in silico hg38 3q29 locus represented at the top with white background and dark vertical lines. The SD blocks were presented above, 3q29 segments (colored arrows) were overlaid on. Three types of inversions, Type I, Type II, and Type III, detected from this study were presented below the in silico map. Type I represents inversions > 2 mbp in size, Type II represents inversions ~ 289 kbp in size, and Type III represents inverted duplications of five 3q29 segments (black rectangles). Black, orange and blue boxes: 3q29 SD blocks; green arrow: 3q29 segment; black arrow: unique region between SDB and SDC. Strand A at the top, displays reference structures and strand B below represents inverted structures. b Upper rectangle with white background and vertical lines represents chm13/T2T in silico map of the 3q29 locus. The rectangle at the bottom represents the structure of INV-1 (~ 2.03 Mbp). Red rectangle: highlighting the molecules supporting the inversion breakpoints. c Upper rectangle with white background and vertical lines represents hg38 in silico map of the 3q29 locus. The rectangle at the bottom represents the structure of INV-2 (~ 2.13 Mbp). Red rectangle: highlighting the molecules supporting the inversion breakpoints. d hg38 and NCBI35/hg17 reference assemblies represented with white backgrounds and vertical blue lines. Black arrows in NCBI35/hg17 represent inversion breakpoints identified by Antonacci and colleagues [57]. Colored arrows in each panel represent 3q29 segments. e hg38 human genome reference assembly presented at the top and the 289-kbp inversion, including the 3q29 segments, represented at the bottom. The red rectangle highlights the molecules supporting the inversion breakpoints
Fig. 3
Fig. 3
Haplotype structures observed in 3q29 probands and their parents. Red—proximal region in deleted chromosome and proximal region in parent of origin chromosome. Blue—distal region in deleted chromosome and distal region in parent of origin chromosome. Green—intact chromosome in proband and chromosome of the parent which transmitted the intact chromosome. F, family
Fig. 4
Fig. 4
Breakpoint analysis in Family 15 proband. a OGM data representing the intact chromosome that was inherited from mother. b OGM data representing the parent of origin, Father, and deleted chromosome. Red shaded area represents the deleted region. c, d Homology plots generated using genoPlotR based on PacBio HiFi sequence data depicting the structure of the 3q29 locus: c in the inherited chromosome of the mother and chromosome of the proband. d in the parent of origin chromosome of the father and the deleted chromosome of the proband (deletion breakpoint junction: 74,235,310 to 74,299,419). e Sequence alignment of the proximal (orange font) and distal region (green font) of the parent-of-origin chromosome of the father to the deletion breakpoint sequence of the proband, likely generated by a the putative cross-over event happened during NAHR. PR, proximal; DI, distal; gray shaded area—breakpoint junction; black boxes—sequence variants identified in parent-of-origin and deleted chromosomes
Fig. 5
Fig. 5
Deletion and duplication breakpoint classes identified in our study. a Size and breakpoint location of deletion and duplication patients from the 3q29 Project. Red—3q29 deletion, blue—3q29 duplication. b–f The breakpoint structures of deletions in probands that were categorized as: b Class I. c Class II. d Class III, and the breakpoint structure of duplications in probands were categorized as: e Class IV. f Class V. Colored arrows represent the 3q29 segments. Red triangles—depicting the deleted region. Blue rectangles—depicting the duplicated region. g In silico maps of trios showing the NAHR region in each deletion breakpoint class. Red rectangles—proximal deletion region, blue rectangles—distal deletion region, green—intact chromosome in probands and the chromosomes inherited to the proband by the transmitting parent. PR—proximal region with respect to deletion, DI—distal region with respect to deletion

References

    1. Finucane BM, Ledbetter DH, Vorstman JA. Diagnostic genetic testing for neurodevelopmental psychiatric disorders: closing the gap between recommendation and clinical implementation. Curr Opin Genet Dev. 2021;68:1–8. - PMC - PubMed
    1. Lee JA, Lupski JR. Genomic rearrangements and gene copy-number alterations as a cause of nervous system disorders. Neuron. 2006;52(1):103–121. - PubMed
    1. Harel T, Lupski JR. Genomic disorders 20 years on-mechanisms for clinical manifestations. Clin Genet. 2018;93(3):439–449. - PubMed
    1. Osborne LR, Martindale D, Scherer SW, Shi X-M, Huizenga J, Heng HHQ, et al. Identification of Genes from a 500-kb Region at 7q11.23 That Is Commonly Deleted in Williams Syndrome Patients [Internet]. Genomics. 1996; 36. 328–36. 10.1006/geno.1996.0469. - PubMed
    1. Pober BR. Williams-Beuren Syndrome. N Engl J Med. 2010;362(3):239–252. - PubMed

Publication types