. 2023 May 11;14(1):78.
doi: 10.1186/s40104-023-00876-7.

The eQTL colocalization and transcriptome-wide association study identify potentially causal genes responsible for economic traits in Simmental beef cattle

Affiliations

The eQTL colocalization and transcriptome-wide association study identify potentially causal genes responsible for economic traits in Simmental beef cattle

Wentao Cai et al. J Anim Sci Biotechnol. .

Abstract

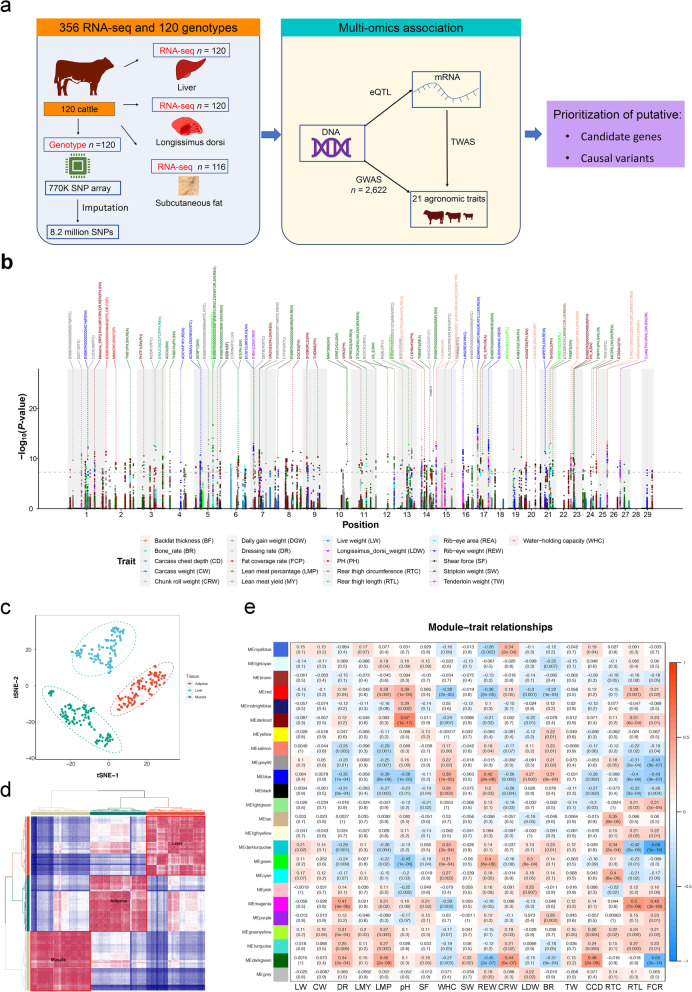
Background: A detailed understanding of genetic variants that affect beef merit helps maximize the efficiency of breeding for improved production merit in beef cattle. To prioritize the putative variants and genes, we ran a comprehensive genome-wide association studies (GWAS) analysis for 21 agronomic traits using imputed whole-genome variants in Simmental beef cattle. Then, we applied expression quantitative trait loci (eQTL) mapping between the genotype variants and transcriptome of three tissues (longissimus dorsi muscle, backfat, and liver) in 120 cattle.

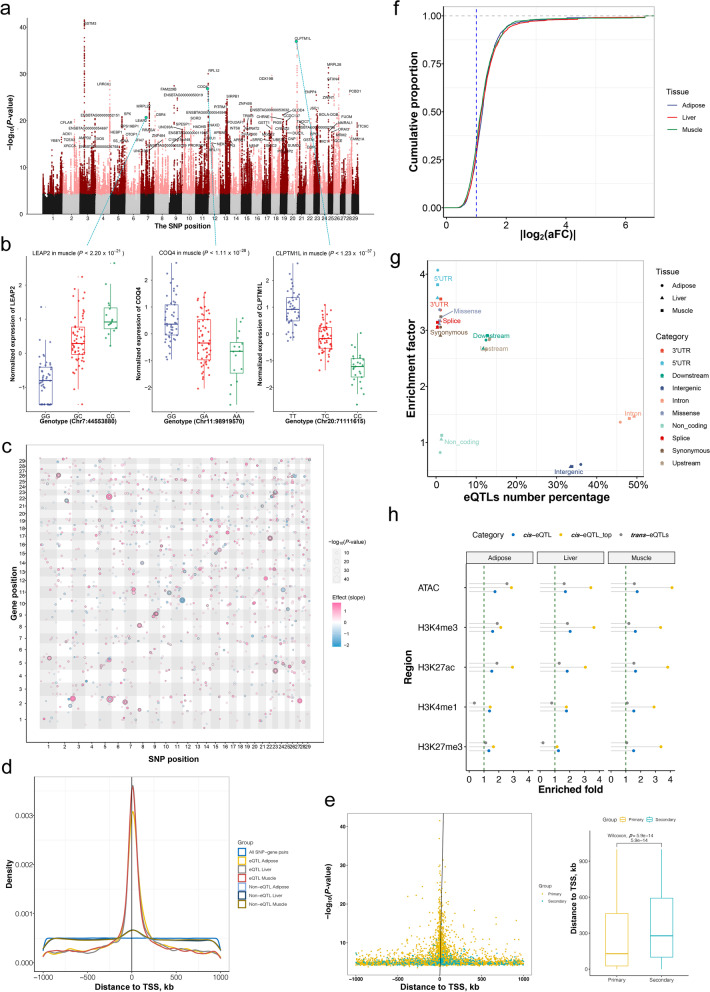
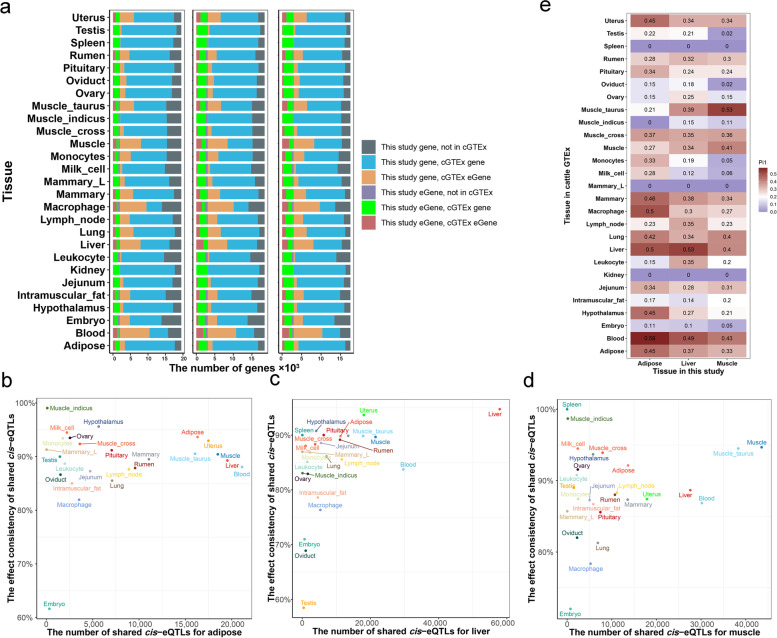
Results: We identified 1,580 association signals for 21 beef agronomic traits using GWAS. We then illuminated 854,498 cis-eQTLs for 6,017 genes and 46,970 trans-eQTLs for 1,903 genes in three tissues and built a synergistic network by integrating transcriptomics with agronomic traits. These cis-eQTLs were preferentially close to the transcription start site and enriched in functional regulatory regions. We observed an average of 43.5% improvement in cis-eQTL discovery using multi-tissue eQTL mapping. Fine-mapping analysis revealed that 111, 192, and 194 variants were most likely to be causative to regulate gene expression in backfat, liver, and muscle, respectively. The transcriptome-wide association studies identified 722 genes significantly associated with 11 agronomic traits. Via the colocalization and Mendelian randomization analyses, we found that eQTLs of several genes were associated with the GWAS signals of agronomic traits in three tissues, which included genes, such as NADSYN1, NDUFS3, LTF and KIFC2 in liver, GRAMD1C, TMTC2 and ZNF613 in backfat, as well as TIGAR, NDUFS3 and L3HYPDH in muscle that could serve as the candidate genes for economic traits.

Conclusions: The extensive atlas of GWAS, eQTL, fine-mapping, and transcriptome-wide association studies aid in the suggestion of potentially functional variants and genes in cattle agronomic traits and will be an invaluable source for genomics and breeding in beef cattle.

Keywords: Cattle; Colocalization; GWAS; TWAS; eQTL mapping.


Conflict of interest statement

The authors have declared no competing interests.

Figures

Fig. 1
Fig. 1
Study design and transcriptome associated with traits. a We investigated the molecular characteristics by profiling genotype, and mRNA from liver, muscle and adipose tissue of 120 Simmental cattle with important agronomic traits. We identified the promising candidate genes and causal variants using a multi-omics association strategy. b The Manhattan plot of 21 agronomic traits. Only significant variants and their nearby SNPs within up/downstream 100 kb are shown in the plot. The closest gene and associated traits of each sentinel SNP were labeled on the top. c Sample clustering using t-SNE based on gene expression levels. d Pearson correlation (heatmap) and hierarchical clustering (tree) of transcriptome profiles across 356 samples (rows/columns) show tissue-specific clustering (colors). e Correlation of gene co-expression modules with agronomic traits in muscle. Modules were denoted by different colors. Correlation of module eigengene with each agronomic trait displayed in the corresponding box (top: coefficient, bottom: P-value). The color of each box represents a positive correlation (red) or a negative correlation (blue)
Fig. 2
Fig. 2
eQTLs in three tissues. a Manhattan plot showing the nominal P-value (y-axis) for all cis-eQTLs in muscle. b The TPM normalized expression of LEAP2 with three genotypes. c Dot plot showing the locations, P-value, and effect sizes for all significant trans-eQTL in muscle. Variants and gene positions are shown on the x-axis and y-axis, respectively. Each dot was a significant trans-eQTLs (FDR < 0.05). The size of each dot represents the −log10 scaled P-values. The color of each dot represents the direction of the slope effect. d Distribution of cis-eQTLs around TSS. All SNP-gene pairs indicate all tested SNP-gene pairs. Non-eQTL indicates the top associated SNP for non-eGenes. e The distance of the most significant eVariant to the TSS of eGene in muscle. The primary signals (golden) and the secondary signals (blue) relative to TSS are shown using a point plot (left) and their absolute distances compare shown in the box plot (right). The Wilcoxon test is used to compute significance. f The absolute allelic fold change distribution for cis-eQTLs in three tissues. g The proportion and enrichment of cis-eQTLs in genome location. The enrichment factors are based on the number of cis-eQTLs in each region category divided by the expected number. h Enrichment of eQTLs in five chromatin states predicted from a tissue-matched cattle dataset. The x-axis represents the enriched fold
Fig. 3
Fig. 3
Cis-eQTL replication in cGTEx. a The overlapped eGene between this study and cGETx for adipose, liver and muscle tissue. b–d The allelic directions in adipose, liver, and muscle were highly consistent with the matched tissue of cGTEx. e Pairwise sharing patterns (π1 value) of cis-eQTL between three tissues of this study and 27 tissues/cell types of cGTEx
Fig. 4
Fig. 4
Tissue pattern and pleiotropic of eQTLs, and TWAS. a The number of eGenes overlap between tissues. b Pairwise sharing patterns of cis-eQTL (π1 value) across tissues. c The increased number of eGenes discovered by multi-tissue cis-eQTL analyses. d Locuszoom plots of the genetic signals regulating genes at cluster 10:64,961,096–65,908,904. The nominal P-values of all local variant-gene associations regarding C10H15orf48, bta-mir-147, and FERMT2 were shown. The colors of variants are based on their LD with the most significant eVariant. e The proportion of eQTLs (y-axis) with chromatin states using fine mapping eVariants, top significant eVariants and total eVariants. f Distribution of cis-H2. The solid line corresponds to all tested genes, while the dashed lines are cis-heritable genes. g Manhattan plot of TWAS between muscle gene expression and daily gain weight
Fig. 5
Fig. 5
The colocalization of eQTLs and GWAS loci. a Manhattan plot showing the colocalization results (H4 > 0.8) between eQTL and GWAS signals. The x-axis is the P-value of lead eQTLs (points) across traits (colors) in muscle. b Manhattan plot showing SMR P-value between GWAS signals and eQTLs in different traits (colors) and tissues (point shape). c An example of GWAS–eQTL colocalization for GARMD1C in adipose. The colors of variants are based on their LD with the most significant variant. d An example of GWAS–eQTL colocalization for TIGAR in muscle
Fig. 6
Fig. 6
The circos plot of multi-omics significant signatures. The four Manhattan plots with grey backgrounds from outside to inside indicate the significant signatures identified by GWAS, cis-eQTL Mapping, and TWAS. The results of GWAS-eQTL colocalization by coloc or SMR are shown between GWAS and eQTL Manhattan plot, which were labeled with gene name and tissue abbreviation after a colon (A: adipose, L: liver, M: muscle). The gene label colors and the dot colors of the eQTL Manhattan plot with green, hot pink, and purple represents adipose, liver, and muscle, respectively

References

    1. Hu ZL, Park CA, Reecy JM. Building a livestock genetic and genomic information knowledgebase through integrative developments of Animal QTLdb and CorrDB. Nucleic Acids Res. 2019;47(D1):D701–D710. doi: 10.1093/nar/gky1084. - DOI - PMC - PubMed
    1. Grisart B, Farnir F, Karim L, Cambisano N, Kim J-J, Kvasz A, et al. Genetic and functional confirmation of the causality of the DGAT1 K232A quantitative trait nucleotide in affecting milk yield and composition. Proc Natl Acad Sci U S A. 2004;101(8):2398–2403. doi: 10.1073/pnas.0308518100. - DOI - PMC - PubMed
    1. VanRaden PM, Tooker ME, O’Connell JR, Cole JB, Bickhart DM. Selecting sequence variants to improve genomic predictions for dairy cattle. Genet Sel Evol. 2017;49(1):32. doi: 10.1186/s12711-017-0307-4. - DOI - PMC - PubMed
    1. Peng S, Deyssenroth MA, Di Narzo AF, Cheng H, Zhang Z, Lambertini L, et al. Genetic regulation of the placental transcriptome underlies birth weight and risk of childhood obesity. PLoS Genet. 2018;14(12):e1007799. doi: 10.1371/journal.pgen.1007799. - DOI - PMC - PubMed
    1. de PaivaLopes K, Snijders GJL, Humphrey J, Allan A, Sneeboer MAM, Navarro E, et al. Genetic analysis of the human microglial transcriptome across brain regions, aging and disease pathologies. Nat Genet. 2022;54(1):4–17. doi: 10.1038/s41588-021-00976-y. - DOI - PMC - PubMed

LinkOut - more resources