. 2023 Nov;19(11):5185-5197.
doi: 10.1002/alz.13086. Epub 2023 May 11.

Retinal arterial Aβ40 deposition is linked with tight junction loss and cerebral amyloid angiopathy in MCI and AD patients

Affiliations

Retinal arterial Aβ40 deposition is linked with tight junction loss and cerebral amyloid angiopathy in MCI and AD patients

Haoshen Shi et al. Alzheimers Dement. 2023 Nov.

Abstract

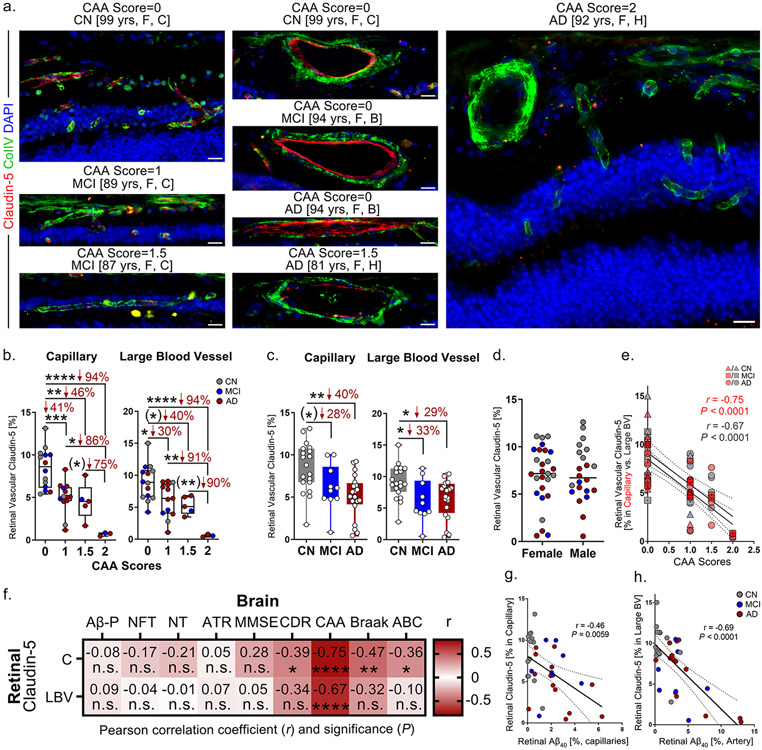
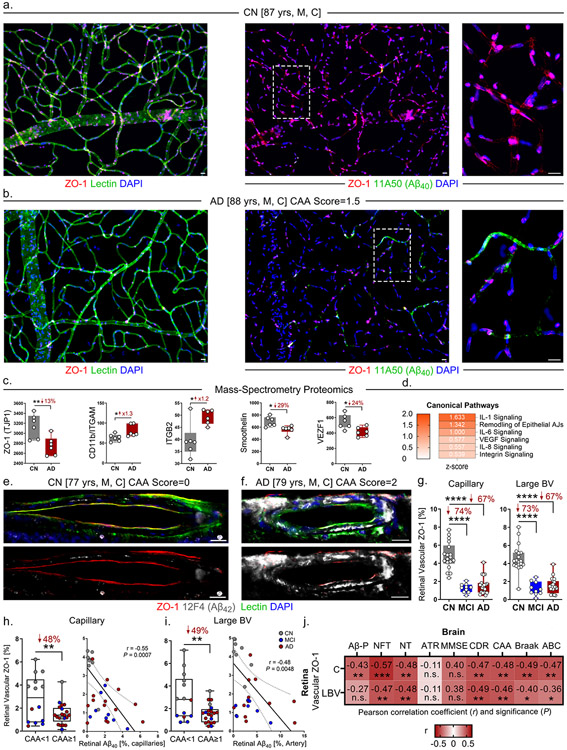
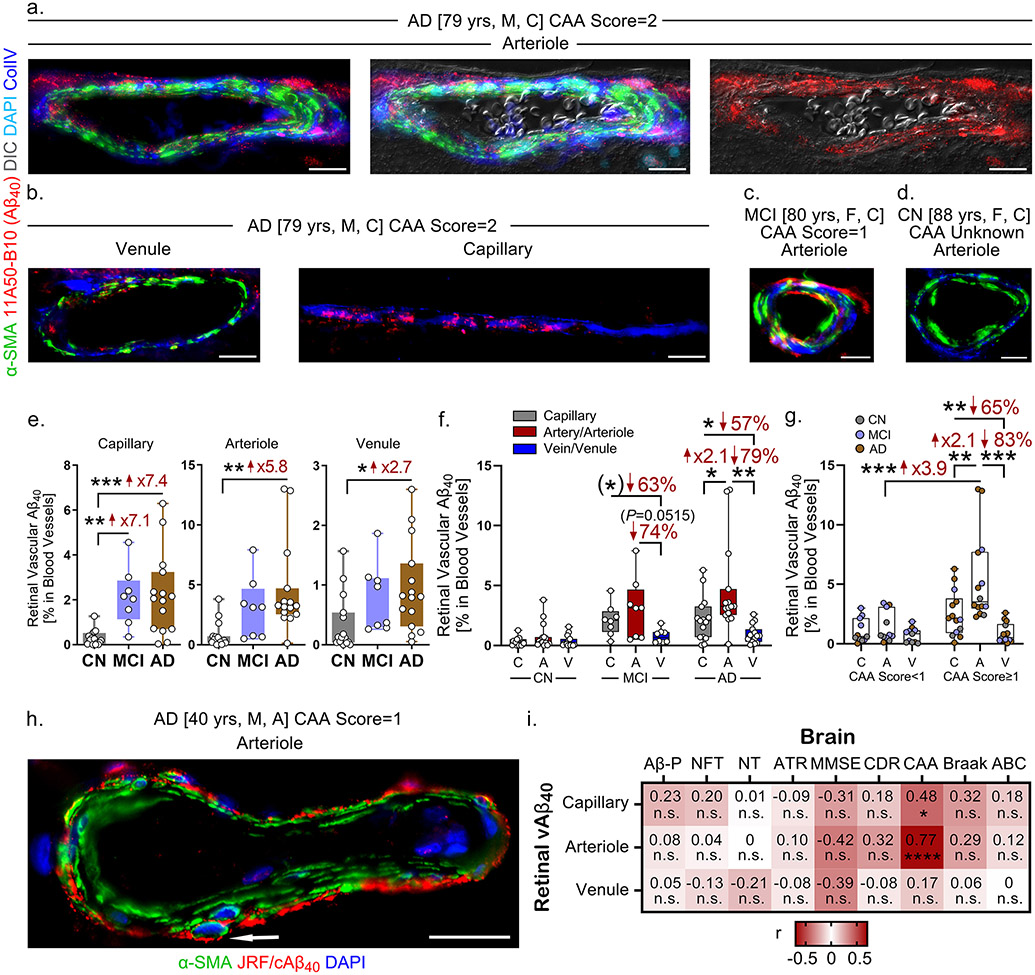
Introduction: Vascular amyloid beta (Aβ) protein deposits were detected in retinas of mild cognitively impaired (MCI) and Alzheimer's disease (AD) patients. We tested the hypothesis that the retinal vascular tight junctions (TJs) were compromised and linked to disease status.

Methods: TJ components and Aβ expression in capillaries and larger blood vessels were determined in post mortem retinas from 34 MCI or AD patients and 27 cognitively normal controls and correlated with neuropathology.

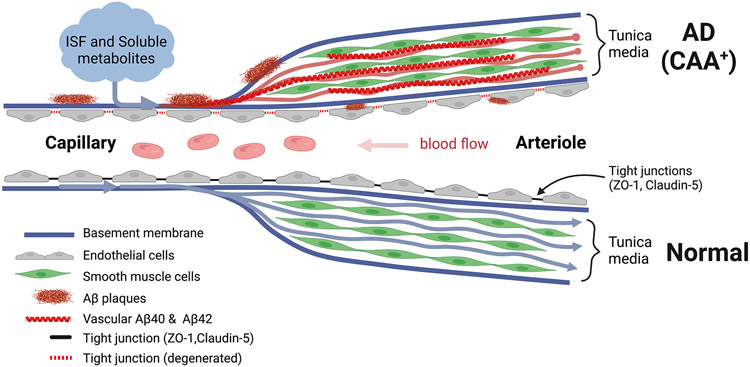
Results: Severe decreases in retinal vascular zonula occludens-1 (ZO-1) and claudin-5 correlating with abundant arteriolar Aβ40 deposition were identified in MCI and AD patients. Retinal claudin-5 deficiency was closely associated with cerebral amyloid angiopathy, whereas ZO-1 defects correlated with cerebral pathology and cognitive deficits.

Discussion: We uncovered deficiencies in blood-retinal barrier markers for potential retinal imaging targets of AD screening and monitoring. Intense retinal arteriolar Aβ40 deposition suggests a common pathogenic mechanism of failed Aβ clearance via intramural periarterial drainage.

Keywords: Alzheimer's disease; amyloid angiopathy; blood-retinal barrier; retinopathy.


Conflict of interest statement

Conflict of interest: Y.K., M.K.H., and K.L.B. are co-founders and stockholders of NeuroVision Imaging, Inc., Sacramento, CA, USA. H.S., D.F., J.S., O.J., K.M., S.L.G., V.K.G., M.M., A.A.K., A.V.L., D.H., C.A.M. and R.O.C. declare no potential conflicts of interest.

Figures

Figure 1.
Figure 1.
Loss of retinal endothelial claudin-5 in MCI and AD patients in relation to retinal vascular amyloidosis, CAA and cognitive deficit. a. Representative images of immunofluorescent staining for claudin-5 (red), collagen IV (ColIV, green), and DAPI (blue) on postmortem cross-sections of retina from cognitively normal (CN, n=21 [control]) patients as well as from patients with mild cognitive impairment (MCI, n=10) and those with Alzheimer’s disease (AD, n=21) with different degrees of CAA severity scores. Abbreviations: yrs, years old; F, female; C, Caucasian; B, Black; H, Hispanic. All scale bars=20μm. b-c. Quantitative analysis of retinal vascular claudin-5 immunoreactivity (IR) separately in capillaries and large blood vessels (LBVs) from all experimental groups stratified by b. CAA severity scores and by c. diagnostic groups (n=53 in total). d. Average of retinal vascular claudin-5 immunoreactivity (IR) in capillaries and LBVs stratified by sex in the same cohort (n=53 total). e. Pearson’s coefficient (r) correlation between CAA severity scores and claudin-5 in retinal capillaries (red) and LBVs (gray) (n=35 total). f. Heatmaps illustrating Pearson’s correlations between retinal claudin-5 in capillaries and LBVs versus brain pathology and cognitive decline, including Aβ plaques (Aβ-P), neurofibrillary tangles (NFT), neuropil threads (NT), atrophy (ATR), Mini-Mental State Examination (MMSE) scores, Clinical Dementia Rating (CDR) scores, CAA severity scores, Braak stages, and A (amyloid) B (Braak) C (CERAD) average scores in AD (n=18), MCI (n=10) and CN (n=9) human donors (n=37 total). Pseudo-color red and numbers demonstrate the strength of (r) correlation power; statistical significance is demonstrated as follows: n.s., not significant, *p < 0.05, **p < 0.01, ****p < 0.0001. g-h. Pearson’s coefficient (r) correlation between g. retinal Aβ40 versus claudin-5 in capillaries and h. retinal arteriolar Aβ40 versus claudin-5 in LBVs. Data from individual donors (circles) as well as group means ± SEMs are shown. *p < 0.05, **p < 0.01, ***p < 0.001, ****p < 0.0001, by one-way ANOVA with Tukey’s post-hoc multiple comparison test. Two-group statistical analysis was performed using an unpaired two-tailed Student t-test, and results are shown in parentheses. Percentage decreases are shown in red.
Figure 2.
Figure 2.
Significant association between retinal vascular ZO-1 deficiency and multiple cerebral neuropathology and cognitive status in MCI and AD patients. a-b. Representative images of immunofluorescent staining for ZO-1 (red), lectin for blood vessels (green), and DAPI (blue) on isolated postmortem retinal blood vessels from an AD patient versus an age and sex-matched CN control. Abbreviations: yrs, years old; M, male; C, Caucasian. All scale bars=20μm. Right panels are zoomed-in images from regions surrounded by dashed lines. c. Mass-spectrometry proteomic analyses for protein expression of ZO-1, CD11b/ITGAM, ITGB2, smoothelin, and VEZF1 in postmortem retinal lysates from a cohort of AD patients (n=6) and CN controls (n=6). d. Ingenuity Pathway Analyses (IPA) with z-scores for canonical pathways including IL-1, IL-6, VEGF, IL-8, and integrin signaling, and remodeling of epithelial adherens junctions (AJs) in the same cohort (n=12 total). e-f. Representative images of immunofluorescent staining for ZO-1 (red), 12F4 (Aβ42, white), lectin (green), and DAPI (blue) on postmortem retinal cross-sections from MCI (n=10) and AD (n=21) patients versus CN controls (n=22). Abbreviations: yrs, years old; M, male; C, Caucasian. All scale bars=20μm. g. Quantitative analysis of retinal vascular ZO-1 immunoreactivity (IR) separately in capillaries and large blood vessels (BVs) from all experimental groups of the same cohort (n=53 total). h. Quantitative analysis of retinal ZO-1 IR in capillaries stratified by CAA severity scores <1 versus ≥1 (left panel). Pearson’s coefficient (r) correlation between retinal Aβ40 versus ZO-1 in capillaries (right panel). i. Quantitative analysis of retinal ZO-1 IR in large BVs stratified by CAA severity scores <1 versus ≥1 (left panel). Pearson’s coefficient (r) correlation between retinal arteriolar Aβ40 versus ZO-1 in large BVs (right panel). j. Heatmaps illustrating Pearson’s correlations between retinal ZO-1 in capillaries and large BVs versus brain pathology and cognitive decline, including Aβ plaques (Aβ-P), neurofibrillary tangles (NFT), neuropil threads (NT), atrophy (ATR), MMSE scores, CDR scores, CAA severity scores, Braak stages, and A (Amyloid) B (Braak) C (CERAD) average scores in AD (n=18), MCI (n=10), and CN (n=9) human donors (n=37 total). Pseudo-color red and numbers demonstrate the strength of (r) correlation power; statistical significance is demonstrated as follows: n.s., not significant, *p < 0.05, **p < 0.01, ***p < 0.001. Data from individual donors (circles) as well as group means ± SEMs are shown. *p < 0.05, **p < 0.01, ****p < 0.0001, by one-way ANOVA with Tukey’s post-hoc multiple comparison test for three group analyses. Two group statistical analysis was performed using an unpaired two-tailed Student t-test. Fold changes and percentage decreases are shown in red.
Figure 3.
Figure 3.
Intense retinal arteriolar Aβ40 accumulation tightly associated with CAA severity scores in MCI and AD patients. a-d. Representative images of immunofluorescent staining for 11A50-B10 (Aβ40, red) in various retinal blood vessel types, α-SMA (green), collagen IV (ColIV, blue), and DAPI (cyan) with a differential interference contrast (DIC) channel on postmortem retinal cross-sections from MCI (n=8) and AD (n=15) patients versus CN controls (n=15). Abbreviations: yrs, years old; M, male; F, female; C, Caucasian. All scale bars=20μm. e. Quantitative analysis of retinal vascular Aβ40 immunoreactivity (IR) by 11A50-B10 in retinal blood vessel types—capillaries, arterioles, and venules—stratified by diagnostic groups of the same cohort (n=38 total). f. Quantitative analysis of retinal vascular Aβ40 IR stratified by blood vessel type and diagnostic group in the same cohort (n=38 total). g. Quantitative analysis of retinal vascular Aβ40 IR stratified by blood vessel type and CAA severity score <1 versus ≥1 in the same cohort (n=38 total). h. Representative image of immunofluorescent staining for arteriolar JRF/cAβ40 (Aβ40, red), α-SMA (green), and DAPI (blue) on postmortem retinal cross-sections from an AD patient. Abbreviations: yrs, years old; M, male; A, Asian. Scale bar=20μm. Arrow indicates Aβ40 accumulation in a smooth muscle cell. i. Heatmaps illustrating Pearson’s correlations between retinal Aβ40 by 11A50-B10 in capillaries, arterioles, and venules versus brain pathology and cognitive decline, including Aβ plaques (Aβ-P), neurofibrillary tangles (NFT), neuropil threads (NT), atrophy (ATR), MMSE scores, CDR scores, CAA severity scores, Braak stages, and A (Amyloid) B (Braak) C (CERAD) average scores in AD (n=14), MCI (n=8) and CN (n=12) human donors (n=34 total). Pseudo-color red and numbers demonstrate the strength of (r) correlation power; statistical significance is demonstrated as follows: n.s., not significant, *p < 0.05, ****p < 0.0001. Data from individual donors (circles) as well as group means ± SEMs are shown. *p < 0.05, **p < 0.01, ***p < 0.001 by two-way or one-way ANOVA with Tukey’s post-hoc multiple comparison test. Two group statistical analysis was performed using an unpaired two-tailed Student t-test and is shown in parentheses. Fold changes and percentage decreases are shown in red.
Figure 4.
Figure 4.
Graphic illustration describing failure of drainage of Aβ plaques through the intramural peri-arterial drainage (IPAD) system, which results in accumulation of Aβ in retinal arterioles and capillaries. A pathological IPAD system with degenerating tight junctions of retinal endothelium from AD patients with cerebral amyloid angiopathy (CAA) is shown in comparison with a normal healthy control. Abbreviation: ISF, interstitial fluid. This illustration was created by using Biorender.com.

References

    1. Attems J, Jellinger KA. The overlap between vascular disease and Alzheimer's disease--lessons from pathology. BMC Med. Nov 11 2014;12:206. doi:10.1186/s12916-014-0206-2 - DOI - PMC - PubMed
    1. Arvanitakis Z, Leurgans SE, Wang Z, Wilson RS, Bennett DA, Schneider JA. Cerebral amyloid angiopathy pathology and cognitive domains in older persons. Ann Neurol. Feb 2011;69(2):320–7. doi:10.1002/ana.22112 - DOI - PMC - PubMed
    1. Viswanathan A, Greenberg SM. Cerebral amyloid angiopathy in the elderly. Ann Neurol. Dec 2011;70(6):871–80. doi:10.1002/ana.22516 - DOI - PMC - PubMed
    1. Biffi A, Greenberg SM. Cerebral amyloid angiopathy: a systematic review. J Clin Neurol. Mar 2011;7(1):1–9. doi:10.3988/jcn.2011.7.1.1 - DOI - PMC - PubMed
    1. Weller RO, Subash M, Preston SD, Mazanti I, Carare RO. Perivascular drainage of amyloid-beta peptides from the brain and its failure in cerebral amyloid angiopathy and Alzheimer's disease. Brain Pathol. Apr 2008;18(2):253–66. doi:10.1111/j.1750-3639.2008.00133.x - DOI - PMC - PubMed

Publication types

MeSH terms