. 2023 Aug 7;220(8):e20220509.
doi: 10.1084/jem.20220509. Epub 2023 May 11.

Obesity alters monocyte developmental trajectories to enhance metastasis

Affiliations

Obesity alters monocyte developmental trajectories to enhance metastasis

Sheri A C McDowell et al. J Exp Med. .

Abstract

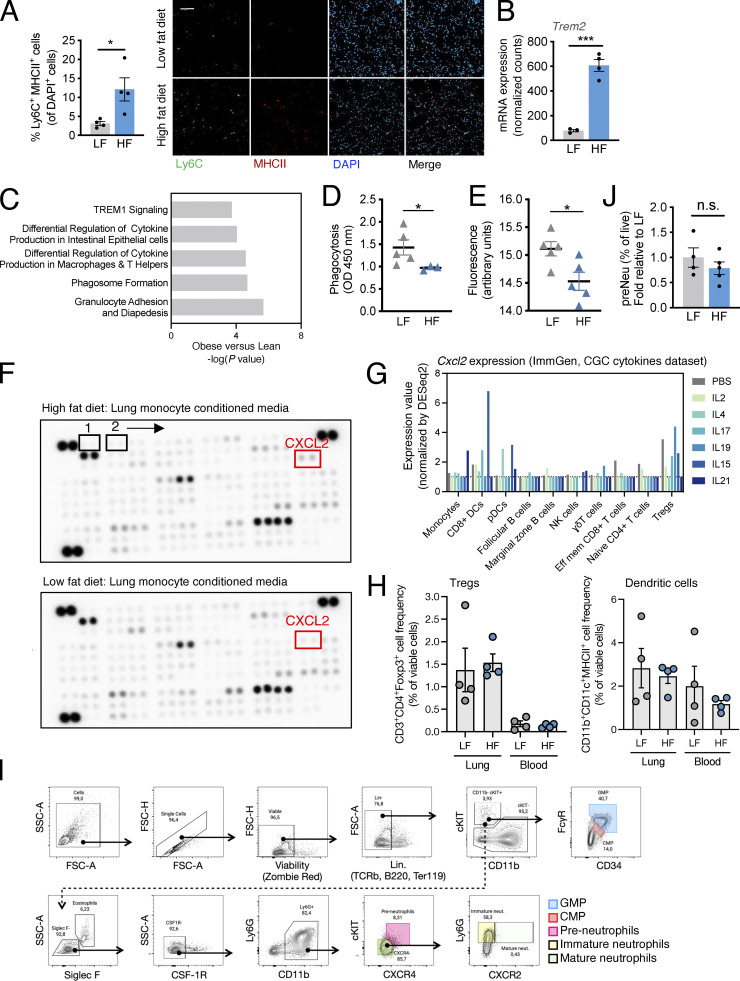
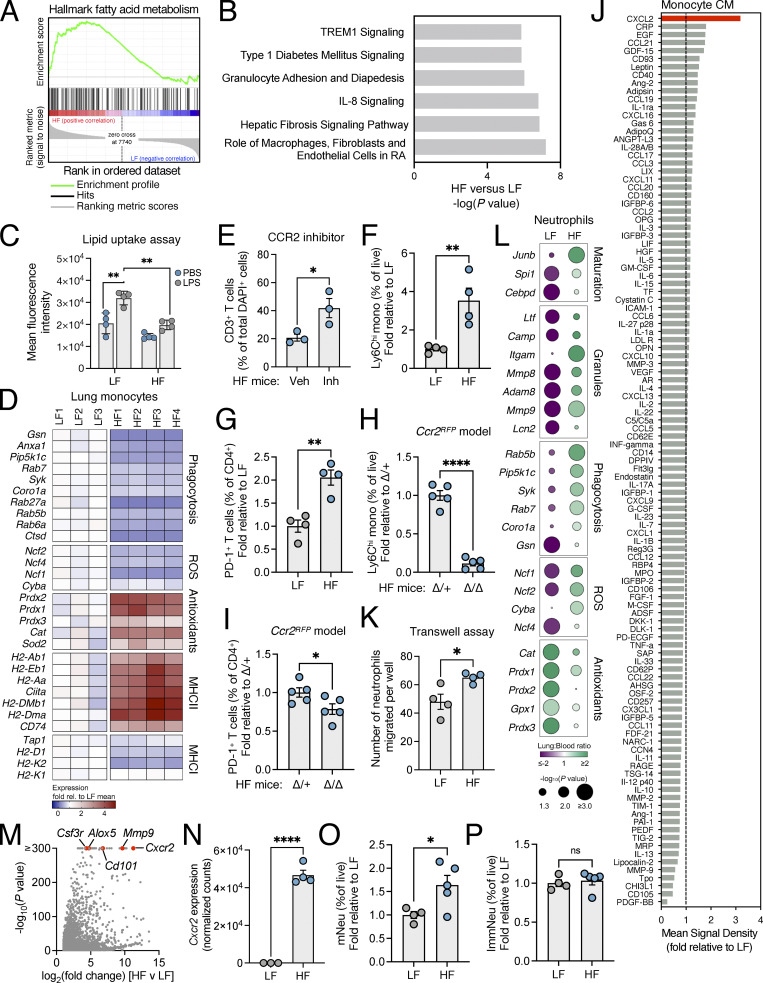
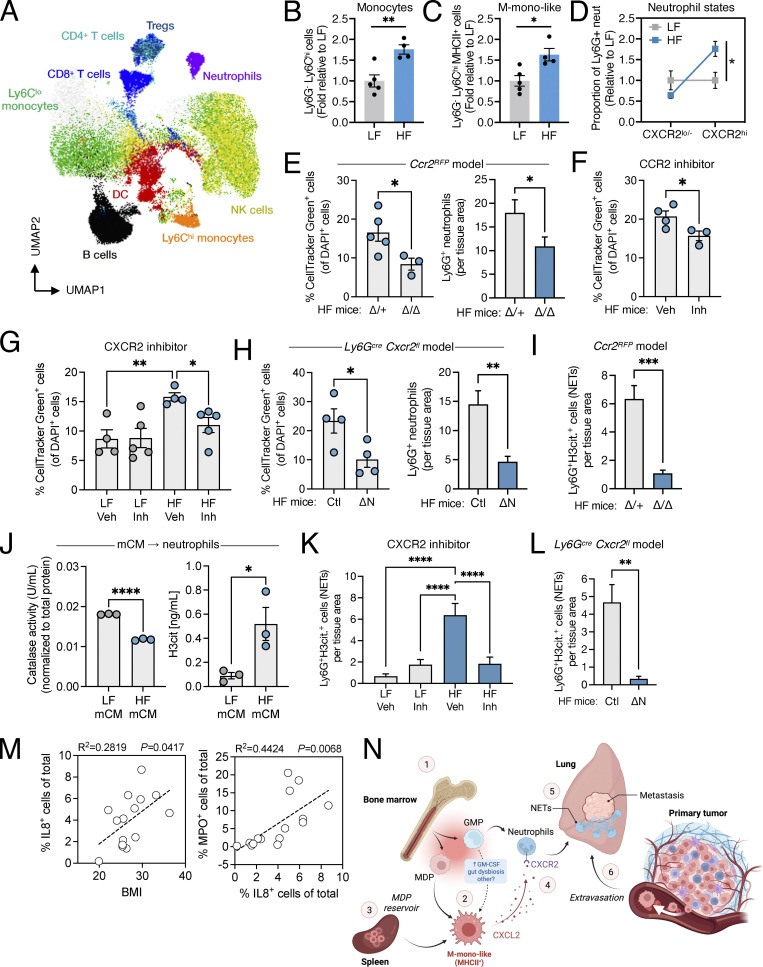
Obesity is characterized by chronic systemic inflammation and enhances cancer metastasis and mortality. Obesity promotes breast cancer metastasis to lung in a neutrophil-dependent manner; however, the upstream regulatory mechanisms of this process remain unknown. Here, we show that obesity-induced monocytes underlie neutrophil activation and breast cancer lung metastasis. Using mass cytometry, obesity favors the expansion of myeloid lineages while restricting lymphoid cells within the peripheral blood. RNA sequencing and flow cytometry revealed that obesity-associated monocytes resemble professional antigen-presenting cells due to a shift in their development and exhibit enhanced MHCII expression and CXCL2 production. Monocyte induction of the CXCL2-CXCR2 axis underlies neutrophil activation and release of neutrophil extracellular traps to promote metastasis, and enhancement of this signaling axis is observed in lung metastases from obese cancer patients. Our findings provide mechanistic insight into the relationship between obesity and cancer by broadening our understanding of the interactive role that myeloid cells play in this process.


Conflict of interest statement

Disclosures: P.O. Fiset reported consulting fees and honoraria from Amgen, BMS, Merck, AstraZeneca, Pfizer, Astellas, Incyte, EMD Serono, and Hoffmann La Roche outside the submitted work. J.D. Spicer reported consulting fees and honoraria from Roche, Merck, AstraZeneca, BMS, Novartis, Chemocentryx, Amgen, Protalix Biotherapeutics, Xenetic Biosciences, and Regeneron and grants to the institution from Roche, Merck, AstraZeneca, BMS, Protalix Biotherapeutics, and CLS Therapeutics. No other disclosures were reported.

Figures

Figure S1.
Figure S1.
Obesity reduces the proportion of lymphoid populations. (A) Bar graph depicting the average weight of the leptin-deficient model of GIO. WT, n = 9 mice; ob/ob, n = 8 mice; mean ± SEM; Student’s t test. (B) Gating strategy for CyTOF cell-type identification in WT and ob/ob blood. (C) Pie chart of lymphoid and myeloid MC distribution from CyTOF. WT, n = 4 mice; ob/ob, n = 4 mice. (D) Neutrophil-to-lymphocyte ratio from CyTOF. WT, n = 4 mice; ob/ob, n = 4 mice; mean ± SEM. Student’s t test. (E) Pie chart of lymphoid MC distribution from CyTOF. WT, n = 4 mice; ob/ob, n = 4 mice. (F) UMAP plot of unsupervised PhenoGraph analysis of the CD45+ CD3+ T cell compartment from CyTOF. WT, n = 4 mice; ob/ob, n = 4 mice. (G) Heatmap of marker expression (x axis) across TMCs (y axis) from F. Normalization by z-score. Coloured bars along y axis correspond to cell types in legend. (H) Quantification of four CD4+ TMCs as a percentage of total T cells. WT, n = 4 mice; ob/ob, n = 4 mice; mean ± SEM; Student’s t test. (I and J) Flow cytometric analysis of the proportion of PD-1+ cells (I, left), TNFα+ cells (I, right), or FOXP3+ cells (J) out of total CD4+ T cells in LF and HF lung. HF, n = 10 mice; LF, n = 10 mice; mean ± SEM; Student’s t test. (K) Gating strategy for cell-type identification of neutrophil and monocytes. (L) Flow cytometric analysis of CD45+ CD11b lymphoid cells (left) and CD45+ CD11b+ myeloid cells (right) as a percentage of live cells in WT and ob/ob blood samples. WT, n = 10 mice; ob/ob, n = 10 mice; mean ± SEM; Student’s t test. (M) Bar graph depicting average weight of the DIO model. n = 9 mice per group; mean ± SEM; Student’s t test. *, P < 0.05; **, P < 0.01; ***, P < 0.001; ****, P < 0.0001.
Figure 1.
Figure 1.
Obesity causes systemic immunological changes and a myeloid bias. (A) UMAP of mass cytometric analyses of CD45+ cells in WT or ob/ob blood, including (left) density plot and (right) contour plot (WT, n = 4 mice; ob/ob, n = 4 mice). (B) Designation of cell types from mass cytometry data in A. (C) Quantification of cell types identified in B between WT and ob/ob mice. (D) UMAP of unsupervised PhenoGraph analysis of mass cytometry data in A. (E) Heatmap of marker expression (x axis) across immune MCs (y axis) from D. Normalization by z-score. Colored bars along y axis correspond to cell types in the legend. (F) Pie chart of myeloid MC distribution between WT and ob/ob mice, based on analysis in E. (G and H) Flow cytometric analysis of neutrophils (left) and monocytes (right) as a percentage of live cells in WT and ob/ob blood (G) or lung (H). WT, n = 10 mice; ob/ob, n = 10 mice; mean ± SEM; Student’s t test. (I) Flow cytometric analysis of neutrophils (left) and monocytes (right) as a percentage of live cells in LF and HF lung. LF, n = 9 mice; HF, n = 10 mice; mean ± SEM; Student’s t test. (J) Immunofluorescence quantification of CCR2+ cells as a percentage of total DAPI+ cells in LF and HF lung samples. LF, n = 4 mice; HF, n = 5 mice; mean ± SEM; Student’s t test. (K) Representative immunofluorescence image for quantification shown in J. Scale bar = 100 μm. *, P < 0.05; **, P < 0.01; ***, P < 0.001.
Figure 2.
Figure 2.
Obesity alters monocyte identities. (A) UMAP plot of unsupervised phenograph analysis of CD45+ CD11b+ myeloid cells from mass cytometry on WT or ob/ob blood (WT, n = 4 mice; ob/ob, n = 4 mice). (B) MMC distribution between WT and ob/ob blood samples based on analysis in A. (C) Heatmap of marker expression (x axis) across MMC (y axis) from A. Normalization by z-score. Colored bars on y axis correspond to cell types in the legend. (D) CyTOF analysis of Ly6Chi MMCs in WT and ob/ob blood as a percentage of total myeloid cells. WT, n = 4 mice; ob/ob, n = 4 mice; mean ± SEM; Student’s t test. (E) Heatmap of expression of specific immune markers (x axis) across Ly6Chi MMCs (y axis) from D. (F and G) RNA-seq normalized counts for Irf8 and Klf4 (F) or Cebpe and Gfi1 (G) in LF and HF blood and lung monocytes. LF blood, n = 4 mice; LF lung, n = 3 mice; HF blood, n = 4 mice; HF lung, n = 4 mice; mean ± SEM; one-way ANOVA and Holm-Šídák test for the indicated comparisons. (H) Volcano plot showing DEGs from RNA-seq of lung monocytes from HF versus LF mice. LF, n = 3 mice; HF, n = 4 mice. (I) Flow cytometric analysis of the frequency of MDP or M-mono in BM, blood, or lungs from HF versus LF mice. Each data point represents one replicate mouse; mean ± SEM; Student’s t test. (J) Flow cytometric analysis of MDP as a percentage of live cells in HF versus LF spleen. LF, n = 5 mice; HF, n = 5 mice; mean ± SEM; Student’s t test. (K) Flow cytometric analysis of Ly6Chi monocytes derived from MDPs (left) or GMPs (right) upon treatment with serum from WT or ob/ob mice, graphed as fold change relative to WT. WT, n = 6 mice; ob/ob, n = 6 mice; mean ± SEM; Student’s t test. (L) Flow cytometric analysis of CD45.1+ monocytes derived from adoptively transferred MDPs in the lungs of CD45.2+ HF versus LF mice, graphed as fold change relative to LF. LF, n = 8 mice; HF, n = 9 mice; mean ± SEM; Student’s t test. (M) Flow cytometric analysis of MHCII+ cells as a percentage of total Ly6Chi monocytes, derived in vitro from GMP cultures treated with recombinant M- or GM-CSF. M-CSF, n = 3 mice; GM-CSF, n = 3 mice; mean ± SEM; Student’s t test. (N) Flow cytometric analysis of MHCII+ cells as a percentage of total Ly6Chi monocytes in the blood following antibiotic (ABX) treatment in HF mice. Control, n = 10 mice; ABX, n = 10 mice; mean ± SEM; Student’s t test. *, P < 0.05; **, P < 0.01; ***, P < 0.001.
Figure S2.
Figure S2.
Monocyte phenotypes are regulated by obesity. (A) UMAP contour plot of mass cytometric analyses of CD45+ CD11b+ myeloid cells from CyTOF, depicting Ly6G (top) and Ly6C (bottom) expression across all samples. WT, n = 4 mice; ob/ob, n = 4 mice. (B) UMAP plot from CyTOF highlighting myeloid MC 11. (C) Line graph showing the relative expression (transformed) of all CyTOF makers in MMC11 (pink) compared with other MMC (gray). (D) CyTOF analysis of the proportion of PD-L1+ cells, CD80+ cells, CD86+ cells, or CD40+ cells as a percentage of total Ly6Chi monocytes. WT, n = 4 mice; ob/ob, n = 4 mice; mean ± SEM; Student’s t test; *, P < 0.05. (E) Schematic of monocyte developmental trajectories from GMP or MDP, including proposed hypothesis of obesity-induced hematopoietic skewing of depicted populations (green “+” symbols). Created with BioRender.com. (F) Principal component analysis of RNA-seq on monocytes isolated from blood (left: LF, n = 4 mice; HF, n = 4 mice) or lung (right: LF, n = 3 mice; HF, n = 4 mice).
Figure S3.
Figure S3.
Obesity promotes an M-mono–like monocyte state. (A) Gating strategy for GMPs, MDPs, G-mono, M-mono, and intermediary precursors. (B) Absolute number of GMP and MDP per leg in WT C57BL6 mice. n = 6 mice per group; mean ± SEM; Student’s t test. (C) Flow cytometric analysis of MP/cMoPs and G-mono of total live cells in HF versus LF BM (n = 5 mice/group) or blood (n = 7–9 mice). Graphs depict mean ± SEM; Student’s t test. (D) Flow cytometric analysis of MP/cMoPs, GMP, granulocyte progenitors (all n = 5/group), and Ly6Chi monocytes (n = 10/group) of total live cells in HF versus LF spleen. Graphs depict mean ± SEM; Student’s t test. (E) Representative flow cytometry histogram plot depicting monocytes from LF and HF spleen. (F) Competitive expansion of congenic CD45.1/CD45.2 GMP and MDP, mixed 1:1, and treated with serum from LF or HF mice for 5 d. Left, mean ± SEM for all samples; right, mean ± SEM for MDP- or GMP-derived monocytes with statistics displayed. (G) Flow cytometric quantification of M-mono following adoptive transfer of CD45.2+ MDP from LF or HF donors into CD45.1+ WT (normal diet) recipients. LF, n = 6 mice; HF, n = 5 mice; mean ± SEM; Student’s t test. (H and I) Flow cytometric quantification of G-mono (H) and MHCII+ G-mono (I) following adoptive transfer of CD45.1+ GMP from WT (normal diet) donors into CD45.2+ LF or HF recipients. LF, n = 3 mice; HF, n = 3 mice; mean ± SEM; Student’s t test. (J) Pie chart of mean relative bacterial abundance at the phylum level, based on 16S rRNA-seq of fecal samples from LF and HF mice. (K) Flow cytometric analysis of Ly6Chi monocytes in HF mice treated with antibiotics (ABX) versus control, graphed as a percentage of total leukocytes in the blood. For both groups, n = 10 mice; mean ± SEM; Student’s t test. (L) Diffusion UMAP of BM-derived CD11b+Ly6C+ cells from LF (top) and HF (bottom) mice. Arrows depict RNA velocity fields based on scRNA-seq data. *, P < 0.05; **, P < 0.01; ***, P < 0.001; ****, P < 0.0001.
Figure S4.
Figure S4.
Obesity is associated with altered monocyte effector functions. (A) Immunofluorescence quantification and representative images of Ly6C+ MHCII+ cells as a percentage of total DAPI+ cells in LF and HF lungs. For both groups, n = 4 mice; mean ± SEM; Student’s t test. Scale bar = 100 μm. (B) Trem2 normalized counts from lung monocyte RNA-seq. LF, n = 3 mice; HF, n = 4 mice; mean ± SEM; Student’s t test. (C) RNA-seq IPA of blood monocytes from obese (BMI > 35; n = 10 donors) versus lean (BMI < 25; n = 10 donors) human donors. (D) Phagocytosis of enzyme-labeled E. coli particles by LF and HF lung monocytes. LF, n = 5 mice; HF, n = 3 mice; mean ± SEM; Student’s t test. (E) ROS production by LF and HF lung monocytes. LF, n = 5 mice; HF, n = 5 mice; mean ± SEM; Student’s t test. (F) Cytokine array corresponding to Fig. 3 J and Table S2. (G) Cxcl2 gene expression across splenic immune populations in response cytokines, obtained from the Skyline CGC cytokine database, ImmGen (http://rstats.immgen.org/Skyline_CGC/skyline.html). (H) Flow cytometric analysis of Tregs (left) and DCs (right) in HF and LF lung and blood samples from mice with established metastases. For all groups, n = 4 mice; mean ± SEM. (I) Gating strategy for flow cytometric assessment of neutrophil maturation. (J) Flow cytometric analysis of pre-neutrophils (preNeu) of total live cells in HF versus LF lungs. LF, n = 4 mice; HF, n = 4 mice; mean ± SEM; Student’s t test. *, P < 0.05; ***, P < 0.001.
Figure 3.
Figure 3.
Obesity-induced monocytes promote neutrophil maturation. (A) GSEA showing that hallmark fatty acid metabolism is the top enriched pathway from HF versus LF lung monocyte RNA-seq (normalized enrichment score = 1.76; false discovery rate q value = 0.144). (B) RNA-seq IPA of lung monocytes from HF versus LF mice. (C) Palmitate uptake in monocytes from HF or LF mice following LPS or PBS stimulation shown as BODIPY mean fluorescent intensity. For all groups, n = 4 mice; mean ± SEM; one-way ANOVA and Holm-Šídák test for multiple comparisons. (D) RNA-seq gene expression changes between lung monocytes from HF versus LF mice. All displayed changes are at least P < 0.05. LF, n = 3 mice; HF, n = 4 mice. (E) Immunofluorescence analysis of lung CD3+ T cells as a percentage of total DAPI+ cells, following CCR2 inhibition in HF mice. Veh, n = 3 mice; Inh, n = 3 mice; mean ± SEM; Student’s t test. (F) Flow cytometric analysis of liver metastasis, showing Ly6Chi monocyte frequency in HF versus LF mice. LF, n = 4 mice; HF, n = 4 mice; mean ± SEM; Student’s t test. (G) Flow cytometric analysis of liver metastasis, showing the proportion of CD4+ T cells that are PD-1+ in HF versus LF mice. LF, n = 4 mice; HF, n = 4 mice; mean ± SEM; Student’s t test. (H) Flow cytometric analysis of liver metastasis in HF mice (Ccr2RFP model), showing Ly6Chi monocyte frequency in Δ/Δ versus Δ/+ mice. Δ/+, n = 5 mice; Δ/Δ, n = 5 mice; mean ± SEM; Student’s t test. (I) Flow cytometric analysis of liver metastasis in HF mice (Ccr2RFP model) showing the proportion of CD4+ T cells that are PD-1+ in Δ/Δ versus Δ/+ mice. Δ/+, n = 5 mice; Δ/Δ, n = 5 mice; mean ± SEM; Student’s t test. (J) Cytokine array quantification performed on mCM from HF versus LF mice. Data represent HF values, displayed as fold relative to LF (set to 1). The top upregulated protein, CXCL2, is highlighted in red. (K) Transwell chemotaxis assay of neutrophils (upper chamber) toward lung monocytes from HF or LF mice (lower chamber). LF, n = 4 mice; HF, n = 4 mice; mean ± SEM; Student’s t test. (L) Bubble plot of RNA-seq gene expression changes in LF or HF neutrophils, as they move from blood (LF, n = 4; HF, n = 4) to lung (LF, n = 3; HF, n = 4). Bubble color represents the ratio of expression between lung:blood (purple, downregulated; green, upregulated) and bubble size represents P value. (M) Volcano plot showing DEGs from RNA-seq of lung neutrophils isolated from HF versus LF mice. LF, n = 3 mice; HF, n = 4 mice. (N) Cxcr2 normalized counts from lung neutrophil RNA-seq. LF, n = 3 mice; HF, n = 4 mice; mean ± SEM; Student’s t test. (O) Flow cytometric analysis of HF versus LF lung, showing mature neutrophil (mNeu) frequency. LF, n = 4 mice; HF, n = 5 mice; mean ± SEM; Student’s t test. (P) Flow cytometric analysis of HF versus LF lung, showing immature neutrophil (ImmNeu) frequency. LF, n = 4 mice; HF, n = 5 mice; mean ± SEM; Student’s t test. *, P < 0.05; **, P < 0.01; ****, P < 0.0001.
Figure 4.
Figure 4.
Monocytes promote NET formation and metastasis under obese conditions. (A) UMAP from spectral flow cytometry of lung immune cells in mice with established metastases (∼7 wk, metastasis-bearing). (B) Flow cytometric analysis of Ly6Chi monocytes in HF versus LF lung samples with early metastasis (48 h extravasation assay). LF, n = 5 mice; HF, n = 4 mice; mean ± SEM; Student’s t test. (C) Flow cytometric analysis of Ly6Chi MHCII+ M-mono in HF versus LF lung samples (48 h). LF, n = 5 mice; HF, n = 4 mice; mean ± SEM; Student’s t test. (D) Flow cytometric analysis of CXCR2lo/− or CXCR2hi neutrophils as a proportion of total neutrophils in established lung metastases from HF versus LF mice. LF, n = 4 mice; HF, n = 3 mice; mean ± SEM; Student’s t test. (E) Left: Flow cytometric analysis of extravasated CellTracker+ Py230 BC cells in HF mice (Ccr2RFP model), graphed as a percentage of total DAPI+ cells. Δ/+, n = 5 mice; Δ/Δ, n = 3 mice; mean ± SEM; Student’s t test. Right: Immunofluorescence quantification of Ly6G+ neutrophils normalized to tissue area. For both groups, n = 3 mice with four ROIs/mouse; mean ± SEM; Student’s t test. (F) Flow cytometric analysis of extravasated CellTracker+ Py230 BC cells in lungs of HF mice, treated with a CCR2 inhibitor (Inh) versus vehicle (Veh), graphed as a percentage of total DAPI+ cells. Veh, n = 4 mice; Inh, n = 3 mice; mean ± SEM; Student’s t test. (G) Flow cytometric analysis of extravasated CellTracker+ Py230 BC cells in lungs of LF or HF mice, treated with a CXCR2 inhibitor (Inh) versus vehicle (Veh), graphed as a percentage of total DAPI+ cells. LF/HF Veh, n = 4 mice; LF/HF Inh, n = 5 mice; mean ± SEM; one-way ANOVA and Holm-Šídák test for the indicated comparisons. (H) Left: Flow cytometric analysis of extravasated CellTracker+ Py230 BC cells in HF mice (Ly6Gcre Cxcr2fl model), graphed as a percentage of total DAPI+ cells. Ctl, n = 4 mice; ΔN, n = 4 mice; mean ± SEM; Student’s t test. Right: Immunofluorescence quantification of Ly6G+ neutrophils normalized to tissue area. For both groups, n = 3 mice with four ROIs/mouse; mean ± SEM; Student’s t test. (I) Immunofluorescence quantification of NETosing neutrophils (Ly6G+H3cit+ double positive cells) in HF mice (Ccr2RFP model), normalized to tissue area. For both groups, n = 3 mice with four ROIs/mouse; mean ± SEM; Student’s t test. (J) Left: Neutrophil catalase activity following treatment with (mCM from LF or HF mice. Right: NET formation measured by H3cit ELISA, following treatment with lung mCM from LF or HF mice. For both graphs, LF, n = 3 mice; HF, n = 3 mice; mean ± SEM. Student’s t test. (K) Immunofluorescence quantification of NETosing neutrophils in LF or HF mice, treated with a CXCR2 inhibitor (Inh) versus vehicle (Veh), normalized to tissue area. For all groups, n = 3 mice with four ROIs/mouse; mean ± SEM; one-way ANOVA and Holm-Šídák test for multiple comparisons. (L) Immunofluorescence quantification of NETosing neutrophils in HF mice (Ly6Gcre Cxcr2fl model), normalized to tissue area. For both groups, n = 3 mice with four ROIs/mouse; mean ± SEM; Student’s t test. (M) Pearson’s correlation of IL8+ cells versus BMI (left) or MPO+ cells versus IL8+ cells (right). n = 14 patients with lung metastasis. (N) Working model for the effects of obesity on monocytes. Briefly, obesity promotes M-mono–like monocyte states from MDP (1), with potential contributions from GMP-derived G-mono, which can upregulate MHCII in response to obesity-related systemic factors (2). In parallel, the spleen acts as a reservoir for MDP in obese hosts (3). Obesity-associated M-mono–like cells produce elevated CXCL2, which signals to CXCR2+ mature neutrophils to support their trafficking and effector status (4). The CXCL2–CXCR2 axis underlies NET formation in the lungs (5) in association with enhanced metastasis under obese conditions (6). Created with BioRender.com. *, P < 0.05; **, P < 0.01; ***, P < 0.001; ****, P < 0.0001.
Figure S5.
Figure S5.
Monocytes underlie neutrophil states during obesity. (A) Flow cytometric analysis of neutrophils as a percentage of live cells in HF versus LF lung samples with early metastasis (48 h extravasation assay). LF, n = 10 mice; HF, n = 10 mice; mean ± SEM; Student’s t test. (B) Flow cytometric analysis of CD8+ and CD4+ as a percentage of CD45+ cells in WT and ob/ob lung samples with early metastasis (48 h). WT, n = 4 mice; ob/ob, n = 4 mice; mean ± SEM; Student’s t test. (C) Histology analysis in LF and HF lung tissues showing (left) PyMT metastatic lesions per lung area (LF, n = 7 mice and 18 lung sections; HF, n = 9 mice and 31 lung sections; median ± IQR; Mann-Whitney test); (middle) MPO+ neutrophils (LF, n = 5 mice; HF, n = 5 mice; mean ± SEM; Student’s t test); and (right) MPO+H3cit+ NET-forming neutrophils (LF, n = 5 mice; HF, n = 5 mice; median ± IQR; Mann-Whitney test). (D) Representative flow cytometry plots of CCR2 and RFP in blood samples from the Ccr2RFP model. (E) Immunofluorescence quantification of CCR2+ monocytes as a percentage of total DAPI+ cells in lungs from HF mice treated with a CCR2 inhibitor (Inh) or vehicle (Veh). Veh, n = 3 mice; Inh, n = 4 mice; mean ± SEM; Student’s t test. (F) Immunofluorescence quantification and representative images of GFP+ E0771 cells as percentage of total DAPI+ cells in lungs from HF mice treated with a CXCR2 inhibitor (Inh) or vehicle (Veh). Veh, n = 6 mice; Inh, n = 4 mice; mean ± SEM; Student’s t test. Scale bar = 100 μm. (G) Immunofluorescence quantification of lung CD3+ T cells in HF mice (Ly6Gcre Cxcr2fl model), graphed as a percentage of total DAPI+ cells. Ctl, n = 4 mice; ΔN, n = 4 mice; mean ± SEM; Student’s t test. (H) Immunofluorescence quantification and representative images of NETosing neutrophils (MPO+ H3Cit+ double-positive cells) as a percentage of total DAPI+ cells in HF and LF lungs. LF, n = 4 mice; HF, n = 3 mice; mean ± SEM; Student’s t test. Scale bar = 100 μm. (I–K) Representative immunofluorescence images of lung from the Ccr2RFP model (I), CXCR2 inhibition (J) or the Ly6Gcre Cxcr2fl model (K). Scale bars = 10 μm. *, P < 0.05; **, P < 0.01; ***, P < 0.001.

References

    1. Adrover, J.M., Aroca-Crevillén A., Crainiciuc G., Ostos F., Rojas-Vega Y., Rubio-Ponce A., Cilloniz C., Bonzón-Kulichenko E., Calvo E., Rico D., et al. 2020. Programmed “disarming” of the neutrophil proteome reduces the magnitude of inflammation. Nat. Immunol. 21:135–144. 10.1038/s41590-019-0571-2 - DOI - PMC - PubMed
    1. Adrover, J.M., Del Fresno C., Crainiciuc G., Cuartero M.I., Casanova-Acebes M., Weiss L.A., Huerga-Encabo H., Silvestre-Roig C., Rossaint J., Cossío I., et al. 2019. A neutrophil timer coordinates immune defense and vascular protection. Immunity. 50:390–402.e10. 10.1016/j.immuni.2019.01.002 - DOI - PubMed
    1. Alfaro, C., Teijeira A., Oñate C., Pérez G., Sanmamed M.F., Andueza M.P., Alignani D., Labiano S., Azpilikueta A., Rodriguez-Paulete A., et al. 2016. Tumor-produced interleukin-8 attracts human myeloid-derived suppressor cells and elicits extrusion of neutrophil extracellular traps (NETs). Clin. Cancer Res. 22:3924–3936. 10.1158/1078-0432.CCR-15-2463 - DOI - PubMed
    1. Ambrosi, T.H., Scialdone A., Graja A., Gohlke S., Jank A.M., Bocian C., Woelk L., Fan H., Logan D.W., Schürmann A., et al. 2017. Adipocyte accumulation in the bone marrow during obesity and aging impairs stem cell-based hematopoietic and bone regeneration. Cell Stem Cell. 20:771–784.e6. 10.1016/j.stem.2017.02.009 - DOI - PMC - PubMed
    1. Ballesteros, I., Rubio-Ponce A., Genua M., Lusito E., Kwok I., Fernández-Calvo G., Khoyratty T.E., van Grinsven E., González-Hernández S., Nicolás-Ávila J.A., et al. 2020. Co-Option of neutrophil fates by tissue environments. Cell. 183:1282–1297.e18. 10.1016/j.cell.2020.10.003 - DOI - PubMed

Publication types

Grants and funding