. 2023 Jul 3;133(13):e161713.
doi: 10.1172/JCI161713.

Gluconeogenic enzyme PCK1 supports S-adenosylmethionine biosynthesis and promotes H3K9me3 modification to suppress hepatocellular carcinoma progression

Affiliations

Gluconeogenic enzyme PCK1 supports S-adenosylmethionine biosynthesis and promotes H3K9me3 modification to suppress hepatocellular carcinoma progression

Dongmei Gou et al. J Clin Invest. .

Abstract

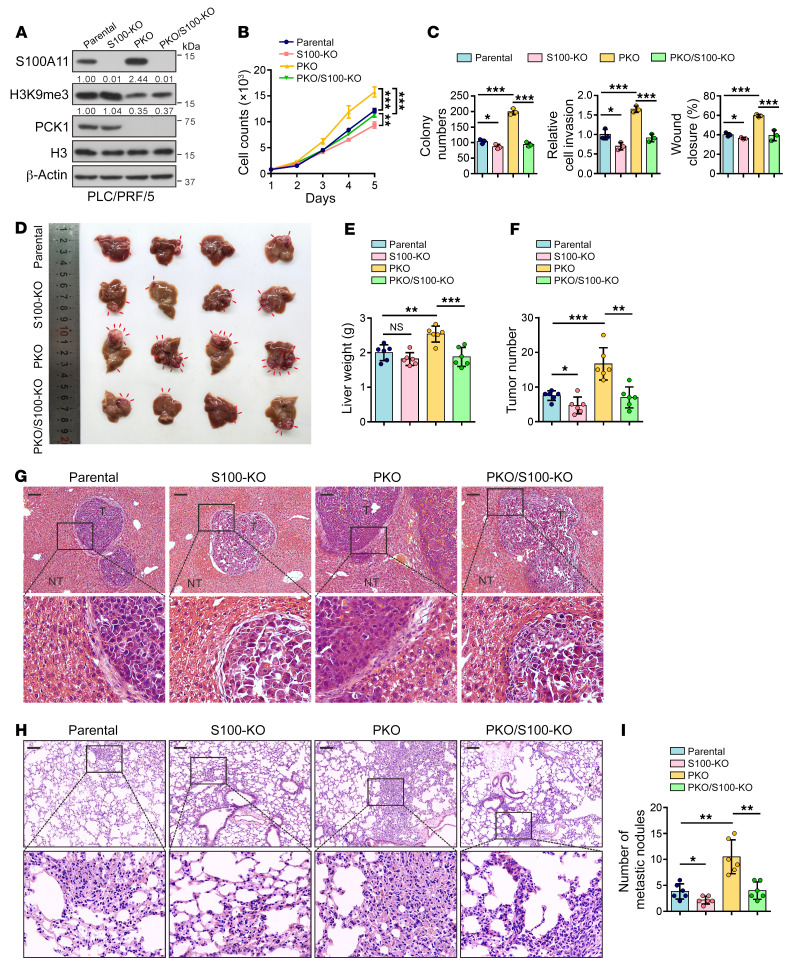
Deciphering the crosstalk between metabolic reprogramming and epigenetic regulation is a promising strategy for cancer therapy. In this study, we discovered that the gluconeogenic enzyme PCK1 fueled the generation of S-adenosylmethionine (SAM) through the serine synthesis pathway. The methyltransferase SUV39H1 catalyzed SAM, which served as a methyl donor to support H3K9me3 modification, leading to the suppression of the oncogene S100A11. Mechanistically, PCK1 deficiency-induced oncogenic activation of S100A11 was due to its interaction with AKT1, which upregulated PI3K/AKT signaling. Intriguingly, the progression of hepatocellular carcinoma (HCC) driven by PCK1 deficiency was suppressed by SAM supplement or S100A11 KO in vivo and in vitro. These findings reveal the availability of the key metabolite SAM as a bridge connecting the gluconeogenic enzyme PCK1 and H3K9 trimethylation in attenuating HCC progression, thus suggesting a potential therapeutic strategy against HCC.

Keywords: Gluconeogenesis; Liver cancer; Metabolism; Oncology.


Figures

Figure 1
Figure 1. PCK1 upregulates H3K9me3 levels and provides methyl donors by enhancing SSP flux.
(A) Immunoblots of the indicated proteins or histone modification markers in PCK1-KO PLC/PRF/5 cells (PKO cells) and PCK1-KO SNU449 cells (PKO cells). Data from 1 representative experiment are shown (n = 3). (B) Western blots from SK-Hep1 cells and MHCC97H cells overexpressing GFP (control cells), WT PCK1, or an enzymatically deficient mutant (PCK1 G309R). Mock-treated cells served as a blank control. Data from 1 representative experiment are shown (n = 3). (C) Immunoblots in liver tumors from DEN/CCl4-induced WT and LKO mice and densitometric analysis of H3K9me3 (n = 6 mice per group). (D) Enrichment bubble metabolic pathways, (E) heatmap showing changes in biosynthesis of amino acids, and (F) fold changes in intermediate metabolites of the SSP in SK-Hep1 cells overexpressing WT PCK1 (n = 6 biologically independent samples). 2PG, 2-phosphoglycerate. (G and H) LC-MS analysis of intracellular metabolites in (G) PKO cells and (H) PCK1-OE cells (n = 6 biologically independent samples). Data are shown as the mean ± SEM. Statistical analysis was performed using 2-tailed unpaired Student’s t test (C and F) or 1-way ANOVA with Tukey’s test (A, B, G, and H). *P < 0.05, **P < 0.01, ***P < 0.001, ****P < 0.0001.
Figure 2
Figure 2. PCK1 enhances H3K9me3 modification by SAM via the SSP and SUV39H1.
(A) Schematic diagram for the conversion of U-[13C]-glutamine into various metabolites and LC-MS profiles of M+4 OAA, M+2 3PG, M+1 methionine, M+1 SAM, respectively, after PCK1-OE cells were incubated with U-[13C]-glutamine for 24 hours (n = 4 biologically independent samples). (B) Schematic diagram for the conversion of U-[13C]-pyruvate into various metabolites and LC-MS profiles of M+2 3PG, M+2 serine, M+1 methionine, M+1 SAM, respectively, after PCK1-OE cells were incubated with U-[13C]-pyruvate for 24 hours (n = 4 biologically independent samples). (C) Schematic overview showing that PCK1-induced H3K9me3 modification depends on SAM accumulation derived from SSP. (D) Intracellular SAM in PKO cells in the presence or absence of 3PG (n = 6 biologically independent samples). (E) PKO cells were treated with PEP (0.5 mM), 3PG (0.75 mM), serine (400 μM), methionine (100 μM), SAM (50 μM), and SAH (50 μM), respectively, for 24 hours. Immunoblots for H3K9me3 were repeated 3 times independently with similar results. Data from 1 representative experiment are shown. Densitometric analysis of H3K9me3 was performed, normalized to histone H3. (F) Immunoblots for H3K9me3 modification in SK-Hep1 cells. Data from 1 representative experiment are shown (n = 3). (G) Histone methyltransferase (HMT) activities for H3K9 in PKO cells (left) and PCK1-OE cells (right) (n = 3 technical replicates). (HJ) PKO cells or PCK1/SUV39H1 double-KO cells (PKO/SUVKO cells) were treated with or without SAM for 24 hours, and (H) Western blot (n = 3), (I) cell growth curves (n = 3 technical replicates), and (J) colony formation assays, Transwell assays, and wound scratch assays (n = 3 biologically independent samples), are shown. Data are shown as the mean ± SEM. Statistical analysis was performed using 2-tailed unpaired Student’s t test (A and B), 1-way ANOVA with Tukey’s test (DH and J), or 2-way ANOVA with Bonferroni’s test (I). *P < 0.05, **P < 0.01, ***P < 0.001, ****P < 0.0001.
Figure 3
Figure 3. PCK1 suppresses S100A11 transcription by increasing H3K9me3 occupancy.
(A) Distribution of H3K9me3 ChIP-Seq signals in PKO cells around the transcription start site (TSS). (B) Bioinformatics analysis filtered S100A11 as a downstream target of H3K9me3. up, upregulated. (C) Genome browser tracks of H3K9me3 occupancy and RNA-Seq (n = 4 biologically independent samples) at the S100A11 gene locus. (D) Gene expression correlation between S100A11 and PCK1 (r = –0.38, P = 6.23 × 10⁻¹⁴) from the TCGA database. (E) qPCR analysis of S100A11 expression in PKO cells (left) and PCK1-OE cells (right) (n = 3 technical replicates). Data are shown as the mean ± SEM. Statistical analysis was performed using 1-way ANOVA with Tukey’s test (E). ***P < 0.001, ****P < 0.0001.
Figure 4
Figure 4. PCK1 suppresses S100A11 by increasing SAM-dependent H3K9me3 occupancy.
(A) Representative blots and densitometries of H3K9me3 and S100A11 in PKO cells and PCK1-OE cells; histone H3 and β-actin were used as loading controls (n = 3). (B) Immunofluorescent images for S100A11 in PKO cells. (C) ChIP-qPCR showing the enrichment of H3K9me3 in different promoter regions of S100A11 in PKO cells (n = 3 technical replicates). (DF) PKO and PKO/SUVKO cells were supplemented with or without SAM for 24 hours, followed by (D) ChIP-qPCR analysis (n = 3 technical replicates), (E) qPCR assays (n = 3 technical replicates), and (F) Western blot detection (n = 3 times). Scale bars: 15 μm (B). Data are shown as the mean ± SEM. Statistical analysis was performed using 1-way ANOVA with Tukey’s test (A and DF). **P < 0.01, ***P < 0.001, ****P < 0.0001.
Figure 5
Figure 5. PCK1 deficiency induces HCC cell proliferation, migration, and tumorigenesis via S100A11.
(A) Western blot showing the protein expression from PCK1/S100A11 double-KO PLC/PRF/5 cells (PKO/S100-KO cells). Numbers that appear below the blots represent the relative densities (measured using ImageJ software) of S100A11 protein bands normalized to β-actin, or the relative densities of H3K9me3 modification normalized to histone H3. (B) Cell proliferation (n = 3 technical replicates) and (C) colony formation assays, Transwell assays, and wound-healing assays (n = 3 biologically independent samples) in PKO/S100-KO cells. (D) Gross images, (E) liver weight, (F) tumor number, and (G) H&E staining in the orthotopic HCC model, as indicated (n = 6 mice per group). (H) H&E staining analysis and (I) quantification of metastatic nodules in the lung metastasis model (n = 6 mice per group). Scale bars: 100 μm (G and H). Data are shown as the mean ± SEM. Statistical analysis was performed using 1-way ANOVA with Tukey’s test (C, E, F, and I) and 2-way ANOVA with Bonferroni’s test (B). *P < 0.05, **P < 0.01, ***P < 0.001.
Figure 6
Figure 6. Loss of PCK1 activates PI3K/AKT signaling through S100A11.
(A) RNA-Seq (n = 4 biologically independent samples) combined with ChIP-Seq analysis filtered PI3K/AKT signaling. (B and C) The mRNA levels of PI3K/AKT signaling genes and associated markers were assayed by qPCR (B) in PKO/S100-KO cells and (C) PCK1-OE cells transfected with S100A11-overexpressing plasmid (n = 3 technical replicates). (D and E) Immunoprecipitated proteins, with the indicated antibodies, subjected to immunoblotting analysis. (F) Schematic representation of the AKT1 constructs. WT AKT1 contains 3 domains, the pleckstrin homology (PH) domain, kinase domain (KD), and C-terminal domain (CTD). Truncation mutants of AKT1, comprising amino acids 108–480 or 1–151, were designated as ΔN and ΔC, respectively. (G) Interactions between S100A11 and full-length protein (aa 1–480), the ΔN truncation mutant (aa 108–480), or the ΔC truncation mutant (aa 1–151) in HEK-293 cells were determined by Co-IP. (H and I) Immunoblots of samples from (H) PKO/S100-KO cells and (I) PCK1-OE cells transfected with S100A11-overexpressing plasmid. Numbers that appear below the blots represent the relative densities (measured using ImageJ software) of S100A11 protein bands normalized to β-actin, or the relative densities of H3K9me3 modification normalized to histone H3. (J) Western blots for PKO cells or PKO/SUV-KO cells treated with or without SAM for 24 hours. Data are shown as the mean ± SEM. Statistical analysis was performed using 1-way ANOVA with Tukey’s test (B and C) or log-rank test (A); *P < 0.05, **P < 0.01, ***P < 0.001.
Figure 7
Figure 7. The progression of DEN/CCl4/PB-induced hepatocellular carcinogenesis in Pck1-KO mice is suppressed by SAM supplement or S100a11 KO.
(A) Scheme of the experimental procedure with AlbCre–/– Pck1fl/fl (WT), AlbCre+/– Pck1fl/fl mice (liver-specific KO [LKO]) (n = 6 mice per group). (B) Gross images and (C) quantification of weight and numbers of tumor nodules of livers from WT, Pck1-LKO treated with vehicle, Pck1-LKO treated with SAM, Pck1-LKO injected with pSECC-sgControl, and Pck1-LKO injected with pSECC-sgS100a11 mice (n = 6 mice per group). (D) Representative images of H&E staining for lung tissues were provided, and (E) the metastatic foci were counted (n = 6 mice per group). (F) Ultra-performance liquid chromatography results for the SAM concentration in mouse serum samples and liver tissues (n = 6 mice per group). Scale bars: 200 μm (D). Data are shown as the mean ± SEM. Statistical analysis was performed using 1-way ANOVA with Tukey’s test (C, E, and F). *P < 0.05, **P < 0.01, ***P < 0.001.
Figure 8
Figure 8. Reductive H3K9me3 modification at S100a11 promotes DEN/CCl4/PB-induced hepatocellular carcinogenesis in Pck1-KO mice.
(A) Indicated proteins or modifications were detected by immunohistochemical assays and (B) Western blot detection. Numbers that appear below the blots represent the relative densities (measured using ImageJ software) of S100A11 protein bands normalized to β-actin, or the relative densities of H3K9me3 modification normalized to histone H3 Scale bars: 50 μm (A).
Figure 9
Figure 9. Correlation among PCK1, H3K9me3, and S100A11 expression in HCC specimens.
(A and B) Indicated proteins or modification levels in representative human HCC specimens and surrounding nontumorous tissues were measured by (A) Western blot in 7 HCC patients and (B) IHC staining in 2 HCC patients (serial sections). N, surrounding nontumorous tissues; T, HCC specimens. (CH) Correlation analysis between indicated protein expression in tumor tissues from 49 patients with HCC (see also Supplemental Figure 7, A–F). Correlation analysis between (C) H3K9me3 and PCK1, (D) H3K9me3 and S100A11, (E) S100A11 and PCK1, (F) S100A11 and AKT-pS473, (G) AKT-pS473 and MMP11, and (H) AKT-pS473 and p21. (I and J) ultra-performance liquid chromatography results for the SAM concentration in (I) serum samples (HCC, n = 109; normal n = 76) and (J) HCC tissues and paired adjacent liver tissues (n = 33). Scale bars: 50 μm (B). Data are shown as the mean ± SEM. Statistical analysis was performed using 2-tailed unpaired Student’s t test (I), 2-tailed paired Student’s t test (J), or Pearson’s correlation coefficient (CH). *P < 0.05, ***P < 0.001.

References

    1. Jones PA, Baylin SB. The epigenomics of cancer. Cell. 2007;128(4):683–692. doi: 10.1016/j.cell.2007.01.029. - DOI - PMC - PubMed
    1. Greer EL, Shi Y. Histone methylation: a dynamic mark in health, disease and inheritance. Nat Rev Genet. 2012;13(5):343–357. doi: 10.1038/nrg3173. - DOI - PMC - PubMed
    1. Kaniskan HÜ, et al. Inhibitors of protein methyltransferases and demethylases. Chem Rev. 2018;118(3):989–1068. doi: 10.1021/acs.chemrev.6b00801. - DOI - PMC - PubMed
    1. Kaelin WG, McKnight SL. Influence of metabolism on epigenetics and disease. Cell. 2013;153(1):56–69. doi: 10.1016/j.cell.2013.03.004. - DOI - PMC - PubMed
    1. Black JC, et al. Histone lysine methylation dynamics: establishment, regulation, and biological impact. Mol Cell. 2012;48(4):491–507. doi: 10.1016/j.molcel.2012.11.006. - DOI - PMC - PubMed

Publication types

MeSH terms

Substances