. 2023 May 11;18(5):e0285690.
doi: 10.1371/journal.pone.0285690. eCollection 2023.

Validation of a pre-established triage protocol for critically ill patients in a COVID-19 outbreak under resource scarcity: A retrospective multicenter cohort study

Affiliations

Validation of a pre-established triage protocol for critically ill patients in a COVID-19 outbreak under resource scarcity: A retrospective multicenter cohort study

Nicolas Donat et al. PLoS One. .

Abstract

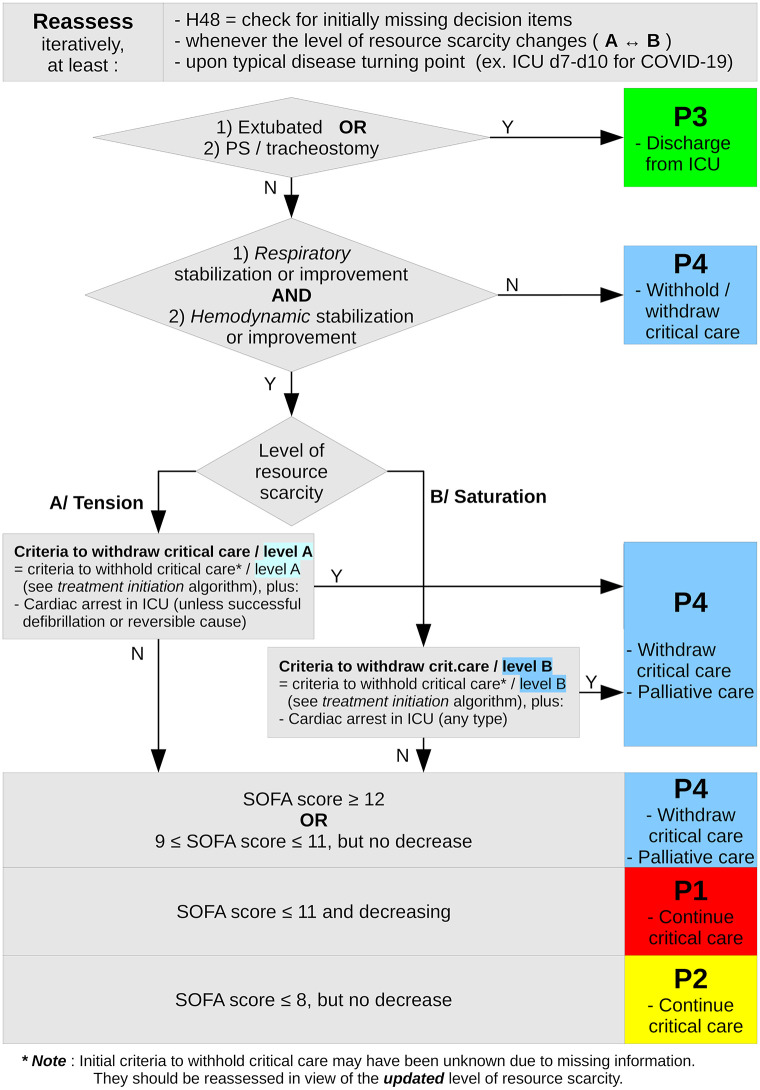
Introduction: In case of COVID-19 related scarcity of critical care resources, an early French triage algorithm categorized critically ill patients by probability of survival based on medical history and severity, with four priority levels for initiation or continuation of critical care: P1 -high priority, P2 -intermediate priority, P3 -not needed, P4 -not appropriate. This retrospective multi-center study aimed to assess its classification performance and its ability to help saving lives under capacity saturation.

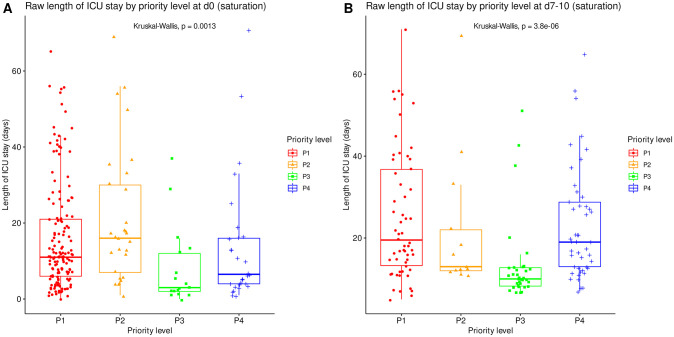
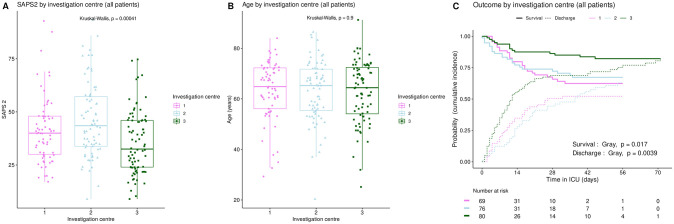
Methods: ICU patients admitted for severe COVID-19 without triage in spring 2020 were retrospectively included from three hospitals. Demographic data, medical history and severity items were collected. Priority levels were retrospectively allocated at ICU admission and on ICU day 7-10. Mortality rate, cumulative incidence of death and of alive ICU discharge, length of ICU stay and of mechanical ventilation were compared between priority levels. Calculated mortality and survival were compared between full simulated triage and no triage.

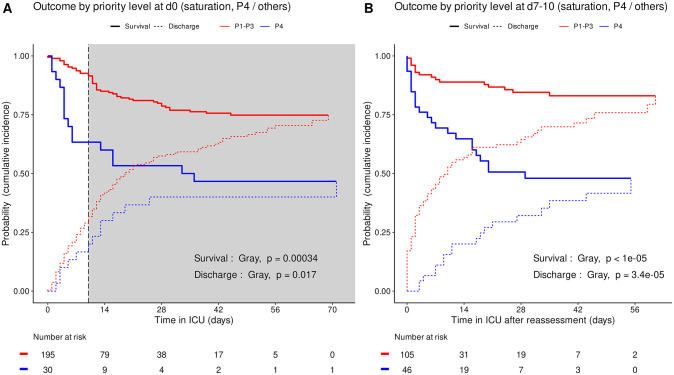
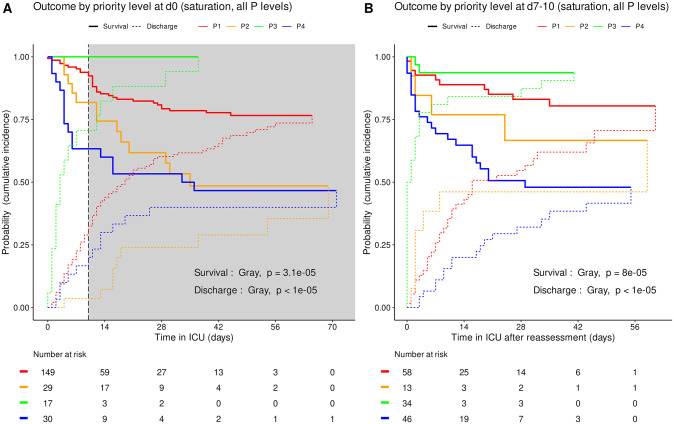
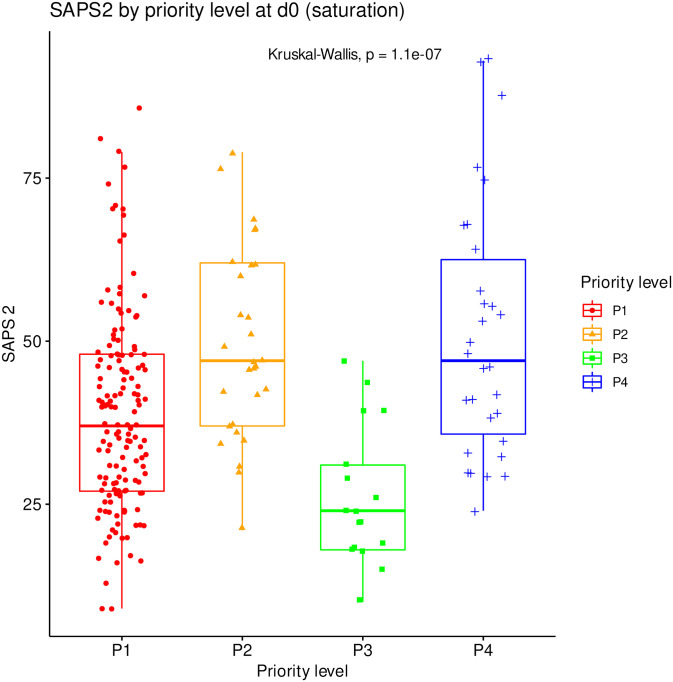
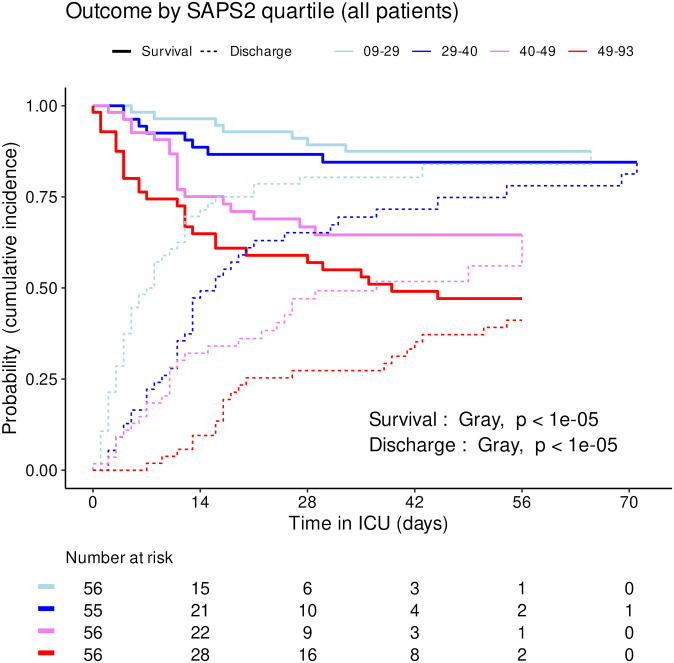
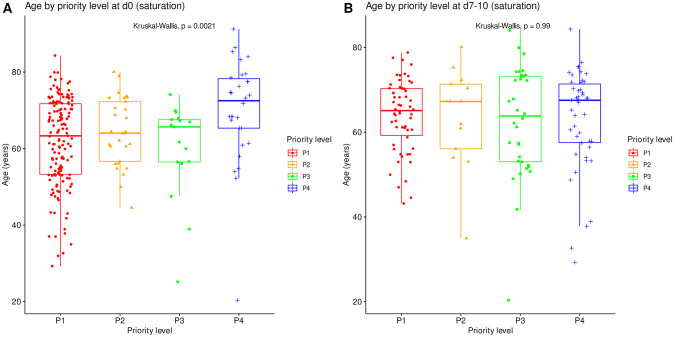
Results: 225 patients were included, aged 63.1±11.9 years. Median SAPS2 was 40 (IQR 29-49). At the end of follow-up, 61 (27%) had died, 26 were still in ICU, and 138 had been discharged. Following retrospective initial priority allocation, mortality rate was 53% among P4 patients (95CI 34-72%) versus 23% among all P1 to P3 patients (95CI 17-30%, chi-squared p = 5.2e-4). The cumulative incidence of death consistently increased in the order P3, P1, P2 and P4 both at admission (Gray's test p = 3.1e-5) and at reassessment (p = 8e-5), and conversely for that of alive ICU discharge. Reassessment strengthened consistency. Simulation under saturation showed that this two-step triage protocol could have saved 28 to 40 more lives than no triage.

Conclusion: Although it cannot eliminate potentially avoidable deaths, this triage protocol proved able to adequately prioritize critical care for patients with highest probability of survival, hence to save more lives if applied.


Conflict of interest statement

The authors have declared that no competing interests exist.

Figures

Fig 1
Fig 1. Triage algorithm for critical care initiation under resource scarcity due to COVID-19.
Summary of the first step (day 0, critical care initiation) of the SFAR/SSA critical care prioritization/triage protocol, adapted from [17] with proposed substitution of “age ≥ 85 & at least one comorbidity” to “age ≥ 85” alone.
Fig 2
Fig 2. Triage algorithm for critical care continuation under resource scarcity due to COVID-19.
Summary of the second step (day 7–10 or typical disease turning point, critical care continuation) of the SFAR/SSA critical care prioritization/triage protocol, adapted from [17]. * Note: Initial criteria to withhold critical care may have been unknown due to missing information. They should be reassessed in view of the updated level of resource scarity.
Fig 3
Fig 3. Outcome of COVID-19 ICU patients by priority level in saturation: P4 vs. others.
Cumulative incidence (c.i.) of alive discharge from ICU and survival (= 1 –c.i. of death in ICU) for COVID-19 patients: P4 compared with other priority levels at day 0 (A), and at reassessment on day 7 to 10 (B). Shaded area: initial prioritization no longer relevant due to reassessment.
Fig 4
Fig 4. Outcome of COVID-19 ICU patients by priority level in saturation: All priority levels.
Cumulative incidence (c.i.) of alive discharge from ICU and survival (= 1 –c.i. of death in ICU) for COVID-19 patients: comparison between all priority levels at day 0 (A) and at reassessment on day 7 to 10 (B). Shaded area: initial prioritization no longer relevant due to reassessment.
Fig 5
Fig 5. Raw length of ICU stay by priority level in saturation.
Length of ICU stay, irrespective of patient outcome, compared between all priority levels at day 0 (A, N = 225) and at reassessment on day 7 to 10 (B, N = 151). Boxes: median, 1st and 3rd quartiles; whiskers: Tukey’s convention (farthest points within 1.5 x IQR distance from box).
Fig 6
Fig 6. Length of mechanical ventilation by priority level in saturation.
Length of mechanical ventilation, irrespective of patient outcome, compared between all priority levels at day 0 (A, N = 225) and at reassessment on day 7 to 10 (B, N = 151). Boxes: median, 1st and 3rd quartiles; whiskers: Tukey’s convention (farthest points within 1.5 x IQR distance from box).
Fig 7
Fig 7. SAPS2 distribution by initial priority level in saturation.
SAPS2 compared between all priority levels at day 0 (N = 225). Boxes: median, 1st and 3rd quartiles; whiskers: Tukey’s convention (farthest points within 1.5 x IQR distance from box).
Fig 8
Fig 8. Outcome of COVID-19 ICU patients by SAPS2 quartile.
Cumulative incidence (c.i.) of alive discharge from ICU and survival (= 1 –c.i. of death in ICU) for COVID-19 patients: comparison between SAPS2 quartiles.
Fig 9
Fig 9. Age distribution by initial priority level in saturation.
Age compared between all priority levels at day 0 (N = 225). Boxes: median, 1st and 3rd quartiles; whiskers: Tukey’s convention (farthest points within 1.5 x IQR distance from box).
Fig 10
Fig 10. Outcome of COVID-19 ICU patients by age quartile.
Cumulative incidence (c.i.) of alive discharge from ICU and survival (= 1 –c.i. of death in ICU) for COVID-19 patients: comparison between age quartiles.
Fig 11
Fig 11. Initial severity, age and outcome compared between investigation centers.
Inter-center variations in SAPS2 (A), age (B), and ICU outcome (C). Boxplots: box–median, 1st and 3rd quartiles; whiskers–Tukey’s convention, farthest points within 1.5 x IQR distance from box. C: cumulative incidence (c.i.) of alive discharge from ICU and survival (= 1 –c.i. of death in ICU).

Similar articles

References

    1. COVID19-APHP Group. Electronic address: martin.hirsch@aphp.fr. Assistance Publique-Hôpitaux de Paris’ response to the COVID-19 pandemic. Lancet Lond Engl 2020;395:1760–1. doi: 10.1016/S0140-6736(20)31210-1 - DOI - PMC - PubMed
    1. Phua J, Weng L, Ling L, Egi M, Lim C-M, Divatia JV, et al.. Intensive care management of coronavirus disease 2019 (COVID-19): challenges and recommendations. Lancet Respir Med 2020;8:506–17. doi: 10.1016/S2213-2600(20)30161-2 - DOI - PMC - PubMed
    1. Yang X, Yu Y, Xu J, Shu H, Xia J, Liu H, et al.. Clinical course and outcomes of critically ill patients with SARS-CoV-2 pneumonia in Wuhan, China: a single-centered, retrospective, observational study. Lancet Respir Med 2020;8:475–81. doi: 10.1016/S2213-2600(20)30079-5 - DOI - PMC - PubMed
    1. Aziz S, Arabi YM, Alhazzani W, Evans L, Citerio G, Fischkoff K, et al.. Managing ICU surge during the COVID-19 crisis: rapid guidelines. Intensive Care Med 2020;46:1303–25. doi: 10.1007/s00134-020-06092-5 - DOI - PMC - PubMed
    1. Polack FP, Thomas SJ, Kitchin N, Absalon J, Gurtman A, Lockhart S, et al.. Safety and Efficacy of the BNT162b2 mRNA Covid-19 Vaccine. N Engl J Med 2020;383:2603–15. doi: 10.1056/NEJMoa2034577 - DOI - PMC - PubMed