. 2023 May 11;19(5):e1010744.
doi: 10.1371/journal.pgen.1010744. eCollection 2023 May.

Integration of a multi-omics stem cell differentiation dataset using a dynamical model

Affiliations

Integration of a multi-omics stem cell differentiation dataset using a dynamical model

Patrick R van den Berg et al. PLoS Genet. .

Abstract

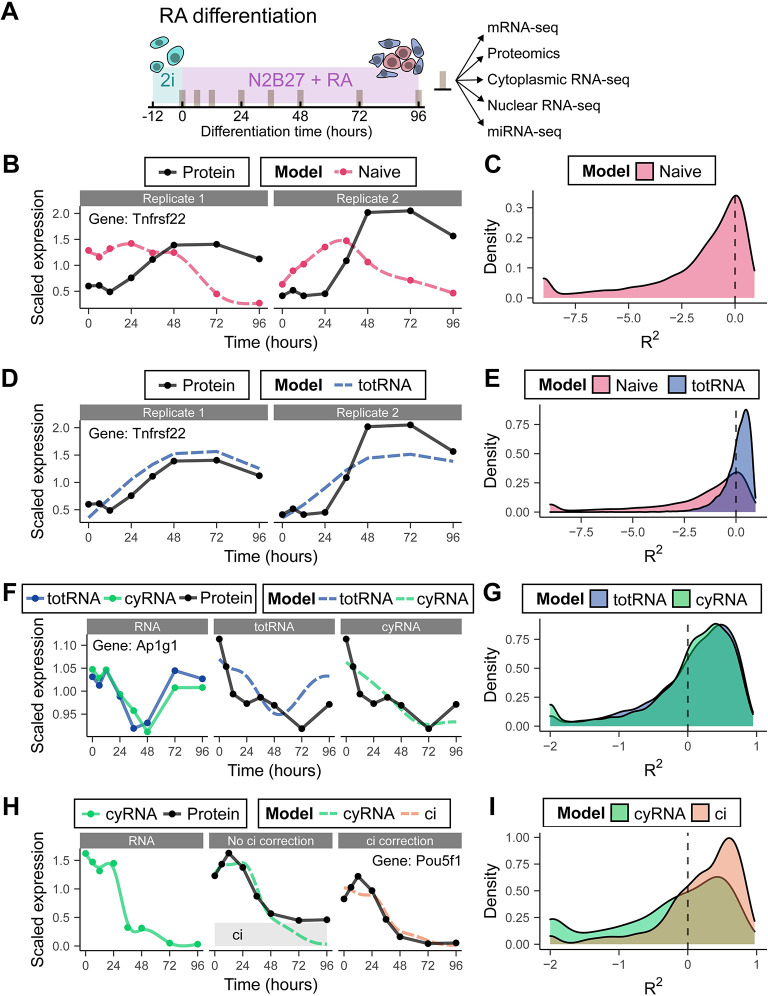
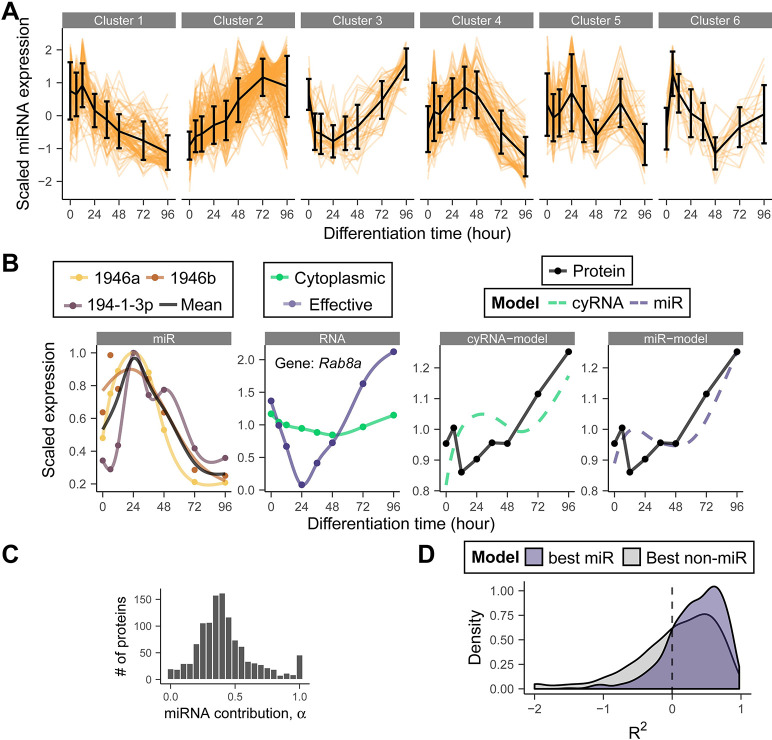
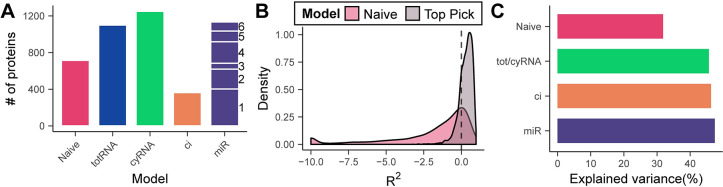
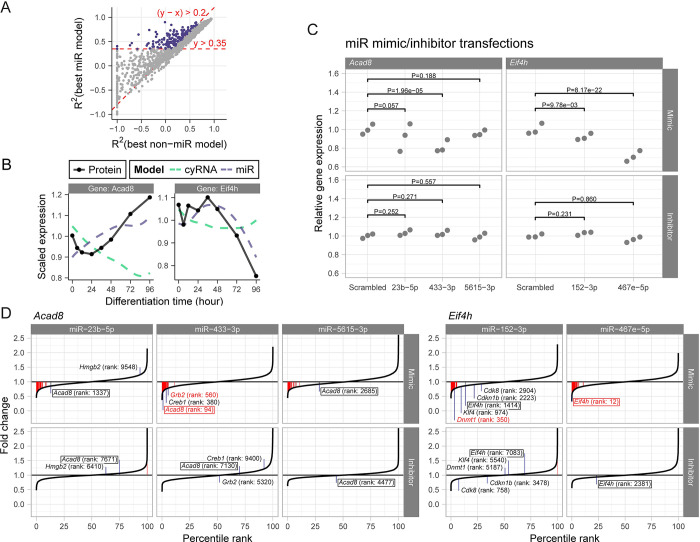
Stem cell differentiation is a highly dynamic process involving pervasive changes in gene expression. The large majority of existing studies has characterized differentiation at the level of individual molecular profiles, such as the transcriptome or the proteome. To obtain a more comprehensive view, we measured protein, mRNA and microRNA abundance during retinoic acid-driven differentiation of mouse embryonic stem cells. We found that mRNA and protein abundance are typically only weakly correlated across time. To understand this finding, we developed a hierarchical dynamical model that allowed us to integrate all data sets. This model was able to explain mRNA-protein discordance for most genes and identified instances of potential microRNA-mediated regulation. Overexpression or depletion of microRNAs identified by the model, followed by RNA sequencing and protein quantification, were used to follow up on the predictions of the model. Overall, our study shows how multi-omics integration by a dynamical model could be used to nominate candidate regulators.


Conflict of interest statement

The authors have declared that no competing interests exist.

Figures

Fig 1
Fig 1. Birth-death models outperform the naive model in predicting dynamics.
(A) Schematic overview of RA differentiation time course and subsequent omics measurements. (B) Example fit of the naive model. The naive model is a smoothing spline fit of RNA scaled to match the mean protein expression. (C) R2 distribution of the naive model. (D) Example fit of the total RNA (totRNA) model. (E) R2 distributions of the naïve and total RNA totRNA models. (F) Example fit of the total RNA and cytoplasmic RNA model, replicate 1. (G) R2 distributions of the total RNA and cytoplasmic RNA model. (H) Example fit of the cytoplasmic RNA and ci model, replicate 1. The height of the grey bar indicates the fitted ci parameter. (I) R2 distributions of the cytoplasmic RNA and ci model. Only genes that are improved by the ci model are shown. The distribution of all genes is shown in S2E Fig. (C,E,G,I) Some genes with extremely low R2 values are set to the minimum value of the plot for clarity. Corresponding Pearson’s r distributions are plotted in S2A–S2D Fig.
Fig 2
Fig 2. The addition of miRs further improves the dynamical model for a subset of genes and suggests potential miR-mRNA interactions.
(A) Expression profiles of 560 miRs in six clusters. (B) Example fit of miR model for the gene Rab8a, replicate 1. First panel: expression of the assigned miRs of a single cluster. Colored lines are individual smoothing spline fits. Second panel: Cytoplasmic RNA expression and the effective RNA concentration available for translation (see Methods). Solid lines represent smoothing splines. Third/fourth panel: cytoplasmic RNA and miR model fits. (C) Distribution of inferred α for genes that benefit from miR model. (D) R2 distribution of the miR model and the next best model (either naive, total RNA, cytoplasmic RNA or ci). Only genes that benefit from the miR model are shown. Some genes with extremely low R2 values are set to the minimum value of the plot for clarity. The corresponding Pearson’s r distribution is shown in S2F Fig.
Fig 3
Fig 3. Selecting the optimal model on a gene-by-gene basis increases the total explained variance of protein expression from 30% to 50%.
(A) Assignment of the optimal model for each gene based on the BIC. The number next to the miR bar indicates the miR cluster giving the best fit. (B) R2 distribution of the optimal fits from (A) and their naive model counterpart. Some genes with extremely low R2 values are set to the minimum value of the plot for clarity. (C) Median percentage of protein variance explained by each model. For each model, only those genes were included for which that model was the best. Fits with negative R2 were ignored.
Fig 4
Fig 4. RNA-seq of mESCs transfected with mimics or inhibitors of miRs identified by the model.
(A) Scatter plot of the R2 values for the best miR model and the best non-miR model, see Fig 2D. Colored dots are defined by the cutoffs indicated in red and represent a subset of genes with a miR-mRNA interaction of higher confidence. Some genes with extremely low R2 values are set to the minimum value of the plot for clarity. (B) miR model fits of Acad8 and Eif4H, which belong to the subset highlighted in (A). (C) Expression levels (regularized counts scaled to scrambled control) of Acad8 and Eif4H after miR mimic (top) and miR inhibitor (bottom) transfection in 3 biological replicates. P-value shown is for an uncorrected one-sided test (see Methods). Differential expression of six more target genes is shown in S5 Fig. (D) Expression fold changes relative to scrambled control after mimic and inhibitor transfections for three miRs that target Acad8 and 2 miRs that target Eif4h. Distributions of the six more targets are shown in S6 Fig. The boxed genes are our proposed targets, additionally some known targets are shown. Red color indicates significantly differentially expressed genes (Padj < = 0.01).
Fig 5
Fig 5. CDK7 protein abundance is regulated by miR-99a-5p in mESCs.
Flow cytometry of CDK7 immunostaining in 4 biological replicates of mESCs treated with miR-99a-5p mimic, inhibitor or the respective scrambled controls.

References

    1. Soldner F, Jaenisch R. iPSC Disease Modeling. Science. 2012;338: 1155–1156. doi: 10.1126/science.1227682 - DOI - PubMed
    1. Semrau S, Goldmann JE, Soumillon M, Mikkelsen TS, Jaenisch R, Oudenaarden A van. Dynamics of lineage commitment revealed by single-cell transcriptomics of differentiating embryonic stem cells. Nat Commun. 2016;8: 1096. doi: 10.1038/s41467-017-01076-4 - DOI - PMC - PubMed
    1. Loh KM, Chen A, Koh PW, Deng TZ, Sinha R, Tsai JM, et al.. Mapping the Pairwise Choices Leading from Pluripotency to Human Bone, Heart, and Other Mesoderm Cell Types. Cell. 2016;166: 451–467. doi: 10.1016/j.cell.2016.06.011 - DOI - PMC - PubMed
    1. Klein AM, Mazutis L, Akartuna I, Tallapragada N, Veres A, Li V, et al.. Droplet Barcoding for Single-Cell Transcriptomics Applied to Embryonic Stem Cells. Cell. 2015;161: 1187–1201. doi: 10.1016/j.cell.2015.04.044 - DOI - PMC - PubMed
    1. Cuomo ASE, Seaton DD, McCarthy DJ, Martinez I, Bonder MJ, Garcia-Bernardo J, et al.. Single-cell RNA-sequencing of differentiating iPS cells reveals dynamic genetic effects on gene expression. Nat Commun. 2020;11: 810. doi: 10.1038/s41467-020-14457-z - DOI - PMC - PubMed

Publication types